Estimated zip code population in 2022: 7,554 Zip code population in 2010: 6,648 Zip code population in 2000: 9,261
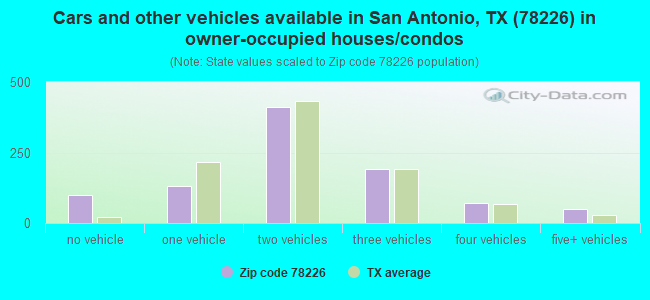
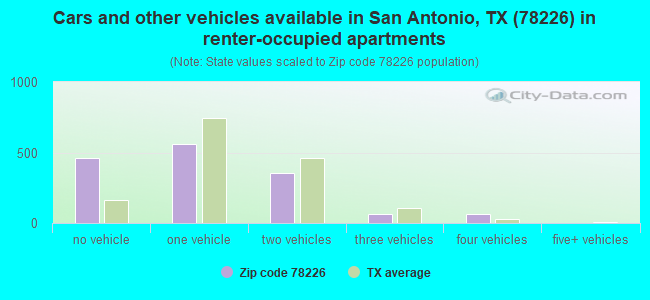
Houses and condos: 2,995 Renter-occupied apartments: 1,499
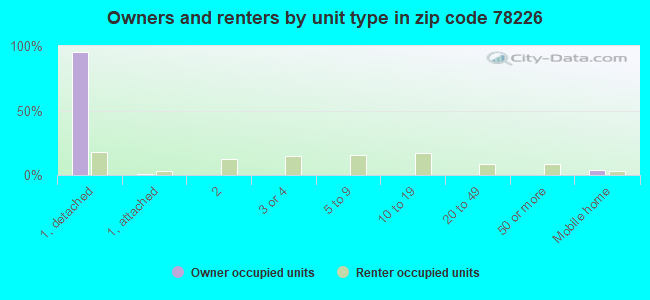
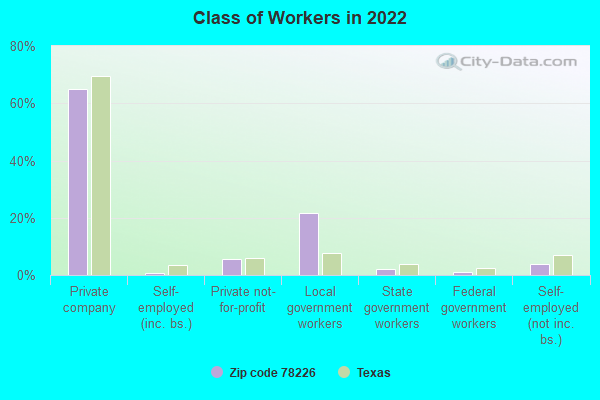
% of renters here:
61%
State:
38%
March 2022 cost of living index in zip code 78226: 87.2 (less than average, U.S. average is 100)
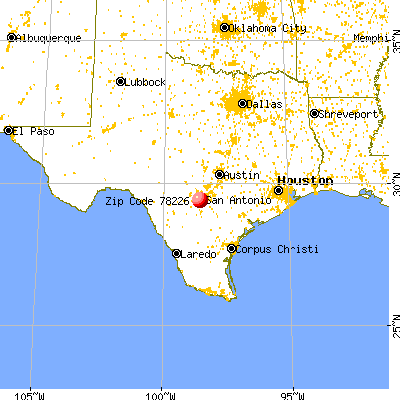
Land area: 7.1 sq. mi. Water area: 0.0 sq. mi.
Population density: 1,058 people per square mile
(low).
OSM Map
General Map
Google Map
MSN Map
OSM Map
General Map
Google Map
MSN Map
OSM Map
General Map
Google Map
MSN Map
OSM Map
General Map
Google Map
MSN Map
Please wait while loading the map...
Real estate property taxes paid for housing units in 2022:
This zip code:
1.3% ($1,580)
Texas:
1.5% ($4,050)
Median real estate property taxes paid for housing units with mortgages in 2022: $2,358 (1.8%) Median real estate property taxes paid for housing units with no mortgage in 2022: $1,180 (1.0%)
Business Search- 14 Million verified businesses
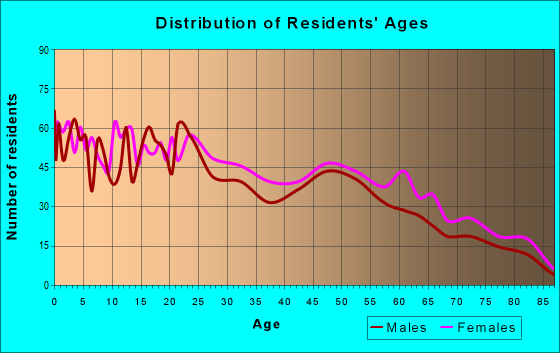
Males: 3,458
(45.8%)
Females: 4,096
(54.2%)
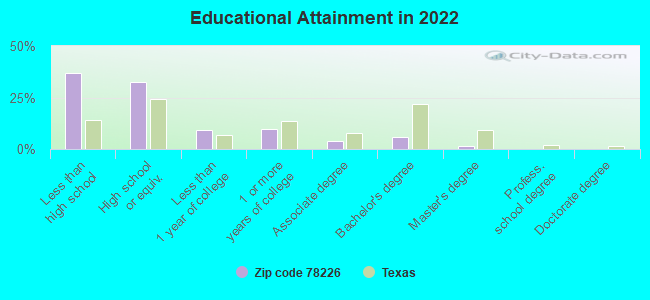
For population 25 years and over in 78226:
High school or higher: 61.5%
Bachelor's degree or higher: 7.3%
Graduate or professional degree: 1.6%
Unemployed: 7.7%
Mean travel time to work (commute): 33.7 minutes
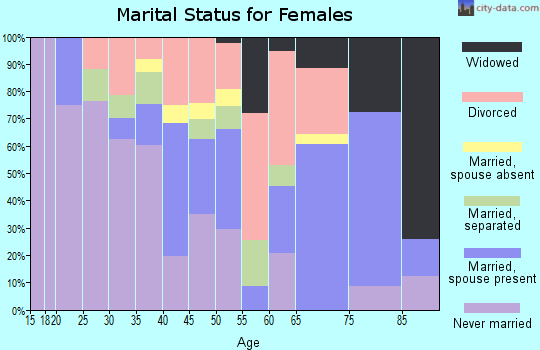
For population 15 years and over in 78226:
Never married: 44.1%
Now married: 35.6%
Separated: 2.8%
Widowed: 5.9%
Divorced: 11.7%
Zip code 78226 compared to state average:
Median household income significantly below state average.
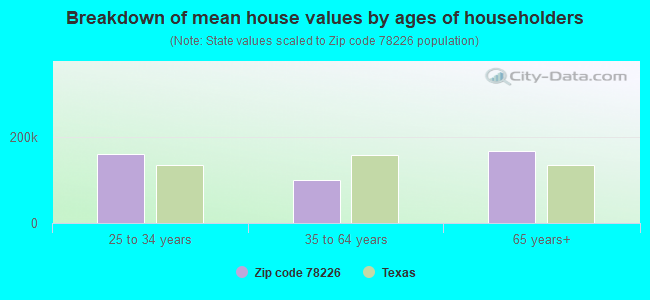
Median house value significantly below state average.
Unemployed percentage above state average.
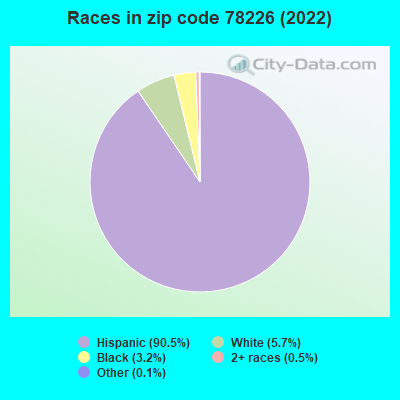
Black race population percentage significantly below state average.
Hispanic race population percentage above state average.
Renting percentage above state average.
Length of stay since moving in significantly above state average.
House age above state average.
Percentage of population with a bachelor's degree or higher significantly below state average.
Averages for the 2020 tax year for zip code 78226, filed in 2021:
Average Adjusted Gross Income (AGI) in 2020: $31,492 (Individual Income Tax Returns)
Here:
$31,492
State:
$77,054
Salary/wage: $28,650 (reported on 83.1% of returns)
Here:
$28,650
State:
$62,766
(% of AGI for various income ranges: 1125.7% for AGIs below $25k, 3409.9% for AGIs $25k-50k, 5580.8% for AGIs $50k-75k, 8938.3% for AGIs $75k-100k, 13748.0% for AGIs $100k-200k)
Taxable interest for individuals: $360 (reported on 8.3% of returns)
This zip code:
$360
Texas:
$2,665
(% of AGI for various income ranges: 1.3% for AGIs below $25k, 3.0% for AGIs $25k-50k, 13.5% for AGIs $50k-75k, 22.0% for AGIs $100k-200k)
Ordinary dividends: $300 (reported on 1.3% of returns)
Here:
$300
State:
$10,044
(% of AGI for various income ranges: 0.7% for AGIs below $25k, 1.5% for AGIs $50k-75k)
Net capital gain/loss in AGI: +$161,450 (reported on 1.3% of returns)
Here:
+$161,450
State:
+$39,590
(% of AGI for various income ranges: 0.4% for AGIs below $25k, 2481.9% for AGIs $50k-75k)
Profit/loss from business: +$6,525 (reported on 15.9% of returns)
Here:
+$6,525
State:
+$10,888
(% of AGI for various income ranges: 211.9% for AGIs below $25k, 36.8% for AGIs $25k-50k, 96.2% for AGIs $50k-75k)
Taxable individual retirement arrangement distribution: $8,129 (reported on 2.3% of returns)
78226:
$8,129
Texas:
$24,740
(% of AGI for various income ranges: 20.8% for AGIs below $25k, 122.7% for AGIs $50k-75k)
Total itemized deductions: $43,900 (reported on 1.3% of returns)
Here:
$43,900
State:
$40,428
(% of AGI for various income ranges: 675.4% for AGIs $50k-75k)
Charity contributions: $28,167 (reported on 1.0% of returns)
Here:
$28,167
State:
$18,201
(% of AGI for various income ranges: 91.8% for AGIs $25k-50k)
Taxes paid: $5,767 (reported on 1.0% of returns)
78226:
$5,767
State:
$7,821
(% of AGI for various income ranges: 18.8% for AGIs $25k-50k)
Earned income credit: $2,838 (reported on 36.2% of returns)
Here:
$2,838
State:
$2,584
(% of AGI for various income ranges: 172.9% for AGIs below $25k, 110.7% for AGIs $25k-50k)
Percentage of individuals using paid preparers for their 2020 taxes: 93.0%
Here:
93%
State:
92%
(% for various income ranges: 90.5% for AGIs below $25k, 95.3% for AGIs $25k-50k, 93.5% for AGIs $50k-75k, 100.0% for AGIs $75k-100k, 100.0% for AGIs $100k-200k)
Averages for the 2012 tax year for zip code 78226, filed in 2013:
Average Adjusted Gross Income (AGI) in 2012: $26,199 (Individual Income Tax Returns)
Here:
$26,199
State:
$65,384
Salary/wage: $25,025 (reported on 85.2% of returns)
Here:
$25,025
State:
$52,524
(% of AGI for various income ranges: 76.7% for AGIs below $25k, 86.3% for AGIs $25k-50k, 79.6% for AGIs $50k-75k, 79.1% for AGIs $75k-100k, 85.5% for AGIs $100k-200k)
Taxable interest for individuals: $537 (reported on 10.0% of returns)
This zip code:
$537
Texas:
$2,372
(% of AGI for various income ranges: 0.2% for AGIs below $25k, 0.2% for AGIs $25k-50k, 0.4% for AGIs $50k-75k, 0.1% for AGIs $75k-100k)
Ordinary dividends: $400 (reported on 1.8% of returns)
Here:
$400
State:
$9,721
Net capital gain/loss in AGI: +$2,075 (reported on 1.5% of returns)
Here:
+$2,075
State:
+$35,319
Profit/loss from business: +$7,412 (reported on 12.5% of returns)
Here:
+$7,412
State:
+$13,732
(% of AGI for various income ranges: 10.8% for AGIs below $25k, 0.6% for AGIs $25k-50k)
Taxable individual retirement arrangement distribution: $6,111 (reported on 3.3% of returns)
78226:
$6,111
Texas:
$19,511
(% of AGI for various income ranges: 0.5% for AGIs below $25k, 0.6% for AGIs $25k-50k, 2.2% for AGIs $50k-75k)
Total itemized deductions: $16,593 (34% of AGI, reported on 5.5% of returns)
Here:
$16,593
State:
$24,724
Here:
33.6% of AGI
State:
15.9% of AGI
(% of AGI for various income ranges: 1.7% for AGIs below $25k, 3.2% for AGIs $25k-50k, 4.9% for AGIs $50k-75k, 9.4% for AGIs $75k-100k)
Charity contributions: $2,670 (reported on 3.7% of returns)
Here:
$2,670
State:
$6,808
(% of AGI for various income ranges: 0.4% for AGIs $25k-50k, 0.7% for AGIs $50k-75k, 1.0% for AGIs $75k-100k)
Taxes paid: $3,354 (reported on 4.8% of returns)
78226:
$3,354
State:
$6,921
(% of AGI for various income ranges: 0.2% for AGIs below $25k, 0.5% for AGIs $25k-50k, 1.1% for AGIs $50k-75k, 1.9% for AGIs $75k-100k)
Earned income credit: $2,770 (reported on 41.7% of returns)
Here:
$2,770
State:
$2,570
(% of AGI for various income ranges: 12.0% for AGIs below $25k, 1.9% for AGIs $25k-50k)
Percentage of individuals using paid preparers for their 2012 taxes: 46.9%
Here:
47%
State:
51%
(% for various income ranges: 48.1% for AGIs below $25k, 42.3% for AGIs $25k-50k, 47.6% for AGIs $50k-75k, 75.0% for AGIs $75k-100k)
Averages for the 2004 tax year for zip code 78226, filed in 2005:
Average Adjusted Gross Income (AGI) in 2004: $22,609 (Individual Income Tax Returns)
Here:
$22,609
State:
$47,881
Salary/wage: $21,977 (reported on 86.5% of returns)
Here:
$21,977
State:
$41,947
(% of AGI for various income ranges: 87.2% for AGIs below $10k, 81.8% for AGIs $10k-25k, 83.1% for AGIs $25k-50k, 86.8% for AGIs $50k-75k, 84.5% for AGIs $75k-100k, 95.0% for AGIs over 100k)
Taxable interest for individuals: $705 (reported on 14.4% of returns)
This zip code:
$705
Texas:
$2,255
(% of AGI for various income ranges: 1.0% for AGIs below $10k, 0.4% for AGIs $10k-25k, 0.6% for AGIs $25k-50k, 0.2% for AGIs $50k-75k, 0.2% for AGIs $75k-100k, 0.3% for AGIs over 100k)
Taxable dividends: $304 (reported on 3.1% of returns)
Here:
$304
State:
$4,261
(% of AGI for various income ranges: 0.1% for AGIs below $10k, 0.0% for AGIs $10k-25k, 0.0% for AGIs $25k-50k, 0.1% for AGIs $50k-75k, 0.2% for AGIs $75k-100k)
Net capital gain/loss: +$566 (reported on 1.8% of returns)
Here:
+$566
State:
+$16,110
Profit/loss from business: +$5,375 (reported on 10.2% of returns)
Here:
+$5,375
State:
+$11,013
(% of AGI for various income ranges: 10.2% for AGIs below $10k, 4.6% for AGIs $10k-25k, 1.1% for AGIs $25k-50k, -0.2% for AGIs $50k-75k)
Total itemized deductions: $13,434 (26% of AGI, reported on 3.3% of returns)
Here:
$13,434
State:
$19,631
Here:
26.2% of AGI
State:
18.9% of AGI
(% of AGI for various income ranges: 0.9% for AGIs $10k-25k, 2.1% for AGIs $25k-50k, 2.9% for AGIs $50k-75k, 11.1% for AGIs $75k-100k)
Charity contributions deductions: $2,405 (5% of AGI, reported on 2.6% of returns)
Here:
$2,405
State:
$4,753
Here:
5.0% of AGI
State:
4.2% of AGI
(% of AGI for various income ranges: 0.1% for AGIs $10k-25k, 0.2% for AGIs $25k-50k, 0.6% for AGIs $50k-75k, 1.7% for AGIs $75k-100k)
Total tax: $2,290 (reported on 54.7% of returns)
78226:
$2,290
State:
$9,058
(% of AGI for various income ranges: 2.0% for AGIs below $10k, 2.8% for AGIs $10k-25k, 4.9% for AGIs $25k-50k, 8.8% for AGIs $50k-75k, 10.2% for AGIs $75k-100k, 18.6% for AGIs over 100k)
Earned income credit: $2,144 (reported on 43.9% of returns)
Here:
$2,144
State:
$2,024
Percentage of individuals using paid preparers for their 2004 taxes: 62.1%
Here:
62%
State:
57%
(% for various income ranges: 61.0% for AGIs below $10k, 67.1% for AGIs $10k-25k, 57.4% for AGIs $25k-50k, 49.4% for AGIs $50k-75k, 47.1% for AGIs $75k-100k, 81.0% for AGIs over 100k)
Household received Food Stamps/SNAP in the past 12 months: 984 Household did not receive Food Stamps/SNAP in the past 12 months: 1,500
Women who had a birth in the past 12 months: 145 (94 now married, 50 unmarried) Women who did not have a birth in the past 12 months: 1,858 (524 now married, 1,343 unmarried)
Housing units in zip code 78226 with a mortgage: 287 (6 second mortgage, 7 both second mortgage and home equity loan) Median monthly owner costs for units with a mortgage: $1,143 Median monthly owner costs for units without a mortgage: $384
Residents with income below the poverty level in 2022:
This zip code:
31.0%
Whole state:
14.0%
Residents with income below 50% of the poverty level in 2022:
This zip code:
13.9%
Whole state:
7.4%
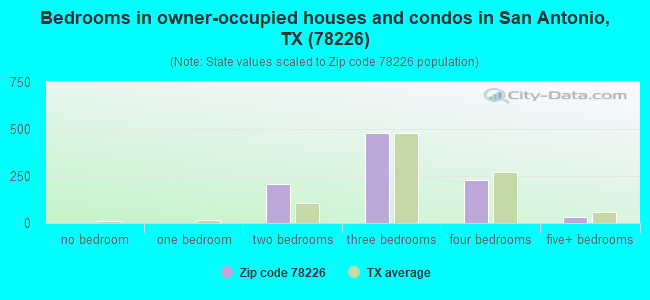
Median number of rooms in houses and condos:
Here:
5.8
State:
6.3
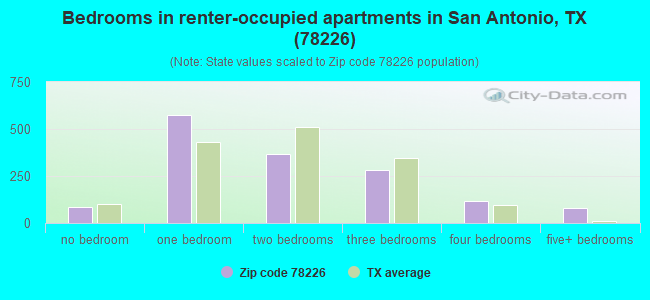
Median number of rooms in apartments:
Here:
4.1
State:
4.0
Notable locations in this zip code not listed on our city pages
Churches in zip code 78226 include: Iglesia Bautista Cristo Rey Church (A), Saint John Berchmans Church (B), Apostolic Church of the Almighty God (C). Display/hide their locations on the map
801 married couples with children.
638 single-parent households (52 men, 586 women).
51.5% of residents of 78226 zip code speak English at home.
48.9% of residents speak Spanish at home (61% very well, 18% well, 10% not well, 10% not at all).
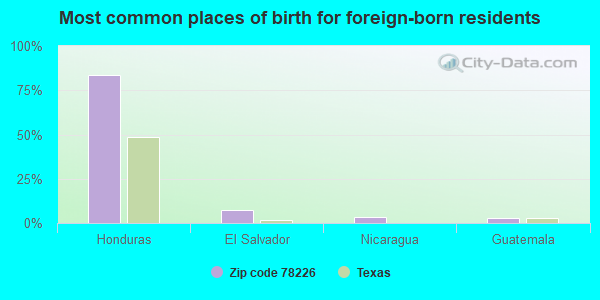
Foreign born population: 870 (11.5%) (26.0% of them are naturalized citizens)
Facilities with environmental interests located in this zip code:
AESYS LIMITED LIABILITY PARTNERSHIP (303 INDUSTRIAL PARK BUILDING 303-3 in SAN ANTONIO, TX)
(Resource Conservation and Recovery Act (tracking hazardous waste)) Business NAICS classification: OTHER AIRCRAFT PARTS AND AUXILIARY EQUIPMENT MANUFACTURING. Alternative names: AESYS KAC
AESYS LIMITED LIABILITY PARTNERSHIP (612 PERRIN RD BLDG 348-4 in SAN ANTONIO, TX)
(Resource Conservation and Recovery Act (tracking hazardous waste)) Business NAICS classification: OTHER AIRCRAFT PARTS AND AUXILIARY EQUIPMENT MANUFACTURING. Alternative names: AESYS KAC
307 RED HORSE SQUADRON (202 RED HORSE DR BUILDING 3761 in SAN ANTONIO, TX) . Federal Facility. U.S. AIR FORCE
Conditionally Exempt Small Quantity Generators, less than 100 kg/month of hazardous waste (Resource Conservation and Recovery Act (tracking hazardous waste)) - notification Organizations: HQ AFRC (CONTACT/OPERATOR)
Alternative names: 307 REDHORSE SQUADRON
AESYS LIMITED LIABILITY PARTNERSHIP (308 AVION CIRCLE BUILDING 308-4 in SAN ANTONIO, TX)
(Resource Conservation and Recovery Act (tracking hazardous waste)) Business NAICS classification: OTHER AIRCRAFT PARTS AND AUXILIARY EQUIPMENT MANUFACTURING. Alternative names: AESYS KAC
AESYS LIMITED LIABILITY PARTNERSHIP (616 PERRIN RD BUILDING 333-4 in SAN ANTONIO, TX)
(Resource Conservation and Recovery Act (tracking hazardous waste)) Business NAICS classification: OTHER AIRCRAFT PARTS AND AUXILIARY EQUIPMENT MANUFACTURING. Alternative names: AESYS KAC
AESYS LIMITED LIABILITY PARTNERSHIP (580 PERRIN RD BUILDING 329-4 in SAN ANTONIO, TX)
(Resource Conservation and Recovery Act (tracking hazardous waste)) Business NAICS classification: OTHER AIRCRAFT PARTS AND AUXILIARY EQUIPMENT MANUFACTURING. Alternative names: AESYS KAC
AESYS LIMITED LIABILITY PARTNERSHIP (505 PERRIN RD BLDG 324-4 in SAN ANTONIO, TX)
(Resource Conservation and Recovery Act (tracking hazardous waste)) Business NAICS classification: OTHER AIRCRAFT PARTS AND AUXILIARY EQUIPMENT MANUFACTURING. Alternative names: AESYS KAC
Housing units lacking complete plumbing facilities: 10.0% Housing units lacking complete kitchen facilities: 12.2%
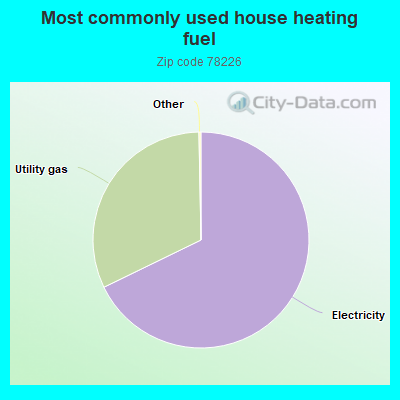
67.8%Electricity
31.9%Utility gas
Population in 1990: 7,141. Population change in the 1990s: +2,120 (+29.7%).
Place of birth for U.S.-born residents:
This state: 6,109
Northeast: 62
Midwest: 128
South: 118
West: 133
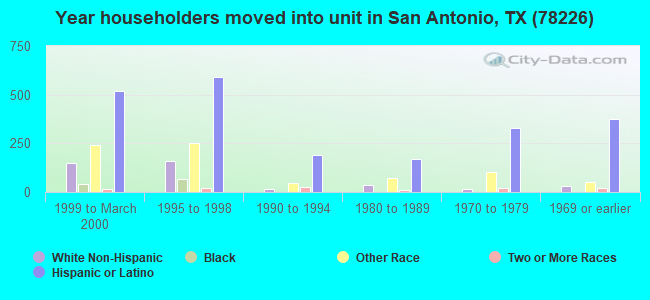
50% of the 78226 zip code residents lived in the same house 5 years ago. Out of people who lived in different houses, 61% lived in this county. Out of people who lived in different counties, 50% lived in Texas.
80% of the 78226 zip code residents lived in the same house 1 year ago. Out of people who lived in different houses, 70% moved from this county. Out of people who lived in different houses, 4% moved from different county within same state. Out of people who lived in different houses, 17% moved from different state. Out of people who lived in different houses, 5% moved from abroad.
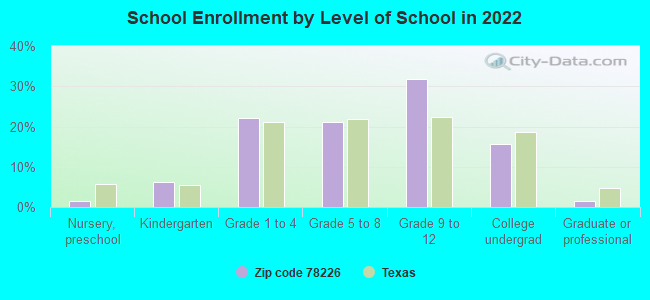
Private vs. public school enrollment:
Students in private schools in grades 1 to 8 (elementary and middle school): 30
Here:
3.6%
Texas:
8.8%
Students in private schools in grades 9 to 12 (high school):
Here:
0.0%
Texas:
8.0%
Students in private undergraduate colleges: 4
Here:
1.6%
Texas:
16.2%
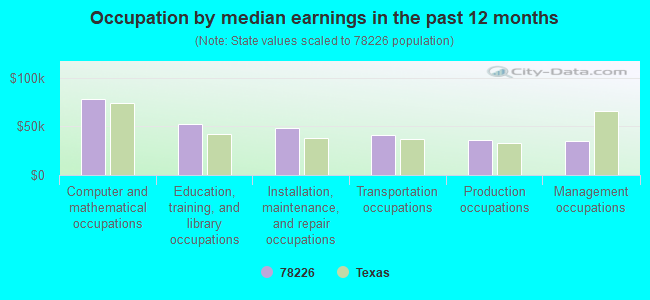
Occupation by median earnings in the past 12 months ($)
78,310Computer and mathematical occupations
52,283Education, training, and library occupations
48,785Installation, maintenance, and repair occupations
41,313Transportation occupations
36,005Production occupations
34,768Management occupations
Companies with federal contracts located in this zip code (SAN ANTONIO, TX):
PRATT & WHITNEY MILITARY AFTER (503 SHOP LANE) : $292,827,076 in 594 contractsfrom 2000 to 2006
Contracts for Gas Turbines and Jet Engines, Aircraft; Prime Moving, and Components, Modification of Equipment -- Engines, Turbines, and Components, Engine Fuel System Components, Aircraft and Missile Prime Movers, Miscellaneous Engine Accessories, Aircraft, and moreby Air Force, Navy, Defense Logistics Agency Signed by year:2000: $196,511; 2001: $50,881,425; 2002: $45,191,487; 2003: $29,921,467; 2004: $62,557,606; 2005: $75,115,073; 2006: $28,963,507.
Biggest contracts:
$19,234,000 with Air Force for Gas Turbines and Jet Engines, Aircraft; Prime Moving, and Components. Signed on 2001-10-25. Completion date: 2002-10-31.
$19,203,100, same as above.Signed on 2003-12-22. Completion date: 2004-09-30.
$12,332,576, same as above.Signed on 2005-01-26. Completion date: 2005-03-01.
$11,325,100, same as above.Signed on 2004-11-12. Completion date: 2005-06-30.
STANDARD AERO (SAN ANTONIO) IN (661 DUNCAN DR STE 213) : $25,165,999 in 48 contractsfrom 2003 to 2006
Contracts for Gas Turbines and Jet Engines, Aircraft; Prime Moving, and Components, Systems Engineering Services, Other Education and Training Services, Maintenance, Repair and Rebuilding of Equipment -- Maintenance and Repair Shop Equipment, and moreby Navy, Air Force, Army Signed by year:2000: $0; 2001: $0; 2002: $0; 2003: $9,650,690; 2004: $10,325,836; 2005: $5,194,473; 2006: -$5,000.
Biggest contracts:
$5,735,662 with Navy for Gas Turbines and Jet Engines, Aircraft; Prime Moving, and Components. Signed on 2004-02-06. Completion date: 2004-04-30.
$5,056,076, same as above.Signed on 2003-12-22. Completion date: 2008-09-30.
$4,202,000 with Air Force for Systems Engineering Services. Taking place in OK. Signed on 2003-02-26. Completion date: 2004-03-25.
$1,645,184 with Navy for Gas Turbines and Jet Engines, Aircraft; Prime Moving, and Components. Signed on 2005-01-07. Completion date: 2006-01-06.
PRATT & WHITNEY SERVICES, INC (333 MORRIS WITT STREET) : $18,482,549 in 46 contractsfrom 2001 to 2003
Contracts for Gas Turbines and Jet Engines, Aircraft; Prime Moving, and Components, Bearings, Antifriction, Unmounted, Gears, Pulleys, Sprockets, and Transmission Chain, Engine Instruments, and moreby Air Force, Defense Logistics Agency Signed by year:2000: $0; 2001: $5,396,694; 2002: $12,154,309; 2003: $931,546; 2004: $0; 2005: $0; 2006: $0.
Biggest contracts:
$7,066,857 with Air Force for Gas Turbines and Jet Engines, Aircraft; Prime Moving, and Components. Signed on 2002-09-27. Completion date: 2003-06-30.
$1,712,912 with Air Force for Bearings, Antifriction, Unmounted. Signed on 2002-12-16. Completion date: 2003-02-28.
$836,060 with Air Force for Gas Turbines and Jet Engines, Aircraft; Prime Moving, and Components. Signed on 2002-11-12. Completion date: 2003-01-31.
$705,249, same as above.Signed on 2002-08-28. Completion date: 2002-10-31.
CHROMALLOY COMPONENT SERVICES (303 INDUSTRIAL PARK) : $15,203,329 in 21 contractsfrom 2002 to 2006
Contracts for Gas Turbines and Jet Engines, Aircraft; Prime Moving, and Components, Packing and Gasket Materials by Air Force, Defense Logistics Agency Signed by year:2000: $0; 2001: $0; 2002: $141,860; 2003: $4,704,820; 2004: $6,116,599; 2005: $4,047,060; 2006: $192,990.
Biggest contracts:
$4,187,850 with Air Force for Gas Turbines and Jet Engines, Aircraft; Prime Moving, and Components. Signed on 2004-10-20. Completion date: 2006-09-30.
$1,954,330, same as above.Signed on 2003-12-15. Completion date: 2008-11-05.
$1,833,180, same as above.Signed on 2005-12-21. Completion date: 2006-02-28.
$1,675,140, same as above.Signed on 2003-12-15. Completion date: 2008-11-05.
J SANCHEZ CONTRACTING, INC (303 CLARENCE TINKER DRIVE,; small business) : $178,623 in 5 contractsfrom 2000 to 2006
Contracts for Maintenance, Repair or Alteration of Real Property -- Highways, Roads, Streets, Bridges, and Railways (includes resurfacing), Construction of Structures and Facilities -- Office Buildings, Maintenance, Repair or Alteration of Real Property -- Office Buildings, Maintenance, Repair or Alteration of Real Property -- Restoration of real property, and moreby Army, Air Force Signed by year:2000: $78,107; 2001: $0; 2002: $0; 2003: $0; 2004: $0; 2005: $18,669; 2006: $81,847.
Biggest contracts:
$78,107 with Army for Maintenance, Repair or Alteration of Real Property -- Highways, Roads, Streets, Bridges, and Railways (includes resurfacing). Signed on 2000-09-06. Completion date: 2001-01-12.
$55,168 with Air Force for Construction of Structures and Facilities -- Office Buildings. Signed on 2006-06-23. Completion date: 2006-09-22.
$26,679 with Army for Maintenance, Repair or Alteration of Real Property -- Office Buildings. Signed on 2006-06-15. Effective on 2006-06-13. Completion date: 2006-07-31.
$13,826 with Air Force for Maintenance, Repair or Alteration of Real Property -- Restoration of real property. Signed on 2005-09-29. Completion date: 2005-10-30.
ARROW ELECTRICAL CONTRACTORS, (300 INDUSTRIAL PARK RD; small business) : $27,030 in 3 contractsfrom 2002 to 2004
$15,282 with Air Force for Maintenance, Repair or Alteration of Real Property -- Miscellaneous Buildings. Signed on 2004-06-30. Completion date: 2004-08-24.
$11,748, same as above.Signed on 2002-07-19. Completion date: 2002-07-21.
$0, same as above.Signed on 2002-07-19. Completion date: 2002-07-21.
CARTSMITH SERVICE AND REPAIR (304 INDUSTRIAL PARK RD; small business) : $13,365 in 4 contractsfrom 2004 to 2005
$5,650 with Air Force for Maintenance, Repair and Rebuilding of Equipment -- Miscellaneous. Signed on 2005-10-01. Completion date: 2006-09-30.
$5,500 with Air Force for Maintenance, Repair and Rebuilding of Equipment -- Ground Effect Vehicles, Motor Vehicles, Trailers, and Cycles. Signed on 2004-10-01. Completion date: 2005-09-30.
$4,858 with Air Force for Passenger Motor Vehicles. Signed on 2005-06-06. Completion date: 2005-06-09.
-$2,643 with Air Force for Maintenance, Repair and Rebuilding of Equipment -- Ground Effect Vehicles, Motor Vehicles, Trailers, and Cycles. Signed on 2005-04-25. Completion date: 2005-05-05.
L H NETWORK INC (303 CLARENCE TINKER DR ST; small business) : $8,999 in 9 contractsfrom 2004 to 2006
Contracts for Miscellaneous Electric Power and Distribution Equipment, Converters, Electrical, Nonrotating, Specialized Test and Handling Equipment, Nuclear Ordnance, Electrical and Electronic assemblies, Boards, Cards, and Associated Hardware, and moreby Air Force, Navy Signed by year:2000: $0; 2001: $0; 2002: $0; 2003: $0; 2004: $69,653; 2005: $0; 2006: -$60,654.
Biggest contracts:
$48,283 with Air Force for Miscellaneous Electric Power and Distribution Equipment. Signed on 2004-06-23. Completion date: 2004-06-30.
$21,370 with Navy for Converters, Electrical, Nonrotating. Signed on 2004-04-21. Completion date: 2004-11-23.
$9,988 with Air Force for Specialized Test and Handling Equipment, Nuclear Ordnance. Signed on 2005-05-10. Completion date: 2006-02-28.
$0 with Air Force for Electrical and Electronic assemblies, Boards, Cards, and Associated Hardware. Signed on 2006-05-08. Completion date: 2006-08-31.
Top industries in this zip code by the number of employees in 2005:
2002 - 2018 National Fire Incident Reporting System (NFIRS) incidents
According to the data from the years 2002 - 2018 the average number of fire incidents per year is 22. The highest number of reported fire incidents - 44 took place in 2003, and the least - 0 in 2008. The data has a decreasing trend.
When looking into fire subcategories, the most incidents belonged to: Outside Fires (49.6%), and Mobile Property/Vehicle Fires (22.3%).
Fire incident types reported to NFIRS in Zip Code 78226


 Nearest zip codes: 78243, 78237, 78211, 78225, 78236, 78242.
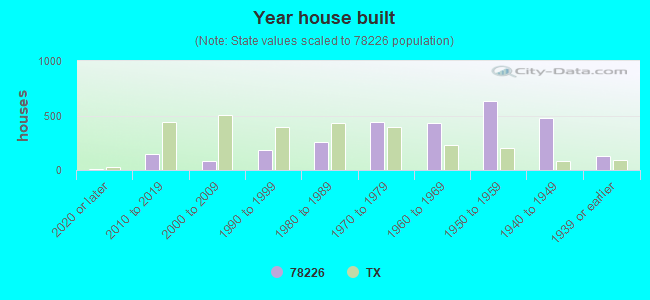


 According to the data from the years 2002 - 2018 the average number of fire incidents per year is 22. The highest number of reported fire incidents - 44 took place in 2003, and the least - 0 in 2008. The data has a decreasing trend.
 When looking into fire subcategories, the most incidents belonged to: Outside Fires (49.6%), and Mobile Property/Vehicle Fires (22.3%).