Estimated zip code population in 2022: 14,173
Zip code population in 2010: 13,025
Zip code population in 2000: 13,553
Houses and condos: 5,817
Renter-occupied apartments: 1,745
% of renters here:
32%State:
38%
March 2022 cost of living index in zip code 78225: 86.1
(less than average, U.S. average is 100)
Land area: 2.0
sq. mi.
Water area: 0.0
sq. mi.
Population density: 7,228 people per square mile (high).
OSM Map
General Map
Google Map
MSN Map
OSM Map
General Map
Google Map
MSN Map
OSM Map
General Map
Google Map
MSN Map
OSM Map
General Map
Google Map
MSN Map
Please wait while loading the map...
Real estate property taxes paid for housing units in 2022:
This zip code:
1.7% ($1,894)Texas:
1.5% ($4,050)
Median real estate property taxes paid for housing units with mortgages in 2022: $2,075 (1.7%)
Median real estate property taxes paid for housing units with no mortgage in 2022: $1,680 (1.5%)
Business Search - 14 Million verified businesses
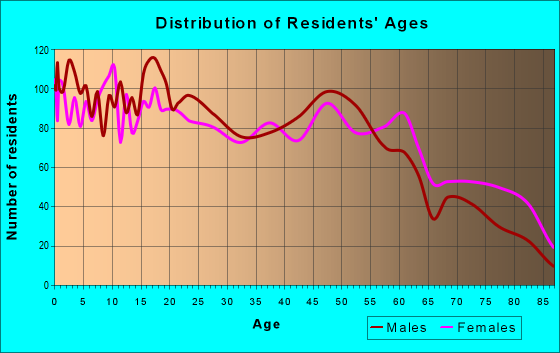
Males: 6,715 Females: 7,457
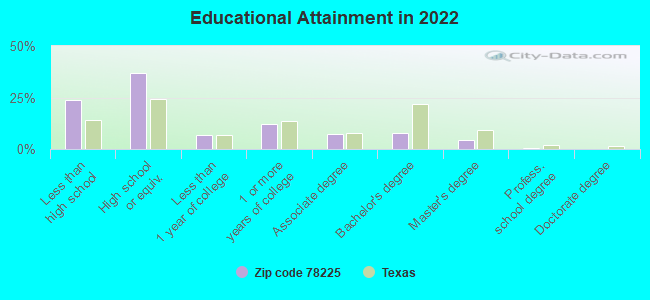
For population 25 years and over in 78225:
High school or higher: 74.1%Bachelor's degree or higher: 12.8%Graduate or professional degree: 5.1%Unemployed: 6.5%Mean travel time to work (commute): 20.8 minutes
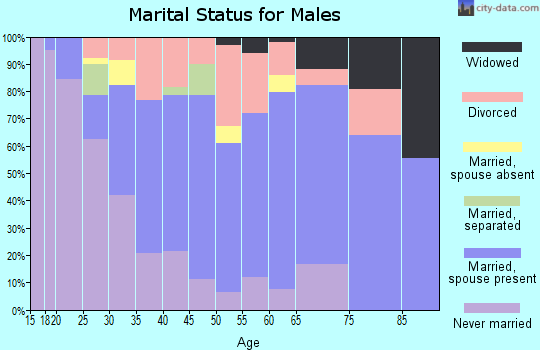
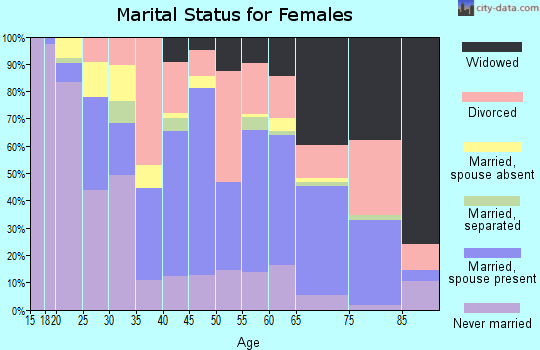
For population 15 years and over in 78225:
Never married: 36.5%Now married: 41.2%Separated: 3.7%Widowed: 5.3%Divorced: 13.3%
Zip code 78225 compared to state average:
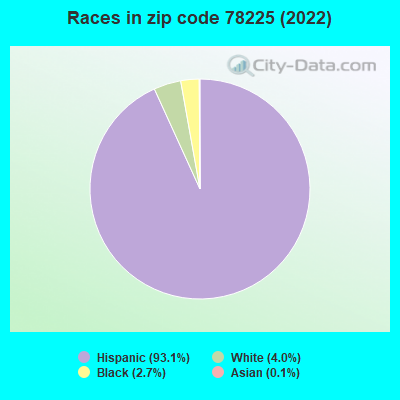
Median household income below state average. Median house value significantly below state average. Black race population percentage significantly below state average. Hispanic race population percentage above state average. Length of stay since moving in significantly above state average. House age significantly above state average. Percentage of population with a bachelor's degree or higher significantly below state average. 13,189 93.1% Hispanic or Latino 573 4.0% White 380 2.7% Black 20 0.1% Asian 7 0.05% Some other race 2 0.01% American Indian
Data:
Median household income ($)
Median household income (% change since 2000)
Household income diversity
Ratio of average income to average house value (%)
Ratio of average income to average rent
Median household income ($) - White
Median household income ($) - Black or African American
Median household income ($) - Asian
Median household income ($) - Hispanic or Latino
Median household income ($) - American Indian and Alaska Native
Median household income ($) - Multirace
Median household income ($) - Other Race
Median household income for houses/condos with a mortgage ($)
Median household income for apartments without a mortgage ($)
Races - White alone (%)
Races - White alone (% change since 2000)
Races - Black alone (%)
Races - Black alone (% change since 2000)
Races - American Indian alone (%)
Races - American Indian alone (% change since 2000)
Races - Asian alone (%)
Races - Asian alone (% change since 2000)
Races - Hispanic (%)
Races - Hispanic (% change since 2000)
Races - Native Hawaiian and Other Pacific Islander alone (%)
Races - Native Hawaiian and Other Pacific Islander alone (% change since 2000)
Races - Two or more races (%)
Races - Two or more races (% change since 2000)
Races - Other race alone (%)
Races - Other race alone (% change since 2000)
Racial diversity
Unemployment (%)
Unemployment (% change since 2000)
Unemployment (%) - White
Unemployment (%) - Black or African American
Unemployment (%) - Asian
Unemployment (%) - Hispanic or Latino
Unemployment (%) - American Indian and Alaska Native
Unemployment (%) - Multirace
Unemployment (%) - Other Race
Population density (people per square mile)
Population - Males (%)
Population - Females (%)
Population - Males (%) - White
Population - Males (%) - Black or African American
Population - Males (%) - Asian
Population - Males (%) - Hispanic or Latino
Population - Males (%) - American Indian and Alaska Native
Population - Males (%) - Multirace
Population - Males (%) - Other Race
Population - Females (%) - White
Population - Females (%) - Black or African American
Population - Females (%) - Asian
Population - Females (%) - Hispanic or Latino
Population - Females (%) - American Indian and Alaska Native
Population - Females (%) - Multirace
Population - Females (%) - Other Race
Coronavirus confirmed cases (Apr 27, 2024)
Deaths caused by coronavirus (Apr 27, 2024)
Coronavirus confirmed cases (per 100k population) (Apr 27, 2024)
Deaths caused by coronavirus (per 100k population) (Apr 27, 2024)
Daily increase in number of cases (Apr 27, 2024)
Weekly increase in number of cases (Apr 27, 2024)
Cases doubled (in days) (Apr 27, 2024)
Hospitalized patients (Apr 18, 2022)
Negative test results (Apr 18, 2022)
Total test results (Apr 18, 2022)
COVID Vaccine doses distributed (per 100k population) (Sep 19, 2023)
COVID Vaccine doses administered (per 100k population) (Sep 19, 2023)
COVID Vaccine doses distributed (Sep 19, 2023)
COVID Vaccine doses administered (Sep 19, 2023)
Likely homosexual households (%)
Likely homosexual households (% change since 2000)
Likely homosexual households - Lesbian couples (%)
Likely homosexual households - Lesbian couples (% change since 2000)
Likely homosexual households - Gay men (%)
Likely homosexual households - Gay men (% change since 2000)
Cost of living index
Median gross rent ($)
Median contract rent ($)
Median monthly housing costs ($)
Median house or condo value ($)
Median house or condo value ($ change since 2000)
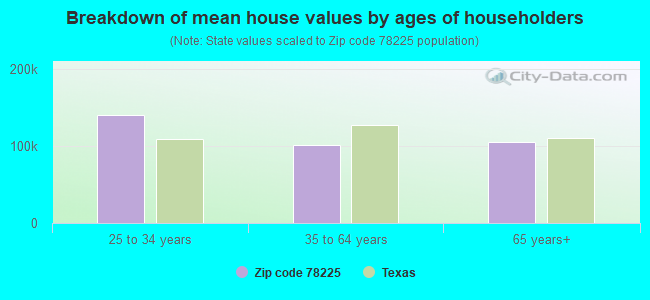
Mean house or condo value by units in structure - 1, detached ($)
Mean house or condo value by units in structure - 1, attached ($)
Mean house or condo value by units in structure - 2 ($)
Mean house or condo value by units in structure by units in structure - 3 or 4 ($)
Mean house or condo value by units in structure - 5 or more ($)
Mean house or condo value by units in structure - Boat, RV, van, etc. ($)
Mean house or condo value by units in structure - Mobile home ($)
Median house or condo value ($) - White
Median house or condo value ($) - Black or African American
Median house or condo value ($) - Asian
Median house or condo value ($) - Hispanic or Latino
Median house or condo value ($) - American Indian and Alaska Native
Median house or condo value ($) - Multirace
Median house or condo value ($) - Other Race
Median resident age
Resident age diversity
Median resident age - Males
Median resident age - Females
Median resident age - White
Median resident age - Black or African American
Median resident age - Asian
Median resident age - Hispanic or Latino
Median resident age - American Indian and Alaska Native
Median resident age - Multirace
Median resident age - Other Race
Median resident age - Males - White
Median resident age - Males - Black or African American
Median resident age - Males - Asian
Median resident age - Males - Hispanic or Latino
Median resident age - Males - American Indian and Alaska Native
Median resident age - Males - Multirace
Median resident age - Males - Other Race
Median resident age - Females - White
Median resident age - Females - Black or African American
Median resident age - Females - Asian
Median resident age - Females - Hispanic or Latino
Median resident age - Females - American Indian and Alaska Native
Median resident age - Females - Multirace
Median resident age - Females - Other Race
Commute - mean travel time to work (minutes)
Travel time to work - Less than 5 minutes (%)
Travel time to work - Less than 5 minutes (% change since 2000)
Travel time to work - 5 to 9 minutes (%)
Travel time to work - 5 to 9 minutes (% change since 2000)
Travel time to work - 10 to 19 minutes (%)
Travel time to work - 10 to 19 minutes (% change since 2000)
Travel time to work - 20 to 29 minutes (%)
Travel time to work - 20 to 29 minutes (% change since 2000)
Travel time to work - 30 to 39 minutes (%)
Travel time to work - 30 to 39 minutes (% change since 2000)
Travel time to work - 40 to 59 minutes (%)
Travel time to work - 40 to 59 minutes (% change since 2000)
Travel time to work - 60 to 89 minutes (%)
Travel time to work - 60 to 89 minutes (% change since 2000)
Travel time to work - 90 or more minutes (%)
Travel time to work - 90 or more minutes (% change since 2000)
Marital status - Never married (%)
Marital status - Now married (%)
Marital status - Separated (%)
Marital status - Widowed (%)
Marital status - Divorced (%)
Median family income ($)
Median family income (% change since 2000)
Median non-family income ($)
Median non-family income (% change since 2000)
Median per capita income ($)
Median per capita income (% change since 2000)
Median family income ($) - White
Median family income ($) - Black or African American
Median family income ($) - Asian
Median family income ($) - Hispanic or Latino
Median family income ($) - American Indian and Alaska Native
Median family income ($) - Multirace
Median family income ($) - Other Race
Median year house/condo built
Median year apartment built
Year house built - Built 2005 or later (%)
Year house built - Built 2000 to 2004 (%)
Year house built - Built 1990 to 1999 (%)
Year house built - Built 1980 to 1989 (%)
Year house built - Built 1970 to 1979 (%)
Year house built - Built 1960 to 1969 (%)
Year house built - Built 1950 to 1959 (%)
Year house built - Built 1940 to 1949 (%)
Year house built - Built 1939 or earlier (%)
Average household size
Household density (households per square mile)
Average household size - White
Average household size - Black or African American
Average household size - Asian
Average household size - Hispanic or Latino
Average household size - American Indian and Alaska Native
Average household size - Multirace
Average household size - Other Race
Occupied housing units (%)
Vacant housing units (%)
Owner occupied housing units (%)
Renter occupied housing units (%)
Vacancy status - For rent (%)
Vacancy status - For sale only (%)
Vacancy status - Rented or sold, not occupied (%)
Vacancy status - For seasonal, recreational, or occasional use (%)
Vacancy status - For migrant workers (%)
Vacancy status - Other vacant (%)
Residents with income below the poverty level (%)
Residents with income below 50% of the poverty level (%)
Children below poverty level (%)
Poor families by family type - Married-couple family (%)
Poor families by family type - Male, no wife present (%)
Poor families by family type - Female, no husband present (%)
Poverty status for native-born residents (%)
Poverty status for foreign-born residents (%)
Poverty among high school graduates not in families (%)
Poverty among people who did not graduate high school not in families (%)
Residents with income below the poverty level (%) - White
Residents with income below the poverty level (%) - Black or African American
Residents with income below the poverty level (%) - Asian
Residents with income below the poverty level (%) - Hispanic or Latino
Residents with income below the poverty level (%) - American Indian and Alaska Native
Residents with income below the poverty level (%) - Multirace
Residents with income below the poverty level (%) - Other Race
Air pollution - Air Quality Index (AQI)
Air pollution - CO
Air pollution - NO2
Air pollution - SO2
Air pollution - Ozone
Air pollution - PM10
Air pollution - PM25
Air pollution - Pb
Crime - Murders per 100,000 population
Crime - Rapes per 100,000 population
Crime - Robberies per 100,000 population
Crime - Assaults per 100,000 population
Crime - Burglaries per 100,000 population
Crime - Thefts per 100,000 population
Crime - Auto thefts per 100,000 population
Crime - Arson per 100,000 population
Crime - City-data.com crime index
Crime - Violent crime index
Crime - Property crime index
Crime - Murders per 100,000 population (5 year average)
Crime - Rapes per 100,000 population (5 year average)
Crime - Robberies per 100,000 population (5 year average)
Crime - Assaults per 100,000 population (5 year average)
Crime - Burglaries per 100,000 population (5 year average)
Crime - Thefts per 100,000 population (5 year average)
Crime - Auto thefts per 100,000 population (5 year average)
Crime - Arson per 100,000 population (5 year average)
Crime - City-data.com crime index (5 year average)
Crime - Violent crime index (5 year average)
Crime - Property crime index (5 year average)
1996 Presidential Elections Results (%) - Democratic Party (Clinton)
1996 Presidential Elections Results (%) - Republican Party (Dole)
1996 Presidential Elections Results (%) - Other
2000 Presidential Elections Results (%) - Democratic Party (Gore)
2000 Presidential Elections Results (%) - Republican Party (Bush)
2000 Presidential Elections Results (%) - Other
2004 Presidential Elections Results (%) - Democratic Party (Kerry)
2004 Presidential Elections Results (%) - Republican Party (Bush)
2004 Presidential Elections Results (%) - Other
2008 Presidential Elections Results (%) - Democratic Party (Obama)
2008 Presidential Elections Results (%) - Republican Party (McCain)
2008 Presidential Elections Results (%) - Other
2012 Presidential Elections Results (%) - Democratic Party (Obama)
2012 Presidential Elections Results (%) - Republican Party (Romney)
2012 Presidential Elections Results (%) - Other
2016 Presidential Elections Results (%) - Democratic Party (Clinton)
2016 Presidential Elections Results (%) - Republican Party (Trump)
2016 Presidential Elections Results (%) - Other
2020 Presidential Elections Results (%) - Democratic Party (Biden)
2020 Presidential Elections Results (%) - Republican Party (Trump)
2020 Presidential Elections Results (%) - Other
Ancestries Reported - Arab (%)
Ancestries Reported - Czech (%)
Ancestries Reported - Danish (%)
Ancestries Reported - Dutch (%)
Ancestries Reported - English (%)
Ancestries Reported - French (%)
Ancestries Reported - French Canadian (%)
Ancestries Reported - German (%)
Ancestries Reported - Greek (%)
Ancestries Reported - Hungarian (%)
Ancestries Reported - Irish (%)
Ancestries Reported - Italian (%)
Ancestries Reported - Lithuanian (%)
Ancestries Reported - Norwegian (%)
Ancestries Reported - Polish (%)
Ancestries Reported - Portuguese (%)
Ancestries Reported - Russian (%)
Ancestries Reported - Scotch-Irish (%)
Ancestries Reported - Scottish (%)
Ancestries Reported - Slovak (%)
Ancestries Reported - Subsaharan African (%)
Ancestries Reported - Swedish (%)
Ancestries Reported - Swiss (%)
Ancestries Reported - Ukrainian (%)
Ancestries Reported - United States (%)
Ancestries Reported - Welsh (%)
Ancestries Reported - West Indian (%)
Ancestries Reported - Other (%)
Educational Attainment - No schooling completed (%)
Educational Attainment - Less than high school (%)
Educational Attainment - High school or equivalent (%)
Educational Attainment - Less than 1 year of college (%)
Educational Attainment - 1 or more years of college (%)
Educational Attainment - Associate degree (%)
Educational Attainment - Bachelor's degree (%)
Educational Attainment - Master's degree (%)
Educational Attainment - Professional school degree (%)
Educational Attainment - Doctorate degree (%)
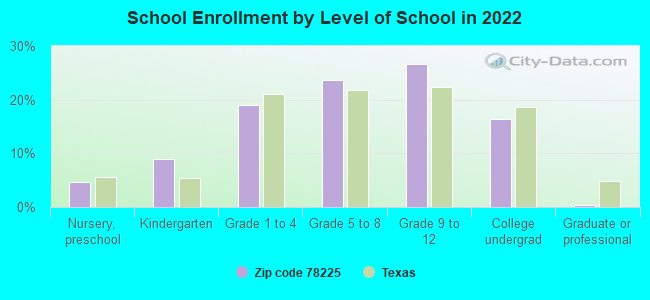
School Enrollment - Nursery, preschool (%)
School Enrollment - Kindergarten (%)
School Enrollment - Grade 1 to 4 (%)
School Enrollment - Grade 5 to 8 (%)
School Enrollment - Grade 9 to 12 (%)
School Enrollment - College undergrad (%)
School Enrollment - Graduate or professional (%)
School Enrollment - Not enrolled in school (%)
School enrollment - Public schools (%)
School enrollment - Private schools (%)
School enrollment - Not enrolled (%)
Median number of rooms in houses and condos
Median number of rooms in apartments
Housing units lacking complete plumbing facilities (%)
Housing units lacking complete kitchen facilities (%)
Density of houses
Urban houses (%)
Rural houses (%)
Households with people 60 years and over (%)
Households with people 65 years and over (%)
Households with people 75 years and over (%)
Households with one or more nonrelatives (%)
Households with no nonrelatives (%)
Population in households (%)
Family households (%)
Nonfamily households (%)
Population in families (%)
Family households with own children (%)
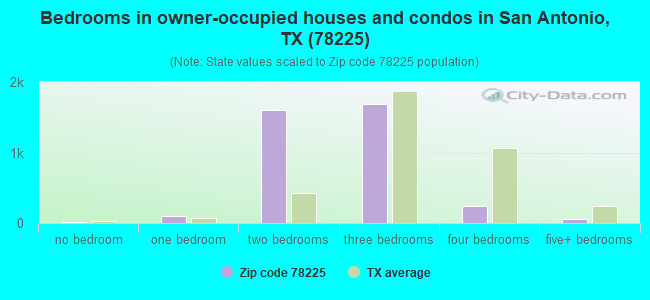
Median number of bedrooms in owner occupied houses
Mean number of bedrooms in owner occupied houses
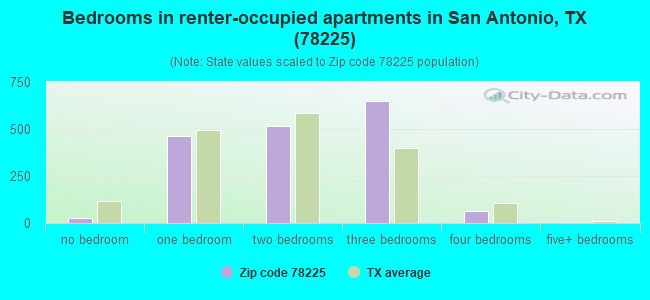
Median number of bedrooms in renter occupied houses
Mean number of bedrooms in renter occupied houses
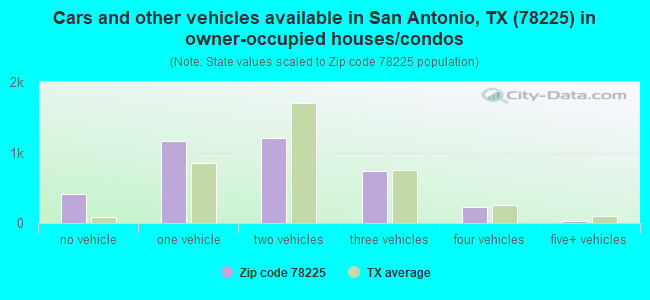
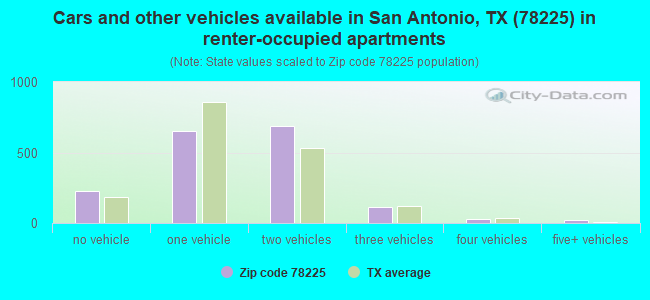
Median number of vehichles in owner occupied houses
Mean number of vehichles in owner occupied houses
Median number of vehichles in renter occupied houses
Mean number of vehichles in renter occupied houses
Mortgage status - with mortgage (%)
Mortgage status - with second mortgage (%)
Mortgage status - with home equity loan (%)
Mortgage status - with both second mortgage and home equity loan (%)
Mortgage status - without a mortgage (%)
Average family size
Average family size - White
Average family size - Black or African American
Average family size - Asian
Average family size - Hispanic or Latino
Average family size - American Indian and Alaska Native
Average family size - Multirace
Average family size - Other Race
Geographical mobility - Same house 1 year ago (%)
Geographical mobility - Moved within same county (%)
Geographical mobility - Moved from different county within same state (%)
Geographical mobility - Moved from different state (%)
Geographical mobility - Moved from abroad (%)
Place of birth - Born in state of residence (%)
Place of birth - Born in other state (%)
Place of birth - Native, outside of US (%)
Place of birth - Foreign born (%)
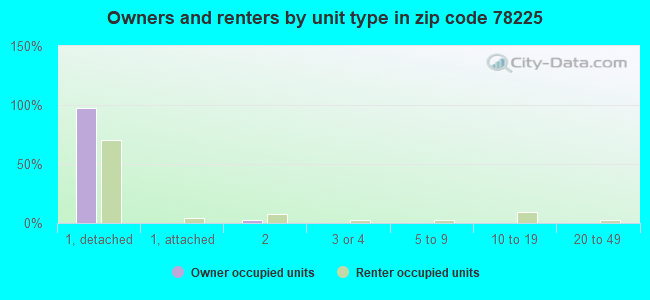
Housing units in structures - 1, detached (%)
Housing units in structures - 1, attached (%)
Housing units in structures - 2 (%)
Housing units in structures - 3 or 4 (%)
Housing units in structures - 5 to 9 (%)
Housing units in structures - 10 to 19 (%)
Housing units in structures - 20 to 49 (%)
Housing units in structures - 50 or more (%)
Housing units in structures - Mobile home (%)
Housing units in structures - Boat, RV, van, etc. (%)
House/condo owner moved in on average (years ago)
Renter moved in on average (years ago)
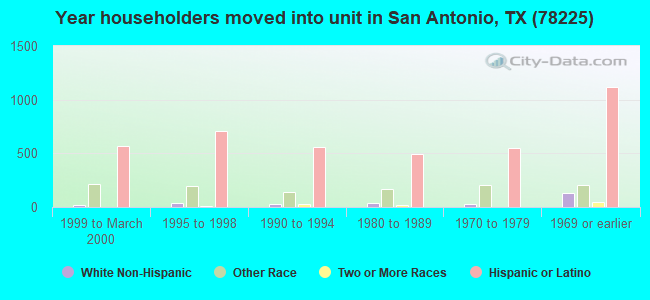
Year householder moved into unit - Moved in 1999 to March 2000 (%)
Year householder moved into unit - Moved in 1995 to 1998 (%)
Year householder moved into unit - Moved in 1990 to 1994 (%)
Year householder moved into unit - Moved in 1980 to 1989 (%)
Year householder moved into unit - Moved in 1970 to 1979 (%)
Year householder moved into unit - Moved in 1969 or earlier (%)
Means of transportation to work - Drove car alone (%)
Means of transportation to work - Carpooled (%)
Means of transportation to work - Public transportation (%)
Means of transportation to work - Bus or trolley bus (%)
Means of transportation to work - Streetcar or trolley car (%)
Means of transportation to work - Subway or elevated (%)
Means of transportation to work - Railroad (%)
Means of transportation to work - Ferryboat (%)
Means of transportation to work - Taxicab (%)
Means of transportation to work - Motorcycle (%)
Means of transportation to work - Bicycle (%)
Means of transportation to work - Walked (%)
Means of transportation to work - Other means (%)
Working at home (%)
Industry diversity
Most Common Industries - Agriculture, forestry, fishing and hunting, and mining (%)
Most Common Industries - Agriculture, forestry, fishing and hunting (%)
Most Common Industries - Mining, quarrying, and oil and gas extraction (%)
Most Common Industries - Construction (%)
Most Common Industries - Manufacturing (%)
Most Common Industries - Wholesale trade (%)
Most Common Industries - Retail trade (%)
Most Common Industries - Transportation and warehousing, and utilities (%)
Most Common Industries - Transportation and warehousing (%)
Most Common Industries - Utilities (%)
Most Common Industries - Information (%)
Most Common Industries - Finance and insurance, and real estate and rental and leasing (%)
Most Common Industries - Finance and insurance (%)
Most Common Industries - Real estate and rental and leasing (%)
Most Common Industries - Professional, scientific, and management, and administrative and waste management services (%)
Most Common Industries - Professional, scientific, and technical services (%)
Most Common Industries - Management of companies and enterprises (%)
Most Common Industries - Administrative and support and waste management services (%)
Most Common Industries - Educational services, and health care and social assistance (%)
Most Common Industries - Educational services (%)
Most Common Industries - Health care and social assistance (%)
Most Common Industries - Arts, entertainment, and recreation, and accommodation and food services (%)
Most Common Industries - Arts, entertainment, and recreation (%)
Most Common Industries - Accommodation and food services (%)
Most Common Industries - Other services, except public administration (%)
Most Common Industries - Public administration (%)
Occupation diversity
Most Common Occupations - Management, business, science, and arts occupations (%)
Most Common Occupations - Management, business, and financial occupations (%)
Most Common Occupations - Management occupations (%)
Most Common Occupations - Business and financial operations occupations (%)
Most Common Occupations - Computer, engineering, and science occupations (%)
Most Common Occupations - Computer and mathematical occupations (%)
Most Common Occupations - Architecture and engineering occupations (%)
Most Common Occupations - Life, physical, and social science occupations (%)
Most Common Occupations - Education, legal, community service, arts, and media occupations (%)
Most Common Occupations - Community and social service occupations (%)
Most Common Occupations - Legal occupations (%)
Most Common Occupations - Education, training, and library occupations (%)
Most Common Occupations - Arts, design, entertainment, sports, and media occupations (%)
Most Common Occupations - Healthcare practitioners and technical occupations (%)
Most Common Occupations - Health diagnosing and treating practitioners and other technical occupations (%)
Most Common Occupations - Health technologists and technicians (%)
Most Common Occupations - Service occupations (%)
Most Common Occupations - Healthcare support occupations (%)
Most Common Occupations - Protective service occupations (%)
Most Common Occupations - Fire fighting and prevention, and other protective service workers including supervisors (%)
Most Common Occupations - Law enforcement workers including supervisors (%)
Most Common Occupations - Food preparation and serving related occupations (%)
Most Common Occupations - Building and grounds cleaning and maintenance occupations (%)
Most Common Occupations - Personal care and service occupations (%)
Most Common Occupations - Sales and office occupations (%)
Most Common Occupations - Sales and related occupations (%)
Most Common Occupations - Office and administrative support occupations (%)
Most Common Occupations - Natural resources, construction, and maintenance occupations (%)
Most Common Occupations - Farming, fishing, and forestry occupations (%)
Most Common Occupations - Construction and extraction occupations (%)
Most Common Occupations - Installation, maintenance, and repair occupations (%)
Most Common Occupations - Production, transportation, and material moving occupations (%)
Most Common Occupations - Production occupations (%)
Most Common Occupations - Transportation occupations (%)
Most Common Occupations - Material moving occupations (%)
People in Group quarters - Institutionalized population (%)
People in Group quarters - Correctional institutions (%)
People in Group quarters - Federal prisons and detention centers (%)
People in Group quarters - Halfway houses (%)
People in Group quarters - Local jails and other confinement facilities (including police lockups) (%)
People in Group quarters - Military disciplinary barracks (%)
People in Group quarters - State prisons (%)
People in Group quarters - Other types of correctional institutions (%)
People in Group quarters - Nursing homes (%)
People in Group quarters - Hospitals/wards, hospices, and schools for the handicapped (%)
People in Group quarters - Hospitals/wards and hospices for chronically ill (%)
People in Group quarters - Hospices or homes for chronically ill (%)
People in Group quarters - Military hospitals or wards for chronically ill (%)
People in Group quarters - Other hospitals or wards for chronically ill (%)
People in Group quarters - Hospitals or wards for drug/alcohol abuse (%)
People in Group quarters - Mental (Psychiatric) hospitals or wards (%)
People in Group quarters - Schools, hospitals, or wards for the mentally retarded (%)
People in Group quarters - Schools, hospitals, or wards for the physically handicapped (%)
People in Group quarters - Institutions for the deaf (%)
People in Group quarters - Institutions for the blind (%)
People in Group quarters - Orthopedic wards and institutions for the physically handicapped (%)
People in Group quarters - Wards in general hospitals for patients who have no usual home elsewhere (%)
People in Group quarters - Wards in military hospitals for patients who have no usual home elsewhere (%)
People in Group quarters - Juvenile institutions (%)
People in Group quarters - Long-term care (%)
People in Group quarters - Homes for abused, dependent, and neglected children (%)
People in Group quarters - Residential treatment centers for emotionally disturbed children (%)
People in Group quarters - Training schools for juvenile delinquents (%)
People in Group quarters - Short-term care, detention or diagnostic centers for delinquent children (%)
People in Group quarters - Type of juvenile institution unknown (%)
People in Group quarters - Noninstitutionalized population (%)
People in Group quarters - College dormitories (includes college quarters off campus) (%)
People in Group quarters - Military quarters (%)
People in Group quarters - On base (%)
People in Group quarters - Barracks, unaccompanied personnel housing (UPH), (Enlisted/Officer), ;and similar group living quarters for military personnel (%)
People in Group quarters - Transient quarters for temporary residents (%)
People in Group quarters - Military ships (%)
People in Group quarters - Group homes (%)
People in Group quarters - Homes or halfway houses for drug/alcohol abuse (%)
People in Group quarters - Homes for the mentally ill (%)
People in Group quarters - Homes for the mentally retarded (%)
People in Group quarters - Homes for the physically handicapped (%)
People in Group quarters - Other group homes (%)
People in Group quarters - Religious group quarters (%)
People in Group quarters - Dormitories (%)
People in Group quarters - Agriculture workers' dormitories on farms (%)
People in Group quarters - Job Corps and vocational training facilities (%)
People in Group quarters - Other workers' dormitories (%)
People in Group quarters - Crews of maritime vessels (%)
People in Group quarters - Other nonhousehold living situations (%)
People in Group quarters - Other noninstitutional group quarters (%)
Residents speaking English at home (%)
Residents speaking English at home - Born in the United States (%)
Residents speaking English at home - Native, born elsewhere (%)
Residents speaking English at home - Foreign born (%)
Residents speaking Spanish at home (%)
Residents speaking Spanish at home - Born in the United States (%)
Residents speaking Spanish at home - Native, born elsewhere (%)
Residents speaking Spanish at home - Foreign born (%)
Residents speaking other language at home (%)
Residents speaking other language at home - Born in the United States (%)
Residents speaking other language at home - Native, born elsewhere (%)
Residents speaking other language at home - Foreign born (%)
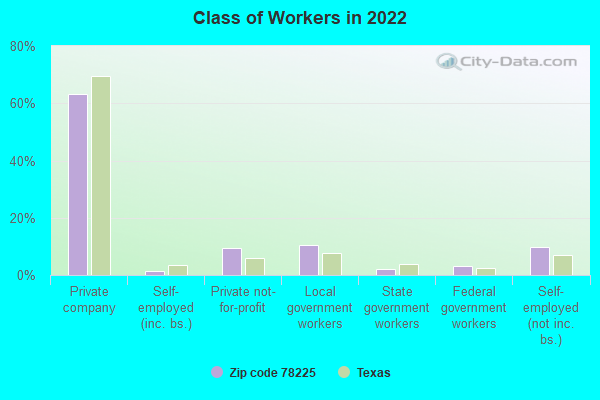
Class of Workers - Employee of private company (%)
Class of Workers - Self-employed in own incorporated business (%)
Class of Workers - Private not-for-profit wage and salary workers (%)
Class of Workers - Local government workers (%)
Class of Workers - State government workers (%)
Class of Workers - Federal government workers (%)
Class of Workers - Self-employed workers in own not incorporated business and Unpaid family workers (%)
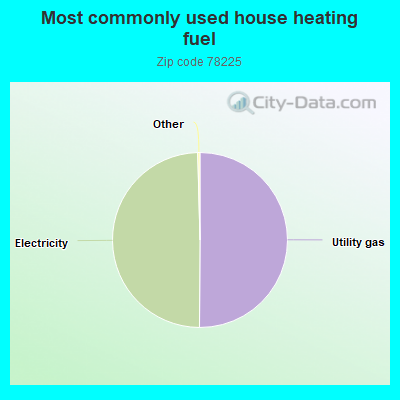
House heating fuel used in houses and condos - Utility gas (%)
House heating fuel used in houses and condos - Bottled, tank, or LP gas (%)
House heating fuel used in houses and condos - Electricity (%)
House heating fuel used in houses and condos - Fuel oil, kerosene, etc. (%)
House heating fuel used in houses and condos - Coal or coke (%)
House heating fuel used in houses and condos - Wood (%)
House heating fuel used in houses and condos - Solar energy (%)
House heating fuel used in houses and condos - Other fuel (%)
House heating fuel used in houses and condos - No fuel used (%)
House heating fuel used in apartments - Utility gas (%)
House heating fuel used in apartments - Bottled, tank, or LP gas (%)
House heating fuel used in apartments - Electricity (%)
House heating fuel used in apartments - Fuel oil, kerosene, etc. (%)
House heating fuel used in apartments - Coal or coke (%)
House heating fuel used in apartments - Wood (%)
House heating fuel used in apartments - Solar energy (%)
House heating fuel used in apartments - Other fuel (%)
House heating fuel used in apartments - No fuel used (%)
Armed forces status - In Armed Forces (%)
Armed forces status - Civilian (%)
Armed forces status - Civilian - Veteran (%)
Armed forces status - Civilian - Nonveteran (%)
Fatal accidents locations in years 2005-2021
Fatal accidents locations in 2005
Fatal accidents locations in 2006
Fatal accidents locations in 2007
Fatal accidents locations in 2008
Fatal accidents locations in 2009
Fatal accidents locations in 2010
Fatal accidents locations in 2011
Fatal accidents locations in 2012
Fatal accidents locations in 2013
Fatal accidents locations in 2014
Fatal accidents locations in 2015
Fatal accidents locations in 2016
Fatal accidents locations in 2017
Fatal accidents locations in 2018
Fatal accidents locations in 2019
Fatal accidents locations in 2020
Fatal accidents locations in 2021
Alcohol use - People drinking some alcohol every month (%)
Alcohol use - People not drinking at all (%)
Alcohol use - Average days/month drinking alcohol
Alcohol use - Average drinks/week
Alcohol use - Average days/year people drink much
Audiometry - Average condition of hearing (%)
Audiometry - People that can hear a whisper from across a quiet room (%)
Audiometry - People that can hear normal voice from across a quiet room (%)
Audiometry - Ears ringing, roaring, buzzing (%)
Audiometry - Had a job exposure to loud noise (%)
Audiometry - Had off-work exposure to loud noise (%)
Blood Pressure & Cholesterol - Has high blood pressure (%)
Blood Pressure & Cholesterol - Checking blood pressure at home (%)
Blood Pressure & Cholesterol - Frequently checking blood cholesterol (%)
Blood Pressure & Cholesterol - Has high cholesterol level (%)
Consumer Behavior - Money monthly spent on food at supermarket/grocery store
Consumer Behavior - Money monthly spent on food at other stores
Consumer Behavior - Money monthly spent on eating out
Consumer Behavior - Money monthly spent on carryout/delivered foods
Consumer Behavior - Income spent on food at supermarket/grocery store (%)
Consumer Behavior - Income spent on food at other stores (%)
Consumer Behavior - Income spent on eating out (%)
Consumer Behavior - Income spent on carryout/delivered foods (%)
Current Health Status - General health condition (%)
Current Health Status - Blood donors (%)
Current Health Status - Has blood ever tested for HIV virus (%)
Current Health Status - Left-handed people (%)
Dermatology - People using sunscreen (%)
Diabetes - Diabetics (%)
Diabetes - Had a blood test for high blood sugar (%)
Diabetes - People taking insulin (%)
Diet Behavior & Nutrition - Diet health (%)
Diet Behavior & Nutrition - Milk product consumption (# of products/month)
Diet Behavior & Nutrition - Meals not home prepared (#/week)
Diet Behavior & Nutrition - Meals from fast food or pizza place (#/week)
Diet Behavior & Nutrition - Ready-to-eat foods (#/month)
Diet Behavior & Nutrition - Frozen meals/pizza (#/month)
Drug Use - People that ever used marijuana or hashish (%)
Drug Use - Ever used hard drugs (%)
Drug Use - Ever used any form of cocaine (%)
Drug Use - Ever used heroin (%)
Drug Use - Ever used methamphetamine (%)
Health Insurance - People covered by health insurance (%)
Kidney Conditions-Urology - Avg. # of times urinating at night
Medical Conditions - People with asthma (%)
Medical Conditions - People with anemia (%)
Medical Conditions - People with psoriasis (%)
Medical Conditions - People with overweight (%)
Medical Conditions - Elderly people having difficulties in thinking or remembering (%)
Medical Conditions - People who ever received blood transfusion (%)
Medical Conditions - People having trouble seeing even with glass/contacts (%)
Medical Conditions - People with arthritis (%)
Medical Conditions - People with gout (%)
Medical Conditions - People with congestive heart failure (%)
Medical Conditions - People with coronary heart disease (%)
Medical Conditions - People with angina pectoris (%)
Medical Conditions - People who ever had heart attack (%)
Medical Conditions - People who ever had stroke (%)
Medical Conditions - People with emphysema (%)
Medical Conditions - People with thyroid problem (%)
Medical Conditions - People with chronic bronchitis (%)
Medical Conditions - People with any liver condition (%)
Medical Conditions - People who ever had cancer or malignancy (%)
Mental Health - People who have little interest in doing things (%)
Mental Health - People feeling down, depressed, or hopeless (%)
Mental Health - People who have trouble sleeping or sleeping too much (%)
Mental Health - People feeling tired or having little energy (%)
Mental Health - People with poor appetite or overeating (%)
Mental Health - People feeling bad about themself (%)
Mental Health - People who have trouble concentrating on things (%)
Mental Health - People moving or speaking slowly or too fast (%)
Mental Health - People having thoughts they would be better off dead (%)
Oral Health - Average years since last visit a dentist
Oral Health - People embarrassed because of mouth (%)
Oral Health - People with gum disease (%)
Oral Health - General health of teeth and gums (%)
Oral Health - Average days a week using dental floss/device
Oral Health - Average days a week using mouthwash for dental problem
Oral Health - Average number of teeth
Pesticide Use - Households using pesticides to control insects (%)
Pesticide Use - Households using pesticides to kill weeds (%)
Physical Activity - People doing vigorous-intensity work activities (%)
Physical Activity - People doing moderate-intensity work activities (%)
Physical Activity - People walking or bicycling (%)
Physical Activity - People doing vigorous-intensity recreational activities (%)
Physical Activity - People doing moderate-intensity recreational activities (%)
Physical Activity - Average hours a day doing sedentary activities
Physical Activity - Average hours a day watching TV or videos
Physical Activity - Average hours a day using computer
Physical Functioning - People having limitations keeping them from working (%)
Physical Functioning - People limited in amount of work they can do (%)
Physical Functioning - People that need special equipment to walk (%)
Physical Functioning - People experiencing confusion/memory problems (%)
Physical Functioning - People requiring special healthcare equipment (%)
Prescription Medications - Average number of prescription medicines taking
Preventive Aspirin Use - Adults 40+ taking low-dose aspirin (%)
Reproductive Health - Vaginal deliveries (%)
Reproductive Health - Cesarean deliveries (%)
Reproductive Health - Deliveries resulted in a live birth (%)
Reproductive Health - Pregnancies resulted in a delivery (%)
Reproductive Health - Women breastfeeding newborns (%)
Reproductive Health - Women that had a hysterectomy (%)
Reproductive Health - Women that had both ovaries removed (%)
Reproductive Health - Women that have ever taken birth control pills (%)
Reproductive Health - Women taking birth control pills (%)
Reproductive Health - Women that have ever used Depo-Provera or injectables (%)
Reproductive Health - Women that have ever used female hormones (%)
Sexual Behavior - People 18+ that ever had sex (vaginal, anal, or oral) (%)
Sexual Behavior - Males 18+ that ever had vaginal sex with a woman (%)
Sexual Behavior - Males 18+ that ever performed oral sex on a woman (%)
Sexual Behavior - Males 18+ that ever had anal sex with a woman (%)
Sexual Behavior - Males 18+ that ever had any sex with a man (%)
Sexual Behavior - Females 18+ that ever had vaginal sex with a man (%)
Sexual Behavior - Females 18+ that ever performed oral sex on a man (%)
Sexual Behavior - Females 18+ that ever had anal sex with a man (%)
Sexual Behavior - Females 18+ that ever had any kind of sex with a woman (%)
Sexual Behavior - Average age people first had sex
Sexual Behavior - Average number of female sex partners in lifetime (males 18+)
Sexual Behavior - Average number of female vaginal sex partners in lifetime (males 18+)
Sexual Behavior - Average age people first performed oral sex on a woman (18+)
Sexual Behavior - Average number of woman performed oral sex on in lifetime (18+)
Sexual Behavior - Average number of male sex partners in lifetime (males 18+)
Sexual Behavior - Average number of male anal sex partners in lifetime (males 18+)
Sexual Behavior - Average age people first performed oral sex on a man (18+)
Sexual Behavior - Average number of male oral sex partners in lifetime (18+)
Sexual Behavior - People using protection when performing oral sex (%)
Sexual Behavior - Average number of times people have vaginal or anal sex a year
Sexual Behavior - People having sex without condom (%)
Sexual Behavior - Average number of male sex partners in lifetime (females 18+)
Sexual Behavior - Average number of male vaginal sex partners in lifetime (females 18+)
Sexual Behavior - Average number of female sex partners in lifetime (females 18+)
Sexual Behavior - Circumcised males 18+ (%)
Sleep Disorders - Average hours sleeping at night
Sleep Disorders - People that has trouble sleeping (%)
Smoking-Cigarette Use - People smoking cigarettes (%)
Taste & Smell - People 40+ having problems with smell (%)
Taste & Smell - People 40+ having problems with taste (%)
Taste & Smell - People 40+ that ever had wisdom teeth removed (%)
Taste & Smell - People 40+ that ever had tonsils teeth removed (%)
Taste & Smell - People 40+ that ever had a loss of consciousness because of a head injury (%)
Taste & Smell - People 40+ that ever had a broken nose or other serious injury to face or skull (%)
Taste & Smell - People 40+ that ever had two or more sinus infections (%)
Weight - Average height (inches)
Weight - Average weight (pounds)
Weight - Average BMI
Weight - People that are obese (%)
Weight - People that ever were obese (%)
Weight - People trying to lose weight (%)
100%
urban population.
Estimated median house/condo value in 2022: $112,821
78225:
$112,821Texas:
$275,400
Median resident age: This zip code:
38.1 yearsTexas median age:
35.6 years
Average household size: This zip code:
2.6 peopleTexas:
2.6 people
Averages for the 2020 tax year for zip code 78225, filed in 2021:
Average Adjusted Gross Income (AGI) in 2020: $32,337 (Individual Income Tax Returns) Here:
$32,337State:
$77,054
Salary/wage: $31,147 (reported on 82.2% of returns )Here:
$31,147State:
$62,766
(% of AGI for various income ranges: 1145.6% for AGIs below $25k , 3446.3% for AGIs $25k-50k , 6466.6% for AGIs $50k-75k , 8425.6% for AGIs $75k-100k , 13157.3% for AGIs $100k-200k ) Taxable interest for individuals: $640 (reported on 9.7% of returns )This zip code:
$640Texas:
$2,665
(% of AGI for various income ranges: 3.4% for AGIs below $25k , 8.7% for AGIs $25k-50k , 6.8% for AGIs $50k-75k , 30.0% for AGIs $75k-100k , 43.6% for AGIs $100k-200k ) Ordinary dividends: $638 (reported on 2.3% of returns )(% of AGI for various income ranges: 1.1% for AGIs below $25k , 1.0% for AGIs $25k-50k , 2.3% for AGIs $50k-75k , 6.7% for AGIs $75k-100k , 19.1% for AGIs $100k-200k ) Net capital gain/loss in AGI: +$3,900 (reported on 2.1% of returns )Here:
+$3,900State:
+$39,590
(% of AGI for various income ranges: 7.6% for AGIs $25k-50k , 2.8% for AGIs $50k-75k , 183.9% for AGIs $75k-100k ) Profit/loss from business: +$7,697 (reported on 17.5% of returns )Here:
+$7,697State:
+$10,888
(% of AGI for various income ranges: 242.3% for AGIs below $25k , 92.4% for AGIs $25k-50k , 114.0% for AGIs $50k-75k , 295.0% for AGIs $75k-100k ) Taxable individual retirement arrangement distribution: $11,253 (reported on 2.7% of returns )78225:
$11,253Texas:
$24,740
(% of AGI for various income ranges: 12.7% for AGIs below $25k , 19.1% for AGIs $25k-50k , 92.6% for AGIs $50k-75k , 343.3% for AGIs $75k-100k ) Total itemized deductions: $24,775 (reported on 1.4% of returns )Here:
$24,775State:
$40,428
(% of AGI for various income ranges: 70.1% for AGIs $25k-50k , 450.6% for AGIs $75k-100k ) Charity contributions: $6,717 (reported on 1.1% of returns )(% of AGI for various income ranges: 8.0% for AGIs below $25k , 45.3% for AGIs $50k-75k ) Taxes paid: $4,800 (reported on 1.4% of returns )(% of AGI for various income ranges: 14.8% for AGIs $25k-50k , 76.1% for AGIs $75k-100k ) Earned income credit: $2,648 (reported on 33.4% of returns )(% of AGI for various income ranges: 161.2% for AGIs below $25k , 102.7% for AGIs $25k-50k ) Percentage of individuals using paid preparers for their 2020 taxes: 90.5%(% for various income ranges: 89.1% for AGIs below $25k , 92.8% for AGIs $25k-50k , 89.7% for AGIs $50k-75k , 91.3% for AGIs $75k-100k , 86.7% for AGIs $100k-200k )
Averages for the 2012 tax year for zip code 78225, filed in 2013:
Average Adjusted Gross Income (AGI) in 2012: $27,114 (Individual Income Tax Returns) Here:
$27,114State:
$65,384
Salary/wage: $26,256 (reported on 84.9% of returns )Here:
$26,256State:
$52,524
(% of AGI for various income ranges: 77.8% for AGIs below $25k , 86.5% for AGIs $25k-50k , 83.5% for AGIs $50k-75k , 80.7% for AGIs $75k-100k , 71.5% for AGIs $100k-200k ) Taxable interest for individuals: $675 (reported on 10.8% of returns )This zip code:
$675Texas:
$2,372
(% of AGI for various income ranges: 0.2% for AGIs below $25k , 0.3% for AGIs $25k-50k , 0.4% for AGIs $50k-75k , 0.2% for AGIs $75k-100k ) Ordinary dividends: $1,336 (reported on 2.4% of returns )(% of AGI for various income ranges: 0.3% for AGIs below $25k , 0.1% for AGIs $75k-100k ) Net capital gain/loss in AGI: +$1,550 (reported on 1.4% of returns )Here:
+$1,550State:
+$35,319
Profit/loss from business: +$7,753 (reported on 14.3% of returns )Here:
+$7,753State:
+$13,732
(% of AGI for various income ranges: 10.8% for AGIs below $25k , 1.9% for AGIs $25k-50k , 1.3% for AGIs $50k-75k , 0.3% for AGIs $75k-100k ) Taxable individual retirement arrangement distribution: $7,233 (reported on 3.1% of returns )78225:
$7,233Texas:
$19,511
(% of AGI for various income ranges: 0.7% for AGIs below $25k , 0.6% for AGIs $25k-50k , 1.5% for AGIs $50k-75k , 1.7% for AGIs $75k-100k ) Total itemized deductions: $15,606 (31% of AGI, reported on 5.3% of returns )Here:
$15,606State:
$24,724
Here:
31.2% of AGIState:
15.9% of AGI
(% of AGI for various income ranges: 1.3% for AGIs below $25k , 3.3% for AGIs $25k-50k , 4.3% for AGIs $50k-75k , 7.8% for AGIs $75k-100k ) Charity contributions: $2,627 (reported on 3.8% of returns )(% of AGI for various income ranges: 0.4% for AGIs $25k-50k , 0.5% for AGIs $50k-75k , 1.5% for AGIs $75k-100k ) Taxes paid: $3,410 (reported on 5.0% of returns )(% of AGI for various income ranges: 0.2% for AGIs below $25k , 0.7% for AGIs $25k-50k , 0.9% for AGIs $50k-75k , 1.9% for AGIs $75k-100k ) Earned income credit: $2,732 (reported on 38.2% of returns )(% of AGI for various income ranges: 10.8% for AGIs below $25k , 2.0% for AGIs $25k-50k ) Percentage of individuals using paid preparers for their 2012 taxes: 47.7%(% for various income ranges: 48.0% for AGIs below $25k , 45.6% for AGIs $25k-50k , 49.0% for AGIs $50k-75k , 57.1% for AGIs $75k-100k , 57.1% for AGIs $100k-200k )
Averages for the 2004 tax year for zip code 78225, filed in 2005:
Average Adjusted Gross Income (AGI) in 2004: $22,738 (Individual Income Tax Returns) Here:
$22,738State:
$47,881
Salary/wage: $21,666 (reported on 85.9% of returns )Here:
$21,666State:
$41,947
(% of AGI for various income ranges: 80.0% for AGIs below $10k , 80.4% for AGIs $10k-25k , 85.5% for AGIs $25k-50k , 79.4% for AGIs $50k-75k , 80.4% for AGIs $75k-100k , 70.4% for AGIs over 100k ) Taxable interest for individuals: $937 (reported on 16.0% of returns )This zip code:
$937Texas:
$2,255
(% of AGI for various income ranges: 0.6% for AGIs below $10k , 0.6% for AGIs $10k-25k , 0.4% for AGIs $25k-50k , 1.7% for AGIs $50k-75k , 0.5% for AGIs $75k-100k , 0.3% for AGIs over 100k ) Taxable dividends: $328 (reported on 3.6% of returns )(% of AGI for various income ranges: 0.1% for AGIs below $10k , 0.0% for AGIs $10k-25k , 0.1% for AGIs $25k-50k , 0.1% for AGIs $50k-75k , 0.0% for AGIs $75k-100k , 0.1% for AGIs over 100k ) Net capital gain/loss: +$2,773 (reported on 2.3% of returns )Here:
+$2,773State:
+$16,110
(% of AGI for various income ranges: -0.0% for AGIs $10k-25k , 0.3% for AGIs $25k-50k , 1.1% for AGIs $50k-75k , 0.0% for AGIs $75k-100k ) Profit/loss from business: +$6,978 (reported on 11.0% of returns )Here:
+$6,978State:
+$11,013
(% of AGI for various income ranges: 13.7% for AGIs below $10k , 5.5% for AGIs $10k-25k , 1.8% for AGIs $25k-50k , 1.3% for AGIs $50k-75k , -0.8% for AGIs $75k-100k ) IRA payment deduction: $1,524 (reported on 0.4% of returns )Total itemized deductions: $13,015 (26% of AGI, reported on 3.5% of returns )Here:
$13,015State:
$19,631
Here:
25.7% of AGIState:
18.9% of AGI
(% of AGI for various income ranges: 1.1% for AGIs $10k-25k , 1.8% for AGIs $25k-50k , 3.0% for AGIs $50k-75k , 4.7% for AGIs $75k-100k , 7.3% for AGIs over 100k ) Charity contributions deductions: $2,680 (5% of AGI, reported on 2.7% of returns )Here:
5.3% of AGIState:
4.2% of AGI
(% of AGI for various income ranges: 0.1% for AGIs $10k-25k , 0.3% for AGIs $25k-50k , 0.7% for AGIs $50k-75k , 0.9% for AGIs $75k-100k , 1.0% for AGIs over 100k ) Total tax: $2,294 (reported on 58.7% of returns )(% of AGI for various income ranges: 2.6% for AGIs below $10k , 3.1% for AGIs $10k-25k , 5.7% for AGIs $25k-50k , 8.9% for AGIs $50k-75k , 12.0% for AGIs $75k-100k , 18.3% for AGIs over 100k ) Earned income credit: $2,062 (reported on 39.1% of returns )Percentage of individuals using paid preparers for their 2004 taxes: 62.0%(% for various income ranges: 59.5% for AGIs below $10k , 65.2% for AGIs $10k-25k , 61.0% for AGIs $25k-50k , 55.6% for AGIs $50k-75k , 54.2% for AGIs $75k-100k , 48.6% for AGIs over 100k )
Estimated median household income in 2022: This zip code:
$43,432Texas:
$72,284
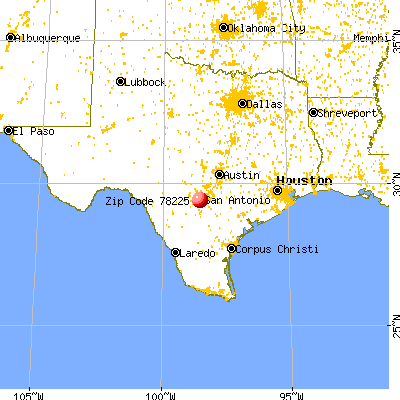
Nearest zip codes: 78204 ,
78207 ,
78226 ,
78205 ,
78237 ,
78210 .
San Antonio Zip Code Map
Percentage of family households: This zip code:
38.5%Texas:
50.5%
Percentage of households with unmarried partners: This zip code:
4.6%Texas:
48.7%
Likely homosexual households (counted as self-reported same-sex unmarried-partner households)
Lesbian couples: 0.0% of all households Gay men: 0.2% of all households
Household received Food Stamps/SNAP in the past 12 months: 1,451Household did not receive Food Stamps/SNAP in the past 12 months: 4,066
Women who had a birth in the past 12 months: 263 (133 now married , 127 unmarried) Women who did not have a birth in the past 12 months: 3,197 (1,043 now married , 2,165 unmarried)
Housing units in zip code 78225 with a mortgage: 1,228 (19
second mortgage , 21
both second mortgage and home equity loan )
Houses without a mortgage: 122
Median monthly owner costs for units with a mortgage: $1,149
Median monthly owner costs for units without a mortgage: $431
Residents with income below the poverty level in 2022:
This zip code:
22.8%Whole state:
14.0%
Residents with income below 50% of the poverty level in 2022:
This zip code:
15.8%Whole state:
7.4%
Median number of rooms in houses and condos: Median number of rooms in apartments: Notable locations in this zip code not listed on our city pages
Click to draw/clear zip code borders Notable location: (A) . Display/hide its location on the map
Churches in zip code 78225 include: (A) , Puerta La Hermosa Baptist Temple (B) , Saint James Catholic Church (C) , Ecumenical Catholic Church (D) , Asamblea Apostolica de la fe en Cristo Jesus (E) , Genesis Church (F) , Saint Martin And Saint Rose National Catholic Church (G) , Samaritan Monastery (H) , Templo Elim Assemblies of God (I) . Display/hide their locations on the map
Parks in zip code 78225 include: (1) , Palm Heights Park (2) . Display/hide their locations on the map
Tourist attraction (not listed on the city page) :
Year house built (houses)
0 2020 or later61 2010 to 201962 2000 to 200965 1990 to 1999153 1980 to 1989236 1970 to 1979362 1960 to 19691,582 1950 to 19591,822 1940 to 19491,048 1939 or earlier
Zip code 78225 household income distribution in 2022 503 Less than $10,000189 $10,000 to $14,999342 $15,000 to $19,999419 $20,000 to $24,999227 $25,000 to $29,999372 $30,000 to $34,999495 $35,000 to $39,999252 $40,000 to $44,99994 $45,000 to $49,999353 $50,000 to $59,9991,059 $60,000 to $74,999415 $75,000 to $99,999372 $100,000 to $124,999155 $125,000 to $149,999173 $150,000 to $199,99997 $200,000 or moreEstimate of home value of owner-occupied houses/condos in 2022 in zip code 78225 8 Less than $10,00019 $10,000 to $14,9998 $15,000 to $19,9998 $20,000 to $24,9997 $30,000 to $34,99925 $35,000 to $39,999116 $40,000 to $49,99966 $50,000 to $59,999200 $60,000 to $69,999175 $70,000 to $79,999528 $80,000 to $89,999422 $90,000 to $99,999648 $100,000 to $124,999182 $125,000 to $149,999117 $150,000 to $174,99950 $175,000 to $199,99997 $200,000 to $249,999265 $250,000 to $299,99948 $300,000 to $399,99912 $1,000,000 to $1,499,999Rent paid by renters in 2022 in zip code 78225 30 $200 to $24918 $250 to $29920 $450 to $49992 $500 to $54967 $550 to $59957 $600 to $64961 $650 to $699144 $700 to $749299 $750 to $799134 $800 to $899206 $900 to $99998 $1,000 to $1,249106 $1,250 to $1,499309 No cash rent
Median gross rent in 2022: $1,014.
Median price asked for vacant for-sale houses and condos in 2022: $290,328.
Estimated median house (or condo) value in 2022 for: White Non-Hispanic householders: $102,890Black or African American householders: $89,650American Indian or Alaska Native householders: $124,131Asian householders: $262,054Some other race householders: $113,648Two or more races householders: $123,027Hispanic or Latino householders: $113,373Estimated median house or condo value in 2022: $112,821
78225:
$112,821Texas:
$275,400
Lower value quartile - upper value quartile: $97,783 - $140,968
Mean price in 2022: Detached houses: $257,450Here:
$257,450State:
$369,058
Townhouses or other attached units: $278,164Here:
$278,164State:
$327,631
In 2-unit structures: $323,201Here:
$323,201State:
$374,947
In 3-to-4-unit structures: $186,623Here:
$186,623State:
$209,652
In 5-or-more-unit structures: $209,743Here:
$209,743State:
$413,944
Mobile homes: $81,302Here:
$81,302State:
$124,413
Occupied boats, RVs, vans, etc.: $105,053Here:
$105,053State:
$73,921
Housing units in structures:
One, detached: 5,172One, attached: 98Two: 2023 or 4: 465 to 9: 3910 to 19: 15220 to 49: 46Mobile homes: 28Unemployment : 6.5%
Means of transportation to work in zip code 78225 77.8% 5,037 Drove a car alone11.6% 752 Carpooled0.8% 55 Bus or trolley bus0.6% 38 Walked2.5% 164 Other means3.8% 244 Worked at homeTravel time to work (commute) in zip code 78225 44 Less than 5 minutes456 5 to 9 minutes1,310 10 to 14 minutes1,200 15 to 19 minutes1,144 20 to 24 minutes463 25 to 29 minutes778 30 to 34 minutes101 35 to 39 minutes216 40 to 44 minutes178 45 to 59 minutes86 60 to 89 minutes57 90 or more minutes
Percentage of zip code residents living and working in this county: 99.1%
Household type by relationship:
Households: 14,173
Male householders: 2,213 (673 living alone ), Female householders: 3,275 (1,436 living alone )1,771 spouses (1,771 opposite-sex spouses ), 421 unmarried partners , (365 opposite-sex unmarried partners ), 4,000 children (3,469 natural , 367 adopted , 167 stepchildren ), 737 grandchildren , 426 brothers or sisters , 167 parents , 73 foster children , 755 other relatives , 309 non-relatives In group quarters: 5 (-1 institutionalized population )
Size of family households: 888 2-persons , 807 3-persons , 783 4-persons , 248 5-persons , 164 6-persons , 169 7-or-more-persons
Size of nonfamily households: 2,107 1-person , 262 2-persons , 29 3-persons , 34 4-persons
1,096 married couples with children. single-parent households (121 men , 1,064 women ).
33.6% of residents of 78225 zip code speak English at home. of residents speak Spanish at home (64% very well, 18% well, 12% not well, 5% not at all ).of residents speak Asian or Pacific Island language at home (35% very well, 65% not at all ).
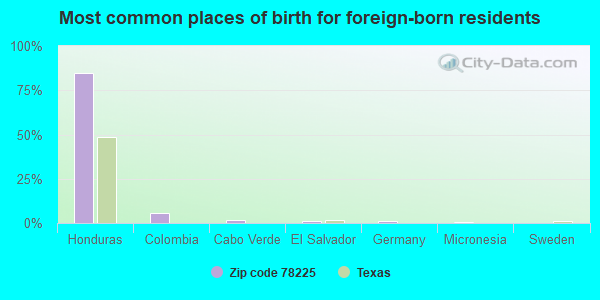
Foreign born population: 2,117 (14.9%)
(26.2%
of them are naturalized citizens )
This zip code:
14.9%Whole state:
17.2%
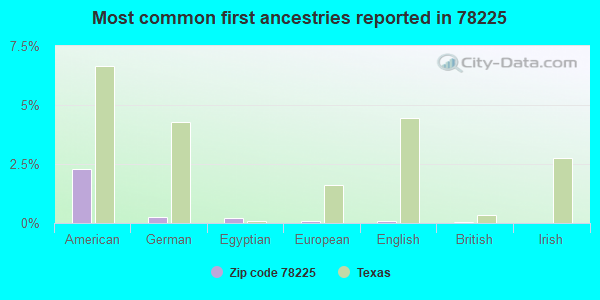
85% Honduras 6% Colombia 2% Cabo Verde 1% El Salvador 1% Germany 1% Micronesia 0% Sweden 2% American 0% German 0% Egyptian 0% European 0% English 0% British 0% Irish
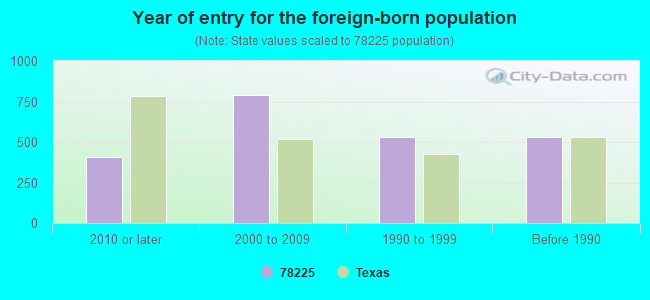
Year of entry for the foreign-born population
410 2010 or later 788 2000 to 2009 532 1990 to 1999 532 Before 1990
There are
19 Medical Specialists in Zip Code 78225 .
Housing units lacking complete plumbing facilities: 3.5%
Housing units lacking complete kitchen facilities: 4.8%
50.1% Utility gas 49.5% Electricity
Population in 1990: 13,803.
Place of birth for U.S.-born residents:
This state: 10,660Northeast: 59Midwest: 402South: 380West: 217
71% of the 78225 zip code residents lived in the same house 5 years ago.
Out of people who lived in different houses, 88% lived in this county.
Out of people who lived in different counties, 50% lived in Texas.
92% of the 78225 zip code residents lived in the same house 1 year ago.
Out of people who lived in different houses, 88% moved from this county.
Out of people who lived in different houses, 4% moved from different county within same state.
Out of people who lived in different houses, 3% moved from different state.
Private vs. public school enrollment:
Students in private schools in grades 1 to 8 (elementary and middle school): 140
Students in private schools in grades 9 to 12 (high school): 59
Students in private undergraduate colleges: 130
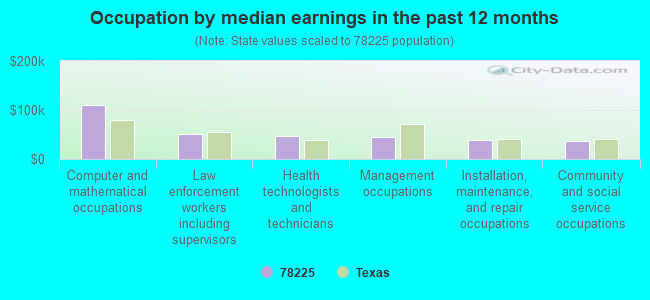
Occupation by median earnings in the past 12 months ($)
109,659 Computer and mathematical occupations 51,506 Law enforcement workers including supervisors 46,278 Health technologists and technicians 45,627 Management occupations 38,207 Installation, maintenance, and repair occupations 37,097 Community and social service occupations
Companies with federal contracts located in this zip code:
DIXIE AIR PARTS SUPPLY, INC (2048 W MALONE AVE in SAN ANTONIO, TX; small business) in 261 contracts from 1999 to 2006
Contracts for Microcircuits, Electronic, Airframe Structural Components, Engine Instruments, Electrical and Electronic assemblies, Boards, Cards, and Associated Hardware, and more by Air Force, Defense Logistics Agency, Army, Navy, and others Signed by year: 2000: $209,667; 2001: $489,550; 2002: $627,315; 2003: $224,695; 2004: $741,161; 2005: $738,598; 2006: $730,002.
Biggest contracts: with Air Force for Microcircuits, Electronic. Signed on 2002-09-23. Completion date: 2002-11-15.
with Defense Logistics Agency for Airframe Structural Components. Signed on 2001-11-21. Completion date: 2002-01-20.
with Defense Logistics Agency for Engine Instruments. Signed on 2006-03-17. Completion date: 2006-04-17.
with Defense Logistics Agency for Electrical and Electronic assemblies, Boards, Cards, and Associated Hardware. Signed on 2004-03-08. Completion date: 2004-04-07.
A & M CLEANERS (118 SURREY AVE in SAN ANTONIO, TX; small business) in 17 contracts from 2002 to 2006
Contracts for Laundry and DryCleaning Services by ArmySigned by year: 2000: $0; 2001: $0; 2002: $91,702; 2003: $19,578; 2004: $42,230; 2005: $70,560; 2006: $4,605.
Biggest contracts: with Army for Laundry and DryCleaning Services. Signed on 2005-10-11. Completion date: 2004-09-30.
, same as above. Signed on 2004-10-08. Completion date: 2004-09-30.
, same as above. Signed on 2004-05-05. Completion date: 2004-09-30.
, same as above. Signed on 2003-10-28. Completion date: 2003-10-01.
Top industries in this zip code by the number of employees in 2005:
Accommodation and Food Services: Limited-Service Restaurants (20-49 employees: 3 establishments, 10-19 employees: 5 establishments, 5-9 employees: 2 establishments, 1-4 employees: 1 establishment)Professional, Scientific, and Technical Services: Tax Preparation Services (100-249: 1, 10-19: 1, 5-9: 1)Other Services (except Public Administration): Religious Organizations (50-99: 1, 20-49: 1, 1-4: 1)Accommodation and Food Services: Full-Service Restaurants (20-49: 2, 5-9: 2, 1-4: 3)Educational Services: Educational Support Services (50-99: 1)
People in group quarters in 2010:
4 people in other noninstitutional facilities
People in group quarters in 2000:
7 people in religious group quarters
Fatal accident statistics in 2013:
Fatal accident count: 2Vehicles involved in fatal accidents: 4Fatal accidents caused by drunken drivers: 2Fatalities: 2Persons involved in fatal accidents: 6Pedestrians involved in fatal accidents: 0
Fatal accident statistics in 2012:
Fatal accident count: 2Vehicles involved in fatal accidents: 3Fatal accidents caused by drunken drivers: 0Fatalities: 3Persons involved in fatal accidents: 7Pedestrians involved in fatal accidents: 0
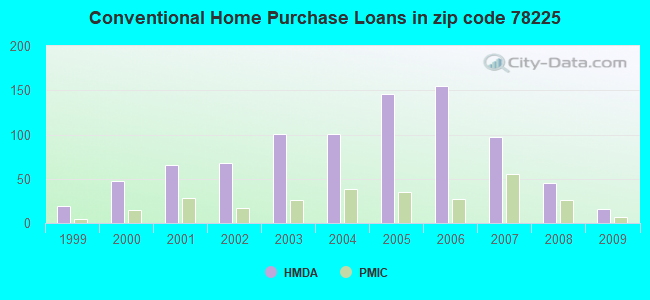
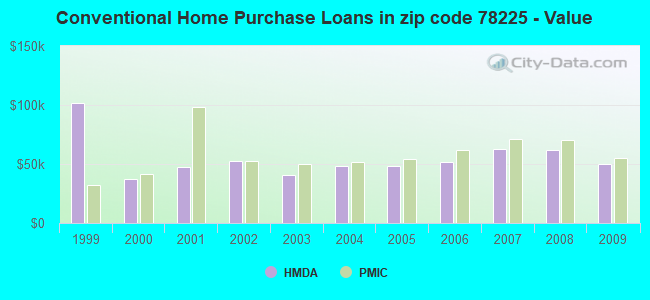
Home Mortgage Disclosure Act Aggregated Statistics For Year 2009(Based on 4 full and 4 partial tracts) A) FHA, FSA/RHS & VA B) Conventional C) Refinancings D) Home Improvement Loans F) Non-occupant Loans on G) Loans On Manufactured Number Average Value Number Average Value Number Average Value Number Average Value Number Average Value Number Average Value
LOANS ORIGINATED 42 $76,687 16 $50,322 76 $48,860 24 $35,835 18 $43,062 0 $0 APPLICATIONS APPROVED, NOT ACCEPTED 2 $65,260 7 $25,597 13 $45,405 3 $14,783 5 $37,138 2 $26,870 APPLICATIONS DENIED 21 $74,376 14 $49,172 94 $49,492 96 $23,030 8 $36,961 0 $0 APPLICATIONS WITHDRAWN 12 $77,258 2 $54,705 9 $72,819 9 $22,191 7 $73,500 0 $0 FILES CLOSED FOR INCOMPLETENESS 2 $65,260 0 $0 7 $52,540 3 $41,720 3 $49,893 0 $0
Aggregated Statistics For Year 2008(Based on 4 full and 4 partial tracts) A) FHA, FSA/RHS & VA B) Conventional C) Refinancings D) Home Improvement Loans F) Non-occupant Loans on G) Loans On Manufactured Number Average Value Number Average Value Number Average Value Number Average Value Number Average Value Number Average Value
LOANS ORIGINATED 38 $76,412 45 $62,106 91 $52,388 64 $35,505 32 $50,489 0 $0 APPLICATIONS APPROVED, NOT ACCEPTED 6 $150,588 15 $62,053 19 $53,587 1 $5,760 5 $50,978 3 $48,533 APPLICATIONS DENIED 10 $78,269 25 $55,121 132 $61,472 146 $28,682 25 $55,501 3 $27,530 APPLICATIONS WITHDRAWN 8 $72,855 11 $61,130 36 $63,170 8 $46,458 12 $60,210 0 $0 FILES CLOSED FOR INCOMPLETENESS 3 $85,980 2 $63,340 8 $53,220 0 $0 0 $0 0 $0
Aggregated Statistics For Year 2007(Based on 4 full and 4 partial tracts) A) FHA, FSA/RHS & VA B) Conventional C) Refinancings D) Home Improvement Loans F) Non-occupant Loans on G) Loans On Manufactured Number Average Value Number Average Value Number Average Value Number Average Value Number Average Value Number Average Value
LOANS ORIGINATED 14 $70,312 97 $62,707 125 $56,923 92 $28,878 54 $54,906 0 $0 APPLICATIONS APPROVED, NOT ACCEPTED 2 $49,570 15 $65,503 27 $41,013 18 $16,603 3 $43,763 2 $43,750 APPLICATIONS DENIED 5 $44,988 75 $62,288 314 $55,891 170 $31,535 35 $48,274 15 $54,561 APPLICATIONS WITHDRAWN 1 $41,540 29 $53,339 92 $64,167 14 $27,191 12 $46,341 0 $0 FILES CLOSED FOR INCOMPLETENESS 0 $0 8 $70,192 34 $66,311 4 $42,225 3 $82,983 0 $0
Aggregated Statistics For Year 2006(Based on 4 full and 4 partial tracts) A) FHA, FSA/RHS & VA B) Conventional C) Refinancings D) Home Improvement Loans F) Non-occupant Loans on G) Loans On Manufactured Number Average Value Number Average Value Number Average Value Number Average Value Number Average Value Number Average Value
LOANS ORIGINATED 25 $69,174 155 $52,117 167 $53,936 91 $25,526 86 $51,170 6 $45,425 APPLICATIONS APPROVED, NOT ACCEPTED 1 $57,600 49 $52,002 47 $57,841 15 $20,349 16 $66,560 7 $41,390 APPLICATIONS DENIED 1 $56,650 120 $56,962 282 $55,269 176 $25,503 91 $57,267 10 $42,657 APPLICATIONS WITHDRAWN 3 $77,650 54 $66,119 166 $60,856 15 $36,467 24 $47,551 0 $0 FILES CLOSED FOR INCOMPLETENESS 1 $65,150 6 $64,782 16 $57,833 5 $52,154 2 $9,595 0 $0
Aggregated Statistics For Year 2005(Based on 4 full and 4 partial tracts) A) FHA, FSA/RHS & VA B) Conventional C) Refinancings D) Home Improvement Loans F) Non-occupant Loans on G) Loans On Manufactured Number Average Value Number Average Value Number Average Value Number Average Value Number Average Value Number Average Value
LOANS ORIGINATED 18 $65,879 146 $48,345 167 $51,814 89 $46,547 59 $48,332 0 $0 APPLICATIONS APPROVED, NOT ACCEPTED 3 $70,637 46 $47,784 41 $48,242 26 $24,417 10 $46,136 9 $47,018 APPLICATIONS DENIED 13 $82,934 116 $45,346 319 $49,041 131 $22,486 53 $42,786 25 $32,798 APPLICATIONS WITHDRAWN 5 $58,862 66 $71,168 119 $65,486 60 $142,980 28 $53,659 0 $0 FILES CLOSED FOR INCOMPLETENESS 0 $0 15 $76,240 20 $65,399 4 $21,592 1 $35,880 0 $0
Aggregated Statistics For Year 2004(Based on 4 full and 4 partial tracts) A) FHA, FSA/RHS & VA B) Conventional C) Refinancings D) Home Improvement Loans F) Non-occupant Loans on G) Loans On Manufactured Number Average Value Number Average Value Number Average Value Number Average Value Number Average Value Number Average Value
LOANS ORIGINATED 49 $58,830 101 $48,557 231 $46,497 78 $27,487 51 $42,108 0 $0 APPLICATIONS APPROVED, NOT ACCEPTED 3 $76,777 32 $46,405 44 $49,725 23 $23,049 9 $40,928 4 $37,160 APPLICATIONS DENIED 18 $79,554 113 $63,983 333 $48,467 167 $22,966 37 $43,827 23 $33,821 APPLICATIONS WITHDRAWN 30 $101,788 40 $76,215 155 $50,379 23 $32,269 27 $84,486 0 $0 FILES CLOSED FOR INCOMPLETENESS 6 $102,048 6 $106,403 26 $95,011 0 $0 4 $91,225 0 $0
Aggregated Statistics For Year 2003(Based on 4 full and 4 partial tracts) A) FHA, FSA/RHS & VA B) Conventional C) Refinancings D) Home Improvement Loans E) Loans on Dwellings For 5+ Families F) Non-occupant Loans on Number Average Value Number Average Value Number Average Value Number Average Value Number Average Value Number Average Value
LOANS ORIGINATED 42 $58,402 101 $40,776 308 $45,543 41 $19,286 2 $407,420 60 $35,517 APPLICATIONS APPROVED, NOT ACCEPTED 3 $34,110 19 $37,478 76 $45,597 18 $12,059 0 $0 15 $41,303 APPLICATIONS DENIED 6 $60,755 67 $46,039 404 $43,311 92 $21,157 0 $0 43 $38,716 APPLICATIONS WITHDRAWN 20 $103,922 27 $60,619 143 $45,768 12 $42,738 0 $0 25 $38,397 FILES CLOSED FOR INCOMPLETENESS 8 $62,875 4 $42,038 22 $41,969 2 $31,160 0 $0 3 $31,587
Aggregated Statistics For Year 2002(Based on 4 full and 2 partial tracts) A) FHA, FSA/RHS & VA B) Conventional C) Refinancings D) Home Improvement Loans E) Loans on Dwellings For 5+ Families F) Non-occupant Loans on Number Average Value Number Average Value Number Average Value Number Average Value Number Average Value Number Average Value
LOANS ORIGINATED 54 $58,051 68 $52,352 159 $41,550 57 $16,002 2 $374,285 28 $39,125 APPLICATIONS APPROVED, NOT ACCEPTED 1 $75,540 25 $55,022 41 $47,058 27 $13,768 0 $0 8 $56,749 APPLICATIONS DENIED 6 $59,852 55 $51,974 215 $38,727 97 $12,378 0 $0 30 $32,913 APPLICATIONS WITHDRAWN 9 $70,189 27 $94,575 96 $44,834 11 $28,255 0 $0 7 $44,584 FILES CLOSED FOR INCOMPLETENESS 2 $44,145 10 $38,004 15 $48,863 0 $0 0 $0 0 $0
Aggregated Statistics For Year 2001(Based on 4 full and 2 partial tracts) A) FHA, FSA/RHS & VA B) Conventional C) Refinancings D) Home Improvement Loans F) Non-occupant Loans on Number Average Value Number Average Value Number Average Value Number Average Value Number Average Value
LOANS ORIGINATED 57 $53,710 66 $47,409 140 $42,161 64 $14,427 17 $49,206 APPLICATIONS APPROVED, NOT ACCEPTED 2 $58,665 18 $43,354 21 $37,600 23 $14,287 0 $0 APPLICATIONS DENIED 9 $52,184 48 $45,767 142 $52,951 114 $13,093 16 $27,671 APPLICATIONS WITHDRAWN 4 $181,862 26 $126,093 61 $36,569 13 $13,972 5 $33,224 FILES CLOSED FOR INCOMPLETENESS 1 $55,710 9 $65,550 11 $41,695 1 $30,210 1 $43,430
Aggregated Statistics For Year 2000(Based on 4 full and 2 partial tracts) A) FHA, FSA/RHS & VA B) Conventional C) Refinancings D) Home Improvement Loans F) Non-occupant Loans on Number Average Value Number Average Value Number Average Value Number Average Value Number Average Value
LOANS ORIGINATED 34 $51,175 47 $37,479 104 $34,202 58 $13,666 16 $30,756 APPLICATIONS APPROVED, NOT ACCEPTED 4 $43,962 19 $32,730 26 $24,681 45 $11,459 4 $27,870 APPLICATIONS DENIED 6 $45,957 66 $40,386 66 $35,277 78 $12,665 16 $31,452 APPLICATIONS WITHDRAWN 4 $69,825 6 $35,188 49 $36,293 10 $22,087 2 $27,830 FILES CLOSED FOR INCOMPLETENESS 0 $0 3 $42,273 27 $43,972 0 $0 3 $24,483
Aggregated Statistics For Year 1999(Based on 1 full and 4 partial tracts) A) FHA, FSA/RHS & VA B) Conventional C) Refinancings D) Home Improvement Loans F) Non-occupant Loans on Number Average Value Number Average Value Number Average Value Number Average Value Number Average Value
LOANS ORIGINATED 34 $49,481 19 $102,058 55 $32,569 34 $12,967 10 $28,537 APPLICATIONS APPROVED, NOT ACCEPTED 1 $55,730 13 $35,191 14 $29,981 28 $11,692 2 $28,085 APPLICATIONS DENIED 2 $48,555 46 $37,921 41 $32,447 66 $14,005 12 $27,706 APPLICATIONS WITHDRAWN 2 $56,450 7 $42,120 22 $29,518 10 $17,982 2 $21,105 FILES CLOSED FOR INCOMPLETENESS 1 $45,490 1 $126,340 18 $34,929 1 $14,070 1 $37,390
Detailed HMDA statistics for the following Tracts:
1504.00
,
1505.01 ,
1603.00 ,
1604.00
Private Mortgage Insurance Companies Aggregated Statistics For Year 2009(Based on 4 full and 2 partial tracts) A) Conventional C) Non-occupant Loans on Number Average Value Number Average Value
LOANS ORIGINATED 7 $54,709 0 $0 APPLICATIONS APPROVED, NOT ACCEPTED 0 $0 0 $0 APPLICATIONS DENIED 0 $0 0 $0 APPLICATIONS WITHDRAWN 2 $54,705 0 $0 FILES CLOSED FOR INCOMPLETENESS 1 $43,880 1 $43,880
Aggregated Statistics For Year 2008(Based on 4 full and 4 partial tracts) A) Conventional B) Refinancings C) Non-occupant Loans on Number Average Value Number Average Value Number Average Value
LOANS ORIGINATED 26 $70,291 4 $90,295 10 $65,937 APPLICATIONS APPROVED, NOT ACCEPTED 13 $65,490 0 $0 9 $67,588 APPLICATIONS DENIED 0 $0 1 $66,090 1 $66,090 APPLICATIONS WITHDRAWN 5 $54,074 1 $66,090 3 $45,337 FILES CLOSED FOR INCOMPLETENESS 2 $83,495 1 $66,090 2 $83,495
Aggregated Statistics For Year 2007(Based on 4 full and 4 partial tracts) A) Conventional C) Non-occupant Loans on Number Average Value Number Average Value
LOANS ORIGINATED 55 $71,165 8 $58,999 APPLICATIONS APPROVED, NOT ACCEPTED 8 $110,870 1 $43,430 APPLICATIONS DENIED 3 $105,913 0 $0 APPLICATIONS WITHDRAWN 2 $83,495 0 $0 FILES CLOSED FOR INCOMPLETENESS 0 $0 0 $0
Aggregated Statistics For Year 2006(Based on 4 full and 4 partial tracts) A) Conventional B) Refinancings C) Non-occupant Loans on Number Average Value Number Average Value Number Average Value
LOANS ORIGINATED 27 $62,196 3 $73,333 8 $63,310 APPLICATIONS APPROVED, NOT ACCEPTED 4 $78,260 3 $63,577 0 $0 APPLICATIONS DENIED 2 $78,695 0 $0 0 $0 APPLICATIONS WITHDRAWN 1 $77,420 0 $0 0 $0 FILES CLOSED FOR INCOMPLETENESS 0 $0 0 $0 0 $0
Aggregated Statistics For Year 2005(Based on 4 full and 4 partial tracts) A) Conventional B) Refinancings C) Non-occupant Loans on Number Average Value Number Average Value Number Average Value
LOANS ORIGINATED 35 $54,068 9 $58,027 11 $46,129 APPLICATIONS APPROVED, NOT ACCEPTED 7 $47,237 1 $73,650 0 $0 APPLICATIONS DENIED 0 $0 0 $0 0 $0 APPLICATIONS WITHDRAWN 0 $0 0 $0 0 $0 FILES CLOSED FOR INCOMPLETENESS 0 $0 0 $0 0 $0
Aggregated Statistics For Year 2004(Based on 4 full and 4 partial tracts) A) Conventional B) Refinancings C) Non-occupant Loans on Number Average Value Number Average Value Number Average Value
LOANS ORIGINATED 38 $52,007 2 $53,745 12 $49,474 APPLICATIONS APPROVED, NOT ACCEPTED 5 $35,690 3 $61,323 2 $53,745 APPLICATIONS DENIED 0 $0 0 $0 0 $0 APPLICATIONS WITHDRAWN 3 $37,947 0 $0 0 $0 FILES CLOSED FOR INCOMPLETENESS 0 $0 0 $0 0 $0
Aggregated Statistics For Year 2003(Based on 4 full and 4 partial tracts) A) Conventional B) Refinancings C) Non-occupant Loans on Number Average Value Number Average Value Number Average Value
LOANS ORIGINATED 26 $50,140 6 $70,545 3 $49,960 APPLICATIONS APPROVED, NOT ACCEPTED 4 $57,218 2 $40,305 0 $0 APPLICATIONS DENIED 0 $0 0 $0 0 $0 APPLICATIONS WITHDRAWN 0 $0 2 $49,715 2 $49,715 FILES CLOSED FOR INCOMPLETENESS 0 $0 0 $0 0 $0
Aggregated Statistics For Year 2002(Based on 4 full and 2 partial tracts) A) Conventional B) Refinancings C) Non-occupant Loans on Number Average Value Number Average Value Number Average Value
LOANS ORIGINATED 17 $52,422 2 $94,460 0 $0 APPLICATIONS APPROVED, NOT ACCEPTED 4 $40,768 4 $42,228 1 $26,440 APPLICATIONS DENIED 0 $0 0 $0 0 $0 APPLICATIONS WITHDRAWN 2 $59,500 0 $0 0 $0 FILES CLOSED FOR INCOMPLETENESS 0 $0 0 $0 0 $0
Aggregated Statistics For Year 2001(Based on 4 full and 2 partial tracts) A) Conventional C) Non-occupant Loans on Number Average Value Number Average Value
LOANS ORIGINATED 28 $97,978 3 $29,287 APPLICATIONS APPROVED, NOT ACCEPTED 2 $31,670 0 $0 APPLICATIONS DENIED 0 $0 0 $0 APPLICATIONS WITHDRAWN 2 $69,100 0 $0 FILES CLOSED FOR INCOMPLETENESS 0 $0 0 $0
Aggregated Statistics For Year 2000(Based on 4 full and 2 partial tracts) A) Conventional B) Refinancings C) Non-occupant Loans on Number Average Value Number Average Value Number Average Value
LOANS ORIGINATED 15 $41,345 5 $37,024 2 $36,470 APPLICATIONS APPROVED, NOT ACCEPTED 3 $99,607 0 $0 0 $0 APPLICATIONS DENIED 1 $32,100 2 $89,485 0 $0 APPLICATIONS WITHDRAWN 0 $0 0 $0 0 $0 FILES CLOSED FOR INCOMPLETENESS 0 $0 0 $0 0 $0
Aggregated Statistics For Year 1999(Based on 1 full and 3 partial tracts) A) Conventional C) Non-occupant Loans on Number Average Value Number Average Value
LOANS ORIGINATED 5 $32,194 1 $25,160 APPLICATIONS APPROVED, NOT ACCEPTED 0 $0 0 $0 APPLICATIONS DENIED 0 $0 0 $0 APPLICATIONS WITHDRAWN 0 $0 0 $0 FILES CLOSED FOR INCOMPLETENESS 0 $0 0 $0
Detailed PMIC statistics for the following Tracts:
1504.00
,
1505.01 ,
1603.00 ,
1604.00
2002 - 2018 National Fire Incident Reporting System (NFIRS) incidents See full 2006 National Fire Incident Reporting System statistics for zip code 78225, Texas
Most common first names in zip code 78225 among deceased individuals Name Count Lived (average)
Maria 112 78.2 years Mary 69 79.0 years Joe 63 69.1 years Jose 57 70.9 years Manuel 56 75.9 years Juan 50 72.7 years Jesus 47 74.2 years Guadalupe 46 71.1 years John 44 73.2 years Frank 27 75.5 years
Most common last names in zip code 78225 among deceased individuals Last name Count Lived (average)
Martinez 101 75.6 years Rodriguez 85 73.5 years Garcia 82 76.0 years Hernandez 78 71.8 years Garza 71 75.2 years Perez 58 75.0 years Gonzales 57 71.4 years Lopez 50 66.9 years Sanchez 49 72.6 years Flores 47 72.1 years
Businesses in zip code 78225
Name Count Name Count
Advance Auto Parts 1 McDonald's 1 CVS 2 Payless 1 Church's Chicken 1 SONIC Drive-In 2 Cricket Wireless 2 Subway 1 H&R Block 1 Walgreens 1


 Nearest zip codes: 78204, 78207, 78226, 78205, 78237, 78210.
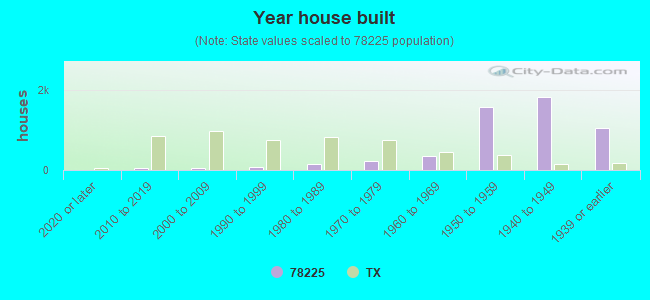


 : $3,842,113 in 261 contracts from 1999 to 2006

 According to the data from the years 2002 - 2018 the average number of fire incidents per year is 32. The highest number of reported fire incidents - 49 took place in 2005, and the least - 0 in 2008. The data has a decreasing trend.
 When looking into fire subcategories, the most incidents belonged to: Outside Fires (43.4%), and Mobile Property/Vehicle Fires (24.6%).