Estimated zip code population in 2022: 34,311 Zip code population in 2010: 36,865 Zip code population in 2000: 37,345
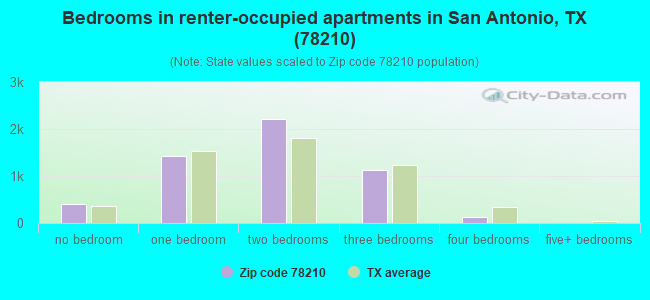
Houses and condos: 15,033 Renter-occupied apartments: 5,325
% of renters here:
42%
State:
38%
March 2022 cost of living index in zip code 78210: 87.0 (less than average, U.S. average is 100)
Land area: 7.4 sq. mi. Water area: 0.0 sq. mi.
Population density: 4,614 people per square mile
(average).
OSM Map
General Map
Google Map
MSN Map
OSM Map
General Map
Google Map
MSN Map
OSM Map
General Map
Google Map
MSN Map
OSM Map
General Map
Google Map
MSN Map
Please wait while loading the map...
Real estate property taxes paid for housing units in 2022:
This zip code:
1.3% ($2,107)
Texas:
1.5% ($4,050)
Median real estate property taxes paid for housing units with mortgages in 2022: $3,013 (1.5%) Median real estate property taxes paid for housing units with no mortgage in 2022: $1,746 (1.3%)
Averages for the 2020 tax year for zip code 78210, filed in 2021:
Average Adjusted Gross Income (AGI) in 2020: $41,181 (Individual Income Tax Returns)
Here:
$41,181
State:
$77,054
Salary/wage: $36,872 (reported on 82.5% of returns)
Here:
$36,872
State:
$62,766
(% of AGI for various income ranges: 1104.3% for AGIs below $25k, 3412.8% for AGIs $25k-50k, 6476.8% for AGIs $50k-75k, 9820.8% for AGIs $75k-100k, 16694.9% for AGIs $100k-200k, 77338.6% for AGIs over 200k)
Taxable interest for individuals: $1,070 (reported on 12.9% of returns)
This zip code:
$1,070
Texas:
$2,665
(% of AGI for various income ranges: 4.7% for AGIs below $25k, 4.5% for AGIs $25k-50k, 14.4% for AGIs $50k-75k, 39.4% for AGIs $75k-100k, 62.3% for AGIs $100k-200k, 1462.9% for AGIs over 200k)
Ordinary dividends: $5,977 (reported on 5.2% of returns)
Here:
$5,977
State:
$10,044
(% of AGI for various income ranges: 3.2% for AGIs below $25k, 6.2% for AGIs $25k-50k, 18.3% for AGIs $50k-75k, 41.2% for AGIs $75k-100k, 199.5% for AGIs $100k-200k, 4454.3% for AGIs over 200k)
Net capital gain/loss in AGI: +$16,375 (reported on 5.5% of returns)
Here:
+$16,375
State:
+$39,590
(% of AGI for various income ranges: 2.0% for AGIs below $25k, 11.6% for AGIs $25k-50k, 33.4% for AGIs $50k-75k, 127.4% for AGIs $75k-100k, 555.6% for AGIs $100k-200k, 14452.9% for AGIs over 200k)
Profit/loss from business: +$9,538 (reported on 18.3% of returns)
Here:
+$9,538
State:
+$10,888
(% of AGI for various income ranges: 193.5% for AGIs below $25k, 140.7% for AGIs $25k-50k, 130.3% for AGIs $50k-75k, 343.8% for AGIs $75k-100k, 615.6% for AGIs $100k-200k, 6045.7% for AGIs over 200k)
Taxable individual retirement arrangement distribution: $17,894 (reported on 3.0% of returns)
78210:
$17,894
Texas:
$24,740
(% of AGI for various income ranges: 12.7% for AGIs below $25k, 28.8% for AGIs $25k-50k, 64.6% for AGIs $50k-75k, 137.8% for AGIs $75k-100k, 497.9% for AGIs $100k-200k, 3830.0% for AGIs over 200k)
Total itemized deductions: $28,771 (reported on 3.1% of returns)
Here:
$28,771
State:
$40,428
(% of AGI for various income ranges: 8.9% for AGIs below $25k, 60.7% for AGIs $25k-50k, 133.2% for AGIs $50k-75k, 317.4% for AGIs $75k-100k, 857.9% for AGIs $100k-200k, 5391.4% for AGIs over 200k)
Charity contributions: $8,995 (reported on 2.4% of returns)
Here:
$8,995
State:
$18,201
(% of AGI for various income ranges: 11.5% for AGIs $25k-50k, 24.7% for AGIs $50k-75k, 64.6% for AGIs $75k-100k, 163.0% for AGIs $100k-200k, 2074.3% for AGIs over 200k)
Taxes paid: $6,935 (reported on 3.1% of returns)
78210:
$6,935
State:
$7,821
(% of AGI for various income ranges: 2.2% for AGIs below $25k, 11.5% for AGIs $25k-50k, 37.3% for AGIs $50k-75k, 85.0% for AGIs $75k-100k, 221.4% for AGIs $100k-200k, 1120.0% for AGIs over 200k)
Earned income credit: $2,537 (reported on 30.2% of returns)
Here:
$2,537
State:
$2,584
(% of AGI for various income ranges: 150.4% for AGIs below $25k, 82.2% for AGIs $25k-50k, 1.3% for AGIs $50k-75k)
Percentage of individuals using paid preparers for their 2020 taxes: 91.7%
Here:
92%
State:
92%
(% for various income ranges: 90.3% for AGIs below $25k, 93.7% for AGIs $25k-50k, 91.2% for AGIs $50k-75k, 93.0% for AGIs $75k-100k, 91.5% for AGIs $100k-200k, 95.5% for AGIs over 200k)
Averages for the 2012 tax year for zip code 78210, filed in 2013:
Average Adjusted Gross Income (AGI) in 2012: $29,850 (Individual Income Tax Returns)
Here:
$29,850
State:
$65,384
Salary/wage: $27,844 (reported on 85.8% of returns)
Here:
$27,844
State:
$52,524
(% of AGI for various income ranges: 78.9% for AGIs below $25k, 87.7% for AGIs $25k-50k, 82.8% for AGIs $50k-75k, 78.7% for AGIs $75k-100k, 73.8% for AGIs $100k-200k, 49.5% for AGIs over 200k)
Taxable interest for individuals: $1,303 (reported on 11.6% of returns)
This zip code:
$1,303
Texas:
$2,372
(% of AGI for various income ranges: 0.3% for AGIs below $25k, 0.2% for AGIs $25k-50k, 0.5% for AGIs $50k-75k, 0.6% for AGIs $75k-100k, 1.2% for AGIs $100k-200k, 2.0% for AGIs over 200k)
Ordinary dividends: $4,752 (reported on 4.2% of returns)
Here:
$4,752
State:
$9,721
(% of AGI for various income ranges: 0.3% for AGIs below $25k, 0.2% for AGIs $25k-50k, 0.4% for AGIs $50k-75k, 0.4% for AGIs $75k-100k, 2.0% for AGIs $100k-200k, 3.6% for AGIs over 200k)
Net capital gain/loss in AGI: +$5,681 (reported on 3.0% of returns)
Here:
+$5,681
State:
+$35,319
(% of AGI for various income ranges: 0.2% for AGIs $25k-50k, 0.3% for AGIs $50k-75k, 0.6% for AGIs $75k-100k, 1.3% for AGIs $100k-200k, 4.3% for AGIs over 200k)
Profit/loss from business: +$9,249 (reported on 15.5% of returns)
Here:
+$9,249
State:
+$13,732
(% of AGI for various income ranges: 11.7% for AGIs below $25k, 2.0% for AGIs $25k-50k, 1.6% for AGIs $50k-75k, 2.6% for AGIs $75k-100k, 2.9% for AGIs $100k-200k, 6.3% for AGIs over 200k)
Taxable individual retirement arrangement distribution: $10,784 (reported on 3.2% of returns)
78210:
$10,784
Texas:
$19,511
(% of AGI for various income ranges: 0.6% for AGIs below $25k, 0.7% for AGIs $25k-50k, 1.5% for AGIs $50k-75k, 2.7% for AGIs $75k-100k, 3.5% for AGIs $100k-200k)
Total itemized deductions: $16,564 (22% of AGI, reported on 7.8% of returns)
Here:
$16,564
State:
$24,724
Here:
21.9% of AGI
State:
15.9% of AGI
(% of AGI for various income ranges: 1.6% for AGIs below $25k, 3.7% for AGIs $25k-50k, 6.2% for AGIs $50k-75k, 6.4% for AGIs $75k-100k, 7.7% for AGIs $100k-200k, 6.3% for AGIs over 200k)
Charity contributions: $3,229 (reported on 5.4% of returns)
Here:
$3,229
State:
$6,808
(% of AGI for various income ranges: 0.1% for AGIs below $25k, 0.4% for AGIs $25k-50k, 0.8% for AGIs $50k-75k, 1.1% for AGIs $75k-100k, 1.3% for AGIs $100k-200k, 1.4% for AGIs over 200k)
Taxes paid: $4,254 (reported on 7.4% of returns)
78210:
$4,254
State:
$6,921
(% of AGI for various income ranges: 0.3% for AGIs below $25k, 0.8% for AGIs $25k-50k, 1.3% for AGIs $50k-75k, 1.5% for AGIs $75k-100k, 2.4% for AGIs $100k-200k, 2.1% for AGIs over 200k)
Earned income credit: $2,674 (reported on 39.4% of returns)
Here:
$2,674
State:
$2,570
(% of AGI for various income ranges: 11.3% for AGIs below $25k, 1.9% for AGIs $25k-50k)
Percentage of individuals using paid preparers for their 2012 taxes: 47.1%
Here:
47%
State:
51%
(% for various income ranges: 48.1% for AGIs below $25k, 44.2% for AGIs $25k-50k, 47.7% for AGIs $50k-75k, 45.7% for AGIs $75k-100k, 50.0% for AGIs $100k-200k, 75.0% for AGIs over 200k)
Averages for the 2004 tax year for zip code 78210, filed in 2005:
Average Adjusted Gross Income (AGI) in 2004: $23,497 (Individual Income Tax Returns)
Here:
$23,497
State:
$47,881
Salary/wage: $22,254 (reported on 87.0% of returns)
Here:
$22,254
State:
$41,947
(% of AGI for various income ranges: 89.1% for AGIs below $10k, 84.2% for AGIs $10k-25k, 86.5% for AGIs $25k-50k, 82.3% for AGIs $50k-75k, 78.2% for AGIs $75k-100k, 55.9% for AGIs over 100k)
Taxable interest for individuals: $1,456 (reported on 15.6% of returns)
This zip code:
$1,456
Texas:
$2,255
(% of AGI for various income ranges: 0.9% for AGIs below $10k, 0.6% for AGIs $10k-25k, 0.6% for AGIs $25k-50k, 1.1% for AGIs $50k-75k, 2.0% for AGIs $75k-100k, 3.1% for AGIs over 100k)
Taxable dividends: $2,078 (reported on 5.0% of returns)
Here:
$2,078
State:
$4,261
(% of AGI for various income ranges: 0.3% for AGIs below $10k, 0.2% for AGIs $10k-25k, 0.1% for AGIs $25k-50k, 0.5% for AGIs $50k-75k, 1.2% for AGIs $75k-100k, 2.3% for AGIs over 100k)
Net capital gain/loss: +$4,933 (reported on 3.8% of returns)
Here:
+$4,933
State:
+$16,110
(% of AGI for various income ranges: -0.1% for AGIs below $10k, 0.1% for AGIs $10k-25k, 0.2% for AGIs $25k-50k, 0.8% for AGIs $50k-75k, 1.4% for AGIs $75k-100k, 6.6% for AGIs over 100k)
Profit/loss from business: +$7,495 (reported on 12.3% of returns)
Here:
+$7,495
State:
+$11,013
(% of AGI for various income ranges: 11.9% for AGIs below $10k, 5.6% for AGIs $10k-25k, 1.6% for AGIs $25k-50k, 1.3% for AGIs $50k-75k, 1.3% for AGIs $75k-100k, 9.6% for AGIs over 100k)
IRA payment deduction: $2,127 (reported on 0.8% of returns)
78210:
$2,127
Texas:
$3,120
(% of AGI for various income ranges: 0.0% for AGIs $10k-25k, 0.1% for AGIs $25k-50k, 0.1% for AGIs $50k-75k, 0.1% for AGIs over 100k)
Self-employed pension: $21,688 (reported on 0.1% of returns)
Here:
$21,688
Texas:
$16,401
Total itemized deductions: $13,658 (24% of AGI, reported on 5.9% of returns)
Here:
$13,658
State:
$19,631
Here:
23.7% of AGI
State:
18.9% of AGI
(% of AGI for various income ranges: 1.1% for AGIs below $10k, 1.6% for AGIs $10k-25k, 3.2% for AGIs $25k-50k, 5.0% for AGIs $50k-75k, 6.4% for AGIs $75k-100k, 8.2% for AGIs over 100k)
Charity contributions deductions: $2,645 (4% of AGI, reported on 4.6% of returns)
Here:
$2,645
State:
$4,753
Here:
4.2% of AGI
State:
4.2% of AGI
(% of AGI for various income ranges: 0.1% for AGIs below $10k, 0.2% for AGIs $10k-25k, 0.4% for AGIs $25k-50k, 0.8% for AGIs $50k-75k, 0.8% for AGIs $75k-100k, 2.0% for AGIs over 100k)
Total tax: $2,784 (reported on 58.5% of returns)
78210:
$2,784
State:
$9,058
(% of AGI for various income ranges: 2.7% for AGIs below $10k, 3.2% for AGIs $10k-25k, 6.3% for AGIs $25k-50k, 9.5% for AGIs $50k-75k, 11.5% for AGIs $75k-100k, 19.1% for AGIs over 100k)
Earned income credit: $2,079 (reported on 40.5% of returns)
Here:
$2,079
State:
$2,024
Percentage of individuals using paid preparers for their 2004 taxes: 62.1%
Here:
62%
State:
57%
(% for various income ranges: 61.3% for AGIs below $10k, 66.7% for AGIs $10k-25k, 57.3% for AGIs $25k-50k, 53.9% for AGIs $50k-75k, 52.8% for AGIs $75k-100k, 61.3% for AGIs over 100k)
Likely homosexual households (counted as self-reported same-sex unmarried-partner households)
Lesbian couples: 0.2% of all households
Gay men: 0.7% of all households
Household received Food Stamps/SNAP in the past 12 months: 3,303 Household did not receive Food Stamps/SNAP in the past 12 months: 9,513
Women who had a birth in the past 12 months: 420 (211 now married, 204 unmarried) Women who did not have a birth in the past 12 months: 7,349 (2,519 now married, 4,852 unmarried)
Housing units in zip code 78210 with a mortgage: 3,500 (209 second mortgage, 195 both second mortgage and home equity loan) Houses without a mortgage: 108
Median monthly owner costs for units with a mortgage: $1,296 Median monthly owner costs for units without a mortgage: $472
Residents with income below the poverty level in 2022:
This zip code:
25.2%
Whole state:
14.0%
Residents with income below 50% of the poverty level in 2022:
This zip code:
14.2%
Whole state:
7.4%
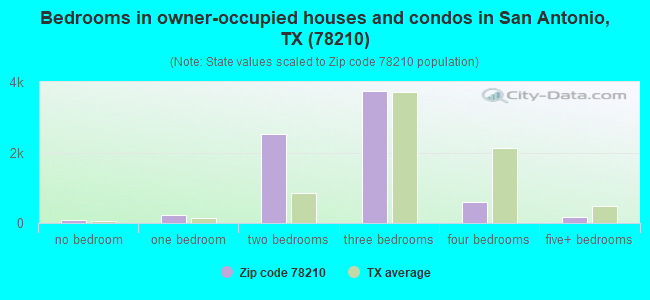
Median number of rooms in houses and condos:
Here:
5.5
State:
6.3
Median number of rooms in apartments:
Here:
4.1
State:
4.0
Notable locations in this zip code not listed on our city pages
Notable locations in zip code 78210: Riverside Golf Course (A), Blue Star Street Industrial Historic District (B), L T Wright House (C), Baptist Temple Church Day Care Center (D), Baptist Temple Church Fritz Building (E), Blessed Sacrament Academy Child Development Center (F), Our Lady of the Lake Family Life Center (G), Saint Cecilia Catholic Church Convent (H), Don Bosco Youth Center (I), San Antonio Fire Department Station 7 (J), San Antonio Fire Department Station 13 (K), San Antonio Fire Department Station 9 (L), Otto Meerscheidt House (M), San Angel Folk Art Museum (N). Display/hide their locations on the map
Churches in zip code 78210 include: Greer Street Church of God (A), Denver Heights Church of God (B), Iglesia de Cristo en Grove Avenue Church (C), Thompson Chapel Church of God in Christ (D), Saint Paul Lutheran Church (E), Holy Cross Lutheran Church (F), Highland Park Lutheran Church Devotional Message (G), Methodist Church Salamo Heights Highland Terrace (H), El Mesias United Methodist Church (I). Display/hide their locations on the map
Parks in zip code 78210 include: Herrera Park (1), South Side Lions Park (2), Denver Heights Park (3), Mission Stadium (4), Roosevelt Park (5), Concepcion Park (6), Hererra Park (7), Mission Concepcion (8), Yturri-Edmunds Historic Park (9). Display/hide their locations on the map
2,888 married couples with children.
3,036 single-parent households (576 men, 2,460 women).
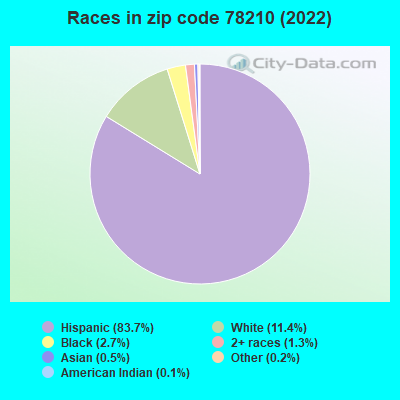
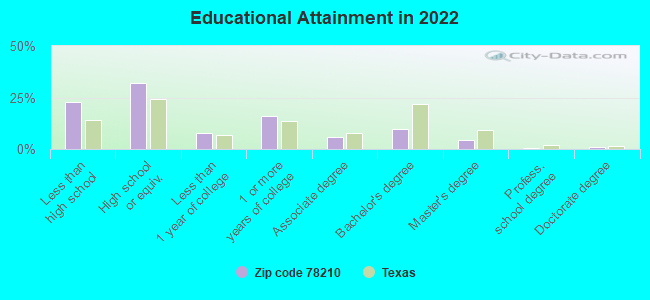
52.8% of residents of 78210 zip code speak English at home.
46.0% of residents speak Spanish at home (66% very well, 17% well, 11% not well, 6% not at all).
0.6% of residents speak other Indo-European language at home (82% very well, 18% well).
0.7% of residents speak Asian or Pacific Island language at home (31% very well, 58% well, 11% not well).
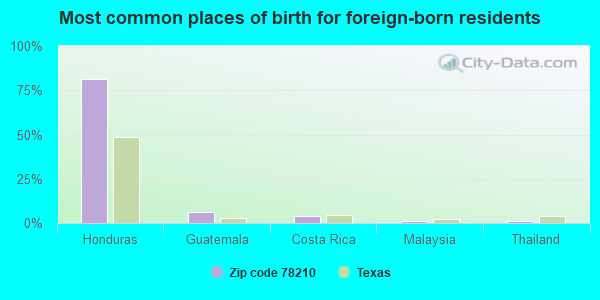
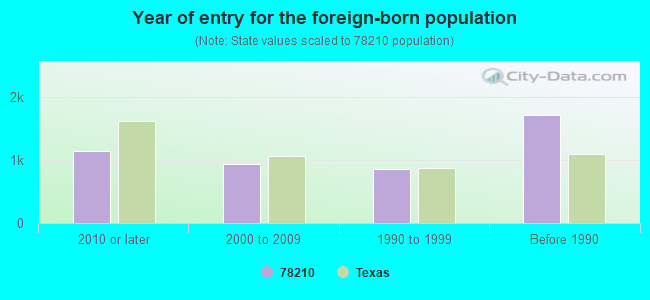
Foreign born population: 4,276 (12.5%) (40.6% of them are naturalized citizens)
Facilities with environmental interests located in this zip code:
ASTRO PLATING CO (915 ROOSEVELT in SAN ANTONIO, TX)
(Integrated Compliance Information System) - ICIS-06-1995-0088, FORMAL ENFORCEMENT ACTION Small Quantity Generators, between 100 kg and 1000 kg of hazardous waste/month (Resource Conservation and Recovery Act (tracking hazardous waste)) Business SIC and NAICS classification: ELECTROPLATING, PLATING, POLISHING, ANODIZING, AND COLORING Organizations: ASTRO PLATING INC (CONTACT/OPERATOR)
AA FOUNDRIES INC (231 VIRGINIA in SAN ANTONIO, TX)
AIR MINOR (AIRS/AFS) (Resource Conservation and Recovery Act (tracking hazardous waste)) TRI REPORTER (Tracking of toxic chemicals releasing facilities) Business SIC classification: GRAY AND DUCTILE IRON FOUNDRIES; ALUMINUM FOUNDRIES Business NAICS classification: ALUMINUM FOUNDRIES (EXCEPT DIE-CASTING).
ACADEMY OF CAREERS AND TECHNOL (807 ROOSEVELT AVE in SAN ANTONIO, TX)
(National Center for Education Statistics) - STATE ID-015816001 Organizations: ACADEMY OF CAREERS AND TECHNOLOGIE (SCHOOL DISTRICT)
AAA MACHINE METAL STAMPING & MFG CO (438 VINE ST in SAN ANTONIO, TX)
(Resource Conservation and Recovery Act (tracking hazardous waste)) Business NAICS classification: AIRCRAFT ENGINE AND ENGINE PARTS MANUFACTURING. Alternative names: AAA MCH MET STAMPING & MFG CO
AMERICAN MAIL-WELL ENVELOPE-TEXAS (232 IOWA ST in SAN ANTONIO, TX)
(Resource Conservation and Recovery Act (tracking hazardous waste))
Housing units lacking complete plumbing facilities: 3.6% Housing units lacking complete kitchen facilities: 5.3%
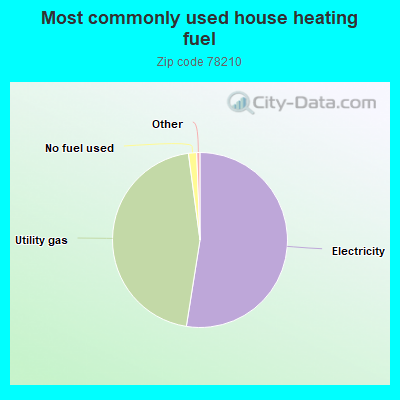
52.5%Electricity
45.4%Utility gas
1.5%No fuel used
Population in 1990: 39,300.
Place of birth for U.S.-born residents:
This state: 25,908
Northeast: 356
Midwest: 965
South: 825
West: 1,267
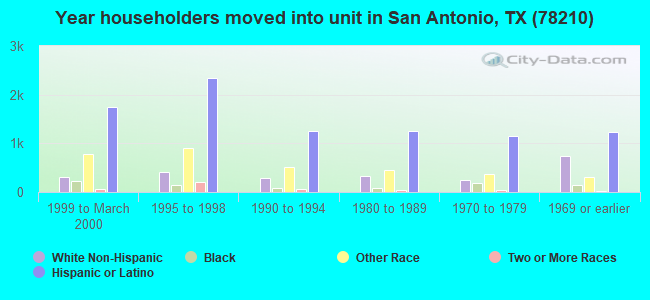
62% of the 78210 zip code residents lived in the same house 5 years ago. Out of people who lived in different houses, 86% lived in this county. Out of people who lived in different counties, 50% lived in Texas.
91% of the 78210 zip code residents lived in the same house 1 year ago. Out of people who lived in different houses, 59% moved from this county. Out of people who lived in different houses, 15% moved from different county within same state. Out of people who lived in different houses, 12% moved from different state. Out of people who lived in different houses, 15% moved from abroad.
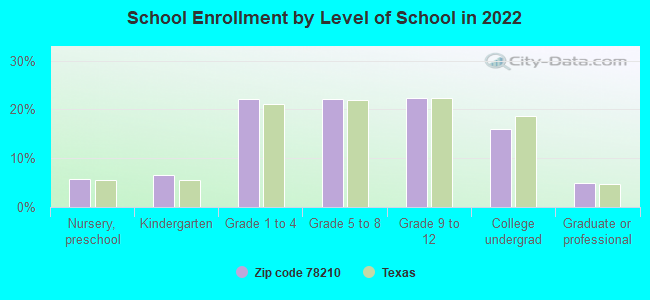
Private vs. public school enrollment:
Students in private schools in grades 1 to 8 (elementary and middle school): 413
Here:
12.2%
Texas:
8.8%
Students in private schools in grades 9 to 12 (high school): 233
Here:
13.6%
Texas:
8.0%
Students in private undergraduate colleges: 208
Here:
17.0%
Texas:
16.2%
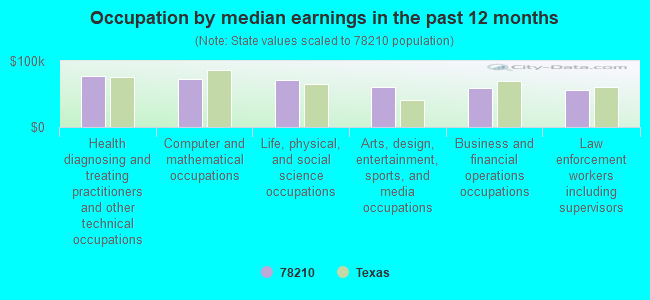
Occupation by median earnings in the past 12 months ($)
76,828Health diagnosing and treating practitioners and other technical occupations
73,230Computer and mathematical occupations
71,565Life, physical, and social science occupations
60,439Arts, design, entertainment, sports, and media occupations
59,491Business and financial operations occupations
55,892Law enforcement workers including supervisors
Companies with biggest federal contracts located in this zip code (SAN ANTONIO, TX):
TG SERVICES (538 ROOSEVELT; small business) : $9,167,288 in 12 contractsfrom 2003 to 2005
Contracts for Construction of Structures and Facilities -- Office Buildings by U.S. Army Corps of Engineers - civil program financing only, Army Signed by year:2000: $0; 2001: $0; 2002: $0; 2003: $8,998,384; 2004: $35,277; 2005: $133,627; 2006: $0.
Biggest contracts:
$4,499,192 with U.S. Army Corps of Engineers - civil program financing only for Construction of Structures and Facilities -- Office Buildings. Signed on 2003-11-13. Completion date: 2005-01-31.
$4,499,192 with Army for Construction of Structures and Facilities -- Office Buildings. Signed on 2003-11-13. Completion date: 2005-01-31.
$99,935, same as above.Signed on 2005-04-25. Completion date: 2005-01-31.
$29,742, same as above.Signed on 2005-06-14. Completion date: 2005-01-31.
SAN ANTONIO LIGHTHOUSE FOR THE (2305 ROOSEVELT AVE) : $8,598,262 in 149 contractsfrom 2000 to 2006
Contracts for Individual Equipment, Combination and Miscellaneous Instruments, Telephone and/or Communications Services (includes Telegraph, Telex, and Cablevision Services), Other Administrative Support Services, and moreby Army, Air Force, Defense Logistics Agency, Department of Veterans Affairs, and others Signed by year:2000: $757,664; 2001: $410,765; 2002: $1,051,352; 2003: $1,093,057; 2004: $2,418,807; 2005: $2,489,892; 2006: $376,725.
Biggest contracts:
$586,844 with Army for Individual Equipment. Signed on 2005-09-29. Completion date: 2005-10-30.
$507,917 with Air Force for Individual Equipment. Signed on 2004-05-14. Completion date: 2004-07-13.
$486,785 with Defense Logistics Agency for Combination and Miscellaneous Instruments. Signed on 2000-05-31. Completion date: 2000-11-27.
$393,535 with Air Force for Telephone and/or Communications Services (includes Telegraph, Telex, and Cablevision Services). Signed on 2005-10-01. Completion date: 2006-09-30.
AIR STREAM GENERAL CONSTRUCTON (1216 HOEFGEN AVE; small business) : $6,350,150 in 76 contractsfrom 1999 to 2006
Contracts for Maintenance, Repair or Alteration of Real Property -- Family Housing Facilities, Other Housekeeping Services, Maintenance, Repair or Alteration of Real Property -- Office Buildings, Maintenance, Repair and Rebuilding of Equipment -- Refrigeration, Air Conditioning, and Air Circulating Equipment, and moreby Air Force, Army Signed by year:2000: $1,709,546; 2001: $2,018,865; 2002: $763,764; 2003: -$394,345; 2004: $191,948; 2005: $135,668; 2006: $152,272.
Biggest contracts:
$1,398,036 with Air Force for Maintenance, Repair or Alteration of Real Property -- Family Housing Facilities. Signed on 1999-10-01. Completion date: 2000-09-30.
$669,032, same as above.Signed on 2000-10-02. Completion date: 2001-03-31.
$590,772, same as above.Signed on 2001-10-01. Completion date: 2002-09-30.
$453,580, same as above.Signed on 2001-05-31. Completion date: 2001-09-30.
ENVIROKLEEN (604 CAROLINA; small business) : $3,189,411 in 364 contractsfrom 2000 to 2006
Contracts for Waste Treatment and Storage, Hazardous Substance Removal, Cleanup, and Disposal Services and Operational Support, Other Medical Services by Defense Logistics Agency, Department of Veterans Affairs Signed by year:2000: $69,200; 2001: $100,290; 2002: $0; 2003: $150,116; 2004: $775,291; 2005: $1,327,478; 2006: $767,036.
Biggest contracts:
$140,188 with Defense Logistics Agency for Waste Treatment and Storage. Signed on 2005-02-24. Completion date: 2005-02-24.
$91,405, same as above.Signed on 2006-04-28. Completion date: 2006-05-08.
$87,716, same as above.Signed on 2004-10-29. Completion date: 2004-11-03.
$87,683, same as above.Signed on 2004-04-12. Completion date: 2004-04-16.
TRI-LAM COMPANY INC (538 ROOSEVELT; small business) : $688,748 in 4 contractsfrom 2003 to 2004
$649,853 with Air Force for Maintenance, Repair or Alteration of Real Property -- Miscellaneous Buildings. Signed on 2003-09-30. Completion date: 2004-04-30.
$43,236 with Air Force for Maintenance, Repair or Alteration of Real Property -- Other Administrative Facilities and Service Buildings. Signed on 2003-08-07. Completion date: 2003-11-17.
-$1,756 with Air Force for Maintenance, Repair or Alteration of Real Property -- Miscellaneous Buildings. Signed on 2004-06-28. Completion date: 2004-06-28.
-$2,585, same as above.Signed on 2004-08-30. Completion date: 2004-09-10.
A A A MACHINE METAL STAMPING & (438 VINE ST; small business) 50 employees, $0 revenue. Hist. Underutilized Business Zone (HUBZone) Firm: $666,805 in 5 contractsfrom 2001 to 2005
Contracts for Gas Turbines and Jet Engines, Aircraft; Prime Moving, and Components, Bushings, Rings, Shims, and Spacers by Defense Logistics Agency Signed by year:2000: $0; 2001: $450,376; 2002: $0; 2003: $0; 2004: $0; 2005: $216,429; 2006: $0.
Biggest contracts:
$232,179 with Defense Logistics Agency for Gas Turbines and Jet Engines, Aircraft; Prime Moving, and Components. Signed on 2001-11-22. Completion date: 2002-02-28.
$218,197, same as above.Signed on 2001-01-26. Completion date: 2001-11-22.
$97,902, same as above.Signed on 2005-07-05. Completion date: 2005-11-12.
$96,324, same as above.Signed on 2005-08-30. Completion date: 2006-05-12.
BEXAR, COUNTY OF (227 W DREXEL AVE)
$236,567 with Department of Defense for Other Housekeeping Services. Signed on 2000-01-03. Completion date: 2001-01-31.
MISSION PHARMACAL COMPANY (1325 E DURANGO BLVD; small business) : $90,930 in 26 contractsfrom 2002 to 2006
Contracts for In Vitro Diagnostic Substances, Reagents, Test Kits, and Sets, Laboratory Testing Services, Other Medical Services, Chemical Analysis Instruments, and moreby Navy, Army, Air Force, Department of Veterans Affairs, and others Signed by year:2000: $0; 2001: $0; 2002: $8,805; 2003: $19,550; 2004: $31,110; 2005: $9,221; 2006: $22,244.
Biggest contracts:
$21,760 with Navy for In Vitro Diagnostic Substances, Reagents, Test Kits, and Sets. Taking place in VA. Signed on 2006-02-07. Completion date: 2006-09-30.
$12,750 with Navy for Laboratory Testing Services. Signed on 2004-09-15. Completion date: 2004-09-30.
$12,750, same as above.Signed on 2003-09-04. Completion date: 2004-09-30.
$10,200, same as above.Signed on 2004-10-01. Completion date: 2005-09-30.
REDDY ICE CORPORATION (1106 E DURANGO BLVD; small business) : $58,505 in 19 contractsfrom 2001 to 2006
Contracts for Food Services, Condiments and Related Products, Miscellaneous Items, Food Items For Resale by Army Signed by year:2000: $0; 2001: -$44,527; 2002: $49,500; 2003: $47,276; 2004: $17,608; 2005: -$29,921; 2006: $18,569.
Biggest contracts:
$57,000 with Army for Food Services. Signed on 2004-11-03. Completion date: 2005-09-30.
$54,000, same as above.Signed on 2003-10-17. Completion date: 2003-09-30.
$49,500, same as above.Signed on 2002-12-04. Completion date: 2003-09-30.
$24,521 with Army for Condiments and Related Products. Signed on 2006-01-23. Completion date: 2006-09-30.
ZAHL MANUFACTURING (327 DENVER; small business)
$47,855 with Defense Logistics Agency for Fittings for Rope, Cable, and Chain. Signed on 2000-05-19. Completion date: 2000-09-16.
Top industries in this zip code by the number of employees in 2005:
2002 - 2018 National Fire Incident Reporting System (NFIRS) incidents
Based on the data from the years 2002 - 2018 the average number of fire incidents per year is 121. The highest number of fires - 182 took place in 2002, and the least - 0 in 2008. The data has a declining trend.
When looking into fire subcategories, the most reports belonged to: Outside Fires (43.8%), and Mobile Property/Vehicle Fires (20.6%).
Fire incident types reported to NFIRS in Zip Code 78210

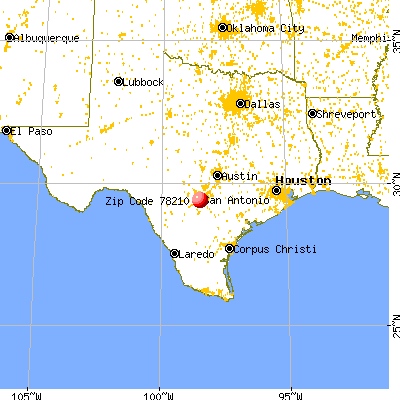


 Nearest zip codes: 78203, 78202, 78205, 78204, 78208, 78215.
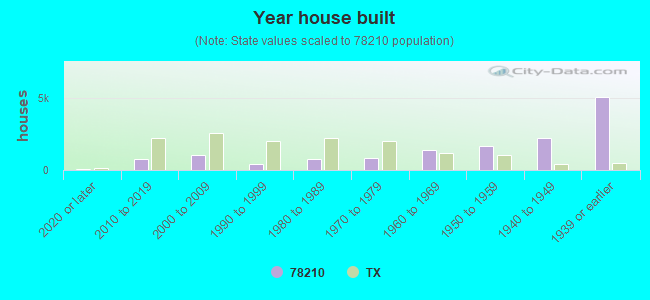


 Based on the data from the years 2002 - 2018 the average number of fire incidents per year is 121. The highest number of fires - 182 took place in 2002, and the least - 0 in 2008. The data has a declining trend.
 When looking into fire subcategories, the most reports belonged to: Outside Fires (43.8%), and Mobile Property/Vehicle Fires (20.6%).