Estimated zip code population in 2022: 59,078 Zip code population in 2010: 51,111 Zip code population in 2000: 44,281
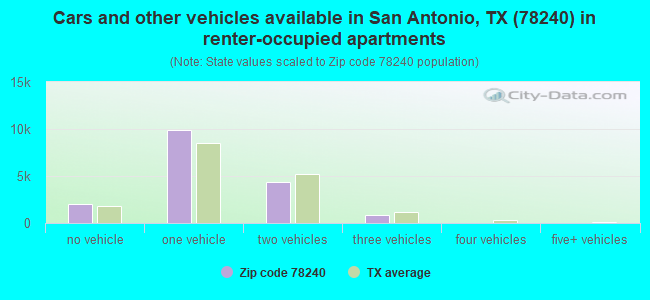
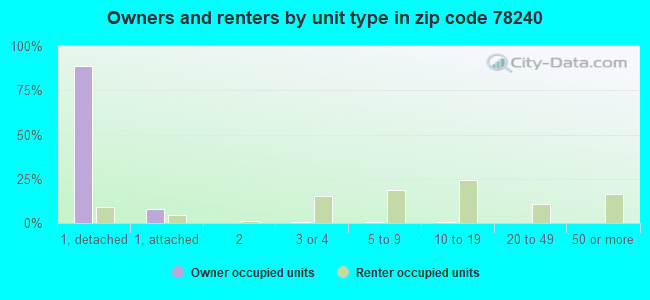
Houses and condos: 28,424 Renter-occupied apartments: 17,082
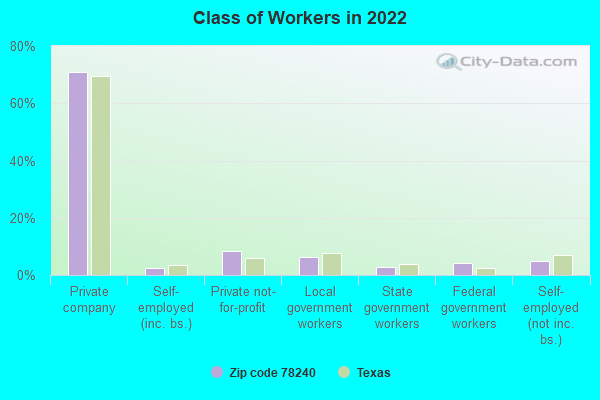
% of renters here:
66%
State:
38%
March 2022 cost of living index in zip code 78240: 88.6 (less than average, U.S. average is 100)
Land area: 11.3 sq. mi. Water area: 0.0 sq. mi.
Population density: 5,221 people per square mile
(average).
OSM Map
General Map
Google Map
MSN Map
OSM Map
General Map
Google Map
MSN Map
OSM Map
General Map
Google Map
MSN Map
OSM Map
General Map
Google Map
MSN Map
Please wait while loading the map...
Real estate property taxes paid for housing units in 2022:
This zip code:
1.8% ($4,650)
Texas:
1.5% ($4,050)
Median real estate property taxes paid for housing units with mortgages in 2022: $4,976 (1.8%) Median real estate property taxes paid for housing units with no mortgage in 2022: $4,168 (1.7%)
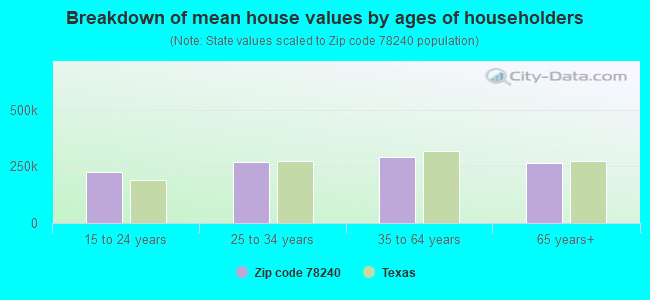
Estimated median house/condo value in 2022: $264,754
78240:
$264,754
Texas:
$275,400
According to our research of Texas and other state lists, there were 48 registered sex offenders living in 78240 zip code as of April 27, 2024. The ratio of all residents to sex offenders in zip code 78240 is 1,232 to 1. The ratio of registered sex offenders to all residents in this zip code is much lower than the state average.
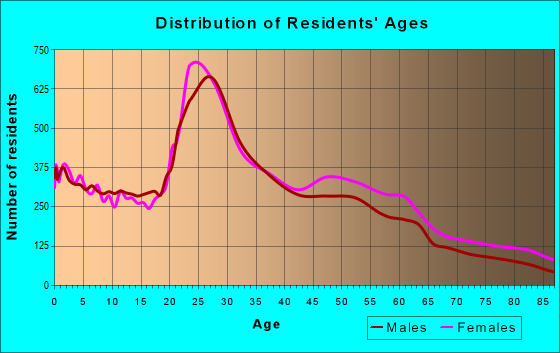
Median resident age:
This zip code:
32.3 years
Texas median age:
35.6 years
Average household size:
This zip code:
2.2 people
Texas:
2.6 people
Averages for the 2020 tax year for zip code 78240, filed in 2021:
Average Adjusted Gross Income (AGI) in 2020: $54,021 (Individual Income Tax Returns)
Here:
$54,021
State:
$77,054
Salary/wage: $48,638 (reported on 84.7% of returns)
Here:
$48,638
State:
$62,766
(% of AGI for various income ranges: 1179.0% for AGIs below $25k, 3541.2% for AGIs $25k-50k, 6258.6% for AGIs $50k-75k, 9379.5% for AGIs $75k-100k, 17112.9% for AGIs $100k-200k, 53283.0% for AGIs over 200k)
Taxable interest for individuals: $1,316 (reported on 20.4% of returns)
This zip code:
$1,316
Texas:
$2,665
(% of AGI for various income ranges: 10.1% for AGIs below $25k, 10.8% for AGIs $25k-50k, 29.5% for AGIs $50k-75k, 52.4% for AGIs $75k-100k, 110.7% for AGIs $100k-200k, 937.0% for AGIs over 200k)
Ordinary dividends: $3,635 (reported on 12.0% of returns)
Here:
$3,635
State:
$10,044
(% of AGI for various income ranges: 10.1% for AGIs below $25k, 10.9% for AGIs $25k-50k, 36.5% for AGIs $50k-75k, 90.0% for AGIs $75k-100k, 180.5% for AGIs $100k-200k, 2136.5% for AGIs over 200k)
Net capital gain/loss in AGI: +$10,428 (reported on 11.9% of returns)
Here:
+$10,428
State:
+$39,590
(% of AGI for various income ranges: 5.5% for AGIs below $25k, 14.9% for AGIs $25k-50k, 40.1% for AGIs $50k-75k, 109.1% for AGIs $75k-100k, 425.6% for AGIs $100k-200k, 10708.0% for AGIs over 200k)
Profit/loss from business: +$6,986 (reported on 14.9% of returns)
Here:
+$6,986
State:
+$10,888
(% of AGI for various income ranges: 79.2% for AGIs below $25k, 64.4% for AGIs $25k-50k, 103.5% for AGIs $50k-75k, 177.0% for AGIs $75k-100k, 380.1% for AGIs $100k-200k, 2242.5% for AGIs over 200k)
Taxable individual retirement arrangement distribution: $17,979 (reported on 5.6% of returns)
78240:
$17,979
Texas:
$24,740
(% of AGI for various income ranges: 30.3% for AGIs below $25k, 37.7% for AGIs $25k-50k, 110.9% for AGIs $50k-75k, 189.6% for AGIs $75k-100k, 470.5% for AGIs $100k-200k, 3385.5% for AGIs over 200k)
Self-employed (Keogh) retirement plans: $15,375 (reported on 0.1% of returns)
78240:
$15,375
Texas:
$29,298
(% of AGI for various income ranges: 35.3% for AGIs $100k-200k)
Total itemized deductions: $31,385 (reported on 4.3% of returns)
Here:
$31,385
State:
$40,428
(% of AGI for various income ranges: 32.9% for AGIs below $25k, 56.0% for AGIs $25k-50k, 194.2% for AGIs $50k-75k, 272.7% for AGIs $75k-100k, 527.4% for AGIs $100k-200k, 4708.0% for AGIs over 200k)
Charity contributions: $12,682 (reported on 3.1% of returns)
Here:
$12,682
State:
$18,201
(% of AGI for various income ranges: 2.7% for AGIs below $25k, 9.7% for AGIs $25k-50k, 33.5% for AGIs $50k-75k, 58.7% for AGIs $75k-100k, 162.1% for AGIs $100k-200k, 2446.0% for AGIs over 200k)
Taxes paid: $6,471 (reported on 4.1% of returns)
78240:
$6,471
State:
$7,821
(% of AGI for various income ranges: 5.7% for AGIs below $25k, 9.4% for AGIs $25k-50k, 45.0% for AGIs $50k-75k, 67.9% for AGIs $75k-100k, 124.9% for AGIs $100k-200k, 555.0% for AGIs over 200k)
Earned income credit: $2,277 (reported on 18.3% of returns)
Here:
$2,277
State:
$2,584
(% of AGI for various income ranges: 98.2% for AGIs below $25k, 60.2% for AGIs $25k-50k, 0.8% for AGIs $50k-75k)
Percentage of individuals using paid preparers for their 2020 taxes: 92.6%
Here:
93%
State:
92%
(% for various income ranges: 92.4% for AGIs below $25k, 94.2% for AGIs $25k-50k, 92.0% for AGIs $50k-75k, 90.7% for AGIs $75k-100k, 91.6% for AGIs $100k-200k, 90.2% for AGIs over 200k)
Averages for the 2012 tax year for zip code 78240, filed in 2013:
Average Adjusted Gross Income (AGI) in 2012: $46,294 (Individual Income Tax Returns)
Here:
$46,294
State:
$65,384
Salary/wage: $42,284 (reported on 87.5% of returns)
Here:
$42,284
State:
$52,524
(% of AGI for various income ranges: 83.8% for AGIs below $25k, 86.8% for AGIs $25k-50k, 82.8% for AGIs $50k-75k, 79.4% for AGIs $75k-100k, 80.0% for AGIs $100k-200k, 54.0% for AGIs over 200k)
Taxable interest for individuals: $1,440 (reported on 23.3% of returns)
This zip code:
$1,440
Texas:
$2,372
(% of AGI for various income ranges: 0.7% for AGIs below $25k, 0.4% for AGIs $25k-50k, 0.5% for AGIs $50k-75k, 0.6% for AGIs $75k-100k, 0.7% for AGIs $100k-200k, 2.3% for AGIs over 200k)
Ordinary dividends: $4,164 (reported on 11.4% of returns)
Here:
$4,164
State:
$9,721
(% of AGI for various income ranges: 0.8% for AGIs below $25k, 0.4% for AGIs $25k-50k, 0.6% for AGIs $50k-75k, 0.7% for AGIs $75k-100k, 0.8% for AGIs $100k-200k, 4.5% for AGIs over 200k)
Net capital gain/loss in AGI: +$6,379 (reported on 9.2% of returns)
Here:
+$6,379
State:
+$35,319
(% of AGI for various income ranges: 0.2% for AGIs $50k-75k, 0.4% for AGIs $75k-100k, 0.6% for AGIs $100k-200k, 10.9% for AGIs over 200k)
Profit/loss from business: +$9,009 (reported on 12.3% of returns)
Here:
+$9,009
State:
+$13,732
(% of AGI for various income ranges: 5.9% for AGIs below $25k, 1.6% for AGIs $25k-50k, 1.7% for AGIs $50k-75k, 1.0% for AGIs $75k-100k, 2.2% for AGIs $100k-200k, 4.4% for AGIs over 200k)
Taxable individual retirement arrangement distribution: $11,339 (reported on 6.3% of returns)
78240:
$11,339
Texas:
$19,511
(% of AGI for various income ranges: 1.5% for AGIs below $25k, 1.1% for AGIs $25k-50k, 1.3% for AGIs $50k-75k, 1.7% for AGIs $75k-100k, 2.1% for AGIs $100k-200k, 1.6% for AGIs over 200k)
Self-employment retirement plans: $13,300 (reported on 0.2% of returns)
78240:
$13,300
Texas:
$23,938
Total itemized deductions: $17,144 (20% of AGI, reported on 20.4% of returns)
Here:
$17,144
State:
$24,724
Here:
20.2% of AGI
State:
15.9% of AGI
(% of AGI for various income ranges: 5.1% for AGIs below $25k, 6.6% for AGIs $25k-50k, 8.5% for AGIs $50k-75k, 8.4% for AGIs $75k-100k, 8.7% for AGIs $100k-200k, 6.6% for AGIs over 200k)
Charity contributions: $3,526 (reported on 15.3% of returns)
Here:
$3,526
State:
$6,808
(% of AGI for various income ranges: 0.4% for AGIs below $25k, 0.7% for AGIs $25k-50k, 1.0% for AGIs $50k-75k, 1.4% for AGIs $75k-100k, 1.8% for AGIs $100k-200k, 1.7% for AGIs over 200k)
Taxes paid: $5,050 (reported on 19.9% of returns)
78240:
$5,050
State:
$6,921
(% of AGI for various income ranges: 1.0% for AGIs below $25k, 1.7% for AGIs $25k-50k, 2.2% for AGIs $50k-75k, 2.4% for AGIs $75k-100k, 2.9% for AGIs $100k-200k, 2.4% for AGIs over 200k)
Earned income credit: $2,160 (reported on 18.8% of returns)
Here:
$2,160
State:
$2,570
(% of AGI for various income ranges: 5.9% for AGIs below $25k, 1.0% for AGIs $25k-50k)
Percentage of individuals using paid preparers for their 2012 taxes: 37.7%
Here:
38%
State:
51%
(% for various income ranges: 36.4% for AGIs below $25k, 35.1% for AGIs $25k-50k, 38.2% for AGIs $50k-75k, 41.1% for AGIs $75k-100k, 44.6% for AGIs $100k-200k, 70.0% for AGIs over 200k)
Averages for the 2004 tax year for zip code 78240, filed in 2005:
Average Adjusted Gross Income (AGI) in 2004: $39,052 (Individual Income Tax Returns)
Here:
$39,052
State:
$47,881
Salary/wage: $36,290 (reported on 87.9% of returns)
Here:
$36,290
State:
$41,947
(% of AGI for various income ranges: 155.1% for AGIs below $10k, 85.6% for AGIs $10k-25k, 85.0% for AGIs $25k-50k, 81.3% for AGIs $50k-75k, 81.0% for AGIs $75k-100k, 73.0% for AGIs over 100k)
Taxable interest for individuals: $1,444 (reported on 33.4% of returns)
This zip code:
$1,444
Texas:
$2,255
(% of AGI for various income ranges: 5.4% for AGIs below $10k, 1.2% for AGIs $10k-25k, 1.0% for AGIs $25k-50k, 1.2% for AGIs $50k-75k, 0.9% for AGIs $75k-100k, 1.4% for AGIs over 100k)
Taxable dividends: $1,986 (reported on 16.2% of returns)
Here:
$1,986
State:
$4,261
(% of AGI for various income ranges: 2.6% for AGIs below $10k, 0.7% for AGIs $10k-25k, 0.6% for AGIs $25k-50k, 0.6% for AGIs $50k-75k, 0.6% for AGIs $75k-100k, 1.3% for AGIs over 100k)
Net capital gain/loss: +$3,696 (reported on 13.1% of returns)
Here:
+$3,696
State:
+$16,110
(% of AGI for various income ranges: -1.6% for AGIs below $10k, 0.1% for AGIs $10k-25k, 0.2% for AGIs $25k-50k, 0.6% for AGIs $50k-75k, 0.9% for AGIs $75k-100k, 3.8% for AGIs over 100k)
Profit/loss from business: +$8,288 (reported on 12.1% of returns)
Here:
+$8,288
State:
+$11,013
(% of AGI for various income ranges: -0.8% for AGIs below $10k, 3.7% for AGIs $10k-25k, 1.7% for AGIs $25k-50k, 2.0% for AGIs $50k-75k, 1.8% for AGIs $75k-100k, 4.1% for AGIs over 100k)
IRA payment deduction: $2,746 (reported on 2.1% of returns)
78240:
$2,746
Texas:
$3,120
(% of AGI for various income ranges: 0.2% for AGIs below $10k, 0.1% for AGIs $10k-25k, 0.2% for AGIs $25k-50k, 0.2% for AGIs $50k-75k, 0.1% for AGIs $75k-100k, 0.1% for AGIs over 100k)
Self-employed pension: $10,930 (reported on 0.4% of returns)
Here:
$10,930
Texas:
$16,401
Total itemized deductions: $14,936 (20% of AGI, reported on 24.6% of returns)
Here:
$14,936
State:
$19,631
Here:
20.5% of AGI
State:
18.9% of AGI
(% of AGI for various income ranges: 9.5% for AGIs below $10k, 5.1% for AGIs $10k-25k, 8.8% for AGIs $25k-50k, 11.1% for AGIs $50k-75k, 11.3% for AGIs $75k-100k, 9.5% for AGIs over 100k)
Charity contributions deductions: $3,200 (4% of AGI, reported on 20.5% of returns)
Here:
$3,200
State:
$4,753
Here:
4.1% of AGI
State:
4.2% of AGI
(% of AGI for various income ranges: 0.7% for AGIs below $10k, 0.5% for AGIs $10k-25k, 1.0% for AGIs $25k-50k, 1.6% for AGIs $50k-75k, 2.1% for AGIs $75k-100k, 2.8% for AGIs over 100k)
Total tax: $5,700 (reported on 74.6% of returns)
78240:
$5,700
State:
$9,058
(% of AGI for various income ranges: 3.3% for AGIs below $10k, 4.1% for AGIs $10k-25k, 7.4% for AGIs $25k-50k, 9.9% for AGIs $50k-75k, 11.4% for AGIs $75k-100k, 18.9% for AGIs over 100k)
Earned income credit: $1,709 (reported on 16.8% of returns)
Here:
$1,709
State:
$2,024
Percentage of individuals using paid preparers for their 2004 taxes: 44.7%
Here:
45%
State:
57%
(% for various income ranges: 39.5% for AGIs below $10k, 49.9% for AGIs $10k-25k, 43.0% for AGIs $25k-50k, 44.2% for AGIs $50k-75k, 42.3% for AGIs $75k-100k, 49.5% for AGIs over 100k)
Likely homosexual households (counted as self-reported same-sex unmarried-partner households)
Lesbian couples: 0.0% of all households
Gay men: 0.1% of all households
Household received Food Stamps/SNAP in the past 12 months: 3,540 Household did not receive Food Stamps/SNAP in the past 12 months: 22,533
Women who had a birth in the past 12 months: 882 (563 now married, 316 unmarried) Women who did not have a birth in the past 12 months: 14,227 (5,018 now married, 9,248 unmarried)
Housing units in zip code 78240 with a mortgage: 5,652 (362 second mortgage, 290 both second mortgage and home equity loan) Houses without a mortgage: 134
Median monthly owner costs for units with a mortgage: $1,694 Median monthly owner costs for units without a mortgage: $677
Residents with income below the poverty level in 2022:
This zip code:
15.2%
Whole state:
14.0%
Residents with income below 50% of the poverty level in 2022:
This zip code:
6.2%
Whole state:
7.4%
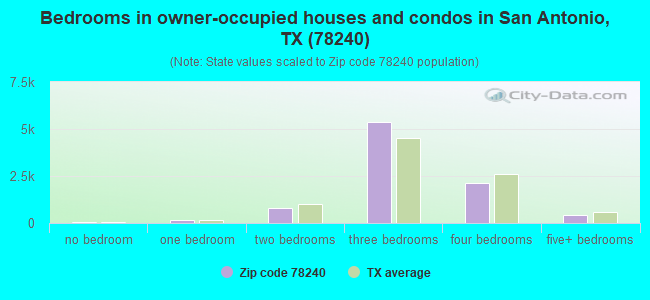
Median number of rooms in houses and condos:
Here:
6.2
State:
6.3
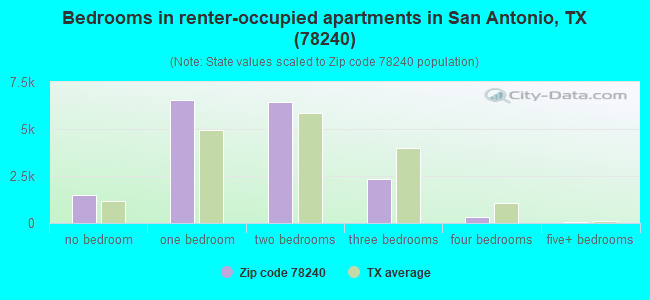
Median number of rooms in apartments:
Here:
3.6
State:
4.0
Notable locations in this zip code not listed on our city pages
Notable locations in zip code 78240: Buttons-N-Bows Learning Center and Child Care Center (A), Childtime Learning Centers (B), Little Red Caboose School Northwest (C), Methodist Mission Home (D), San Antonio Fire Department Station 42 (E), X-Tra Mile Ambulance Service (F), Southwest Emergency Medical Services - HMKC Enterprise (G). Display/hide their locations on the map
Churches in zip code 78240 include: Saint Francis Church (A), United Methodist Church Oxford (B), Trinity United Methodist Church (C), San Antonio Chinese Methodist Church (D), Bandera Road Community Church (E), Sheep Gate Fellowship Church (F), Chinese Baptist Church (G), Lamb of Glory Assembly of God Church (H), Marshall Baptist Church (I). Display/hide their locations on the map
7,658 married couples with children.
4,051 single-parent households (1,275 men, 2,776 women).
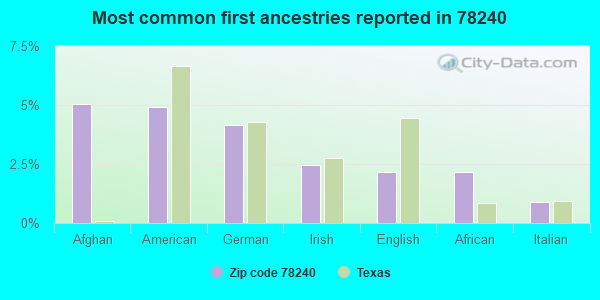
62.0% of residents of 78240 zip code speak English at home.
27.3% of residents speak Spanish at home (83% very well, 11% well, 5% not well, 1% not at all).
4.3% of residents speak other Indo-European language at home (50% very well, 19% well, 28% not well, 3% not at all).
5.2% of residents speak Asian or Pacific Island language at home (70% very well, 19% well, 5% not well, 6% not at all).
1.6% of residents speak other language at home (61% very well, 25% well, 8% not well, 5% not at all).
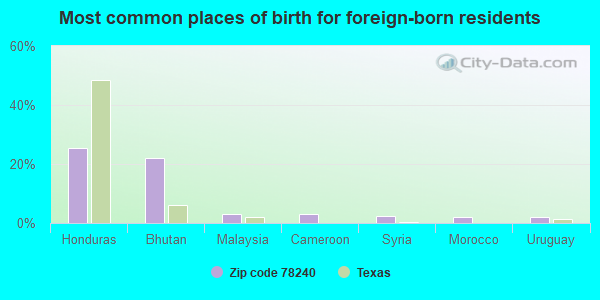
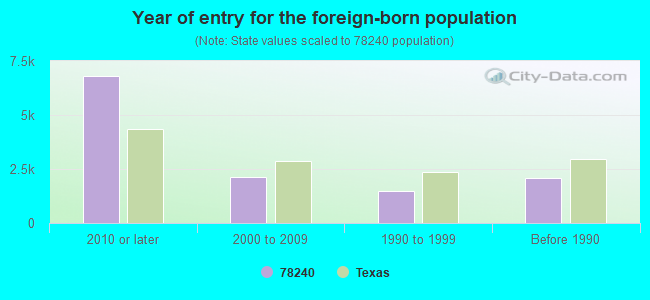
Foreign born population: 10,275 (17.4%) (39.6% of them are naturalized citizens)
Facilities with environmental interests located in this zip code:
BABCOCK PAINT & BODY (5631 BABCOCK RD in SAN ANTONIO, TX)
(Resource Conservation and Recovery Act (tracking hazardous waste))
Housing units lacking complete plumbing facilities: 0.8% Housing units lacking complete kitchen facilities: 1.9%
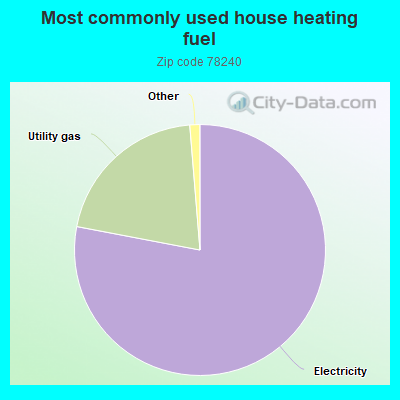
78.0%Electricity
20.7%Utility gas
Population in 1990: 33,776. Population change in the 1990s: +10,505 (+31.1%).
Place of birth for U.S.-born residents:
This state: 33,216
Northeast: 2,043
Midwest: 3,757
South: 4,151
West: 4,052
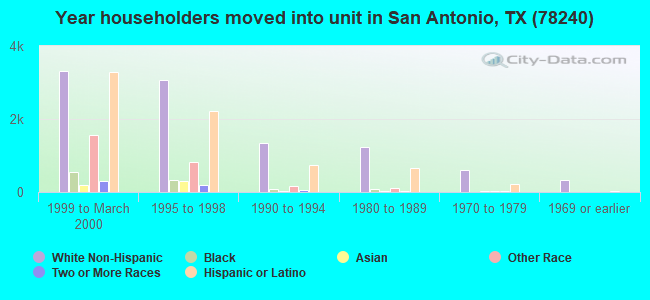
36% of the 78240 zip code residents lived in the same house 5 years ago. Out of people who lived in different houses, 60% lived in this county. Out of people who lived in different counties, 50% lived in Texas.
77% of the 78240 zip code residents lived in the same house 1 year ago. Out of people who lived in different houses, 62% moved from this county. Out of people who lived in different houses, 11% moved from different county within same state. Out of people who lived in different houses, 14% moved from different state. Out of people who lived in different houses, 10% moved from abroad.
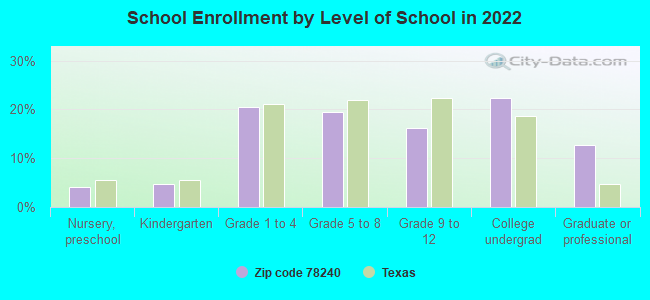
Private vs. public school enrollment:
Students in private schools in grades 1 to 8 (elementary and middle school): 993
Here:
16.5%
Texas:
8.8%
Students in private schools in grades 9 to 12 (high school): 483
Here:
19.8%
Texas:
8.0%
Students in private undergraduate colleges: 489
Here:
14.6%
Texas:
16.2%
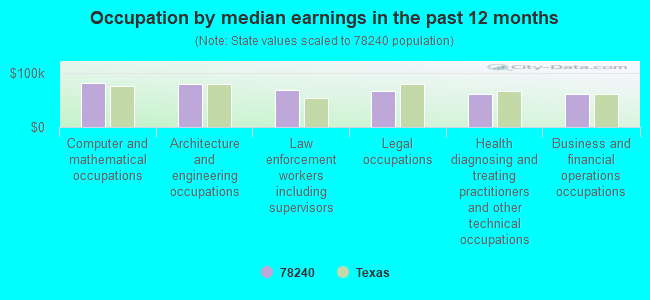
Occupation by median earnings in the past 12 months ($)
81,517Computer and mathematical occupations
79,444Architecture and engineering occupations
67,970Law enforcement workers including supervisors
65,853Legal occupations
61,311Health diagnosing and treating practitioners and other technical occupations
60,411Business and financial operations occupations
Companies with biggest federal contracts located in this zip code (SAN ANTONIO, TX):
MCGOLDRICK CONSTRUCTION SERVIC (8632 FREDERICKSBURG ROAD,; small business) : $37,267,031 in 158 contractsfrom 1999 to 2006
Contracts for Construction of Structures and Facilities -- Open Storage Facilities, Construction of Structures and Facilities -- Miscellaneous Buildings, Construction of Structures and Facilities -- Other Airfield Structures, Maintenance, Repair or Alteration of Real Property -- Other Administrative Facilities and Service Buildings, and moreby Army, Air Force, Navy Signed by year:2000: $6,237,778; 2001: $11,016,436; 2002: $556,572; 2003: $9,552,287; 2004: $191,157; 2005: $335,537; 2006: $9,332,258.
Biggest contracts:
$9,969,000 with Army for Construction of Structures and Facilities -- Open Storage Facilities. Signed on 2001-03-09. Completion date: 2002-08-13.
$9,557,000 with Army for Construction of Structures and Facilities -- Miscellaneous Buildings. Signed on 2003-12-11. Completion date: 2004-12-11.
$9,270,000, same as above.Signed on 2006-03-30. Completion date: 2007-09-28.
$4,839,246 with Army for Construction of Structures and Facilities -- Other Airfield Structures. Signed on 2000-09-26. Completion date: 2001-11-01.
SAS SUPPORT, LTD (4919-A GOLDEN QUAIL; small business) : $29,823,652 in 17 contractsfrom 2003 to 2004
Contracts for In Vitro Diagnostic Substances, Reagents, Test Kits, and Sets by Army Signed by year:2000: $0; 2001: $0; 2002: $0; 2003: $24,496,661; 2004: $5,326,991; 2005: $0; 2006: $0.
Biggest contracts:
$15,014,999 with Army for In Vitro Diagnostic Substances, Reagents, Test Kits, and Sets. Signed on 2003-12-09. Completion date: 2004-03-31.
$5,542,616, same as above.Signed on 2003-09-18. Completion date: 2003-12-31.
$2,686,191, same as above.Signed on 2004-04-13. Completion date: 2004-08-02.
$2,272,395, same as above.Signed on 2004-06-30. Completion date: 2004-09-30.
THE OMO GROUP, INC (8627 CINNAMON CREEK DRIVE; small business) : $25,922,858 in 286 contractsfrom 1999 to 2006
Contracts for Word Processing/Typing Services, Dentistry Services, Radiology Services, Pharmacology Services, and moreby Department of Veterans Affairs, Navy, Army, Air Force, and others Signed by year:2000: $3,900,997; 2001: $3,528,459; 2002: $4,729,843; 2003: $4,158,632; 2004: $3,664,376; 2005: $2,915,993; 2006: $2,364,300.
Biggest contracts:
$758,938 with Department of Veterans Affairs for Word Processing/Typing Services. Signed on 2004-10-01. Completion date: 2005-08-31.
$750,256 with Navy for Dentistry Services. Taking place in CA. Signed on 2000-10-01. Completion date: 2001-09-30.
$746,346 with Army for Radiology Services. Taking place in DC. Signed on 2005-03-06. Completion date: 2005-09-30.
$737,672 with Army for Pharmacology Services. Taking place in VA. Signed on 2002-11-15. Completion date: 2003-09-30.
S A SCIENTIFIC, INC (4919 GOLDEN QUAIL; small business) : $22,939,259 in 23 contractsfrom 2003 to 2006
Contracts for In Vitro Diagnostic Substances, Reagents, Test Kits, and Sets by Army Signed by year:2000: $0; 2001: $0; 2002: $0; 2003: $10,682,000; 2004: $3,864,933; 2005: $7,198,587; 2006: $1,193,739.
Biggest contracts:
$8,000,000 with Army for In Vitro Diagnostic Substances, Reagents, Test Kits, and Sets. Signed on 2005-08-30. Completion date: 2005-09-16.
$5,252,500, same as above.Signed on 2003-02-14. Completion date: 2003-08-13.
$3,204,185, same as above.Signed on 2005-09-30. Completion date: 2006-10-31.
$3,009,000, same as above.Signed on 2003-05-14. Completion date: 2003-10-01.
IAABO-ALAMO BOARD NO 2 (10314 COUNTRY SWAN; small business) : $385,611 in 28 contractsfrom 1999 to 2005
Contracts for Recreational Services, Other Social Services, Other Professional Services, Social Rehabilitation Services by Army Signed by year:2000: $36,265; 2001: $159,217; 2002: $59,090; 2003: $35,604; 2004: $30,278; 2005: $12,397; 2006: $0.
Biggest contracts:
$69,732 with Army for Recreational Services. Signed on 2001-12-11. Completion date: 2002-09-30.
$53,220, same as above.Signed on 2001-09-13. Completion date: 2002-09-30.
$52,760 with Army for Other Social Services. Signed on 1999-12-31. Completion date: 2000-12-31.
$38,000 with Army for Other Professional Services. Signed on 2003-10-20. Completion date: 2004-09-30.
EDUCATIONAL CONSULTANTS (7627 LYNN ANN; small business) : $371,825 in 6 contractsfrom 2003 to 2006
Contracts for Education Services by Army Signed by year:2000: $0; 2001: $0; 2002: $0; 2003: $140,000; 2004: $105,000; 2005: $126,075; 2006: $750.
Biggest contracts:
$126,075 with Army for Education Services. Signed on 2005-10-28. Completion date: 2005-09-30.
$123,000, same as above.Signed on 2004-12-02. Completion date: 2005-09-30.
$120,000, same as above.Signed on 2003-11-18. Completion date: 2003-09-30.
$20,000, same as above.Signed on 2003-08-01. Completion date: 2003-09-30.
HIS INDUSTRIES INC (4868 RESEARCH DR; small business) : $72,119 in 4 contractsfrom 2004 to 2006
$29,221 with Air Force for ADP Software, Equipment, and Telecommunications Training. Taking place in LA. Signed on 2006-07-12. Completion date: 2006-07-31.
$17,802 with Army for ADP Support Equipment. Taking place in AZ. Signed on 2005-08-22. Completion date: 2005-09-28.
$17,766 with Army for Video Recording and Reproducing Equipment. Signed on 2004-12-08. Completion date: 2004-12-27.
$7,330 with Air Force for Photographic Projection Equipment. Signed on 2005-08-19. Completion date: 2005-09-23.
TISSUE TRANSPLANT TECHNOLOGY L (4808 RESEARCH DR; small business) : $70,994 in 18 contractsfrom 2003 to 2006
Contracts for Medical and Surgical Instruments, Equipment, and Supplies, Blood Derivatives, Maintenance, Repair and Rebuilding of Equipment -- Medical, Dental, and Veterinary Equipment and Supplies by Army, Navy, Department of Veterans Affairs Signed by year:2000: $0; 2001: $0; 2002: $0; 2003: -$12,310; 2004: $32,750; 2005: $28,437; 2006: $22,117.
Biggest contracts:
$29,050 with Army for Medical and Surgical Instruments, Equipment, and Supplies. Signed on 2004-10-19. Completion date: 2004-10-21.
$8,500 with Navy for Medical and Surgical Instruments, Equipment, and Supplies. Taking place in VA. Signed on 2006-05-15. Completion date: 2006-05-16.
$8,300 with Army for Blood Derivatives. Signed on 2005-11-12. Completion date: 2005-10-25.
$6,200, same as above.Signed on 2005-11-04. Completion date: 2005-10-06.
KUMAR, PRAMOD (7730 APPLE GREEN; small business)
$41,250 with Army for Scientific and Management Education. Signed on 2004-04-27. Completion date: 2005-04-30.
GENCON CONSTRUCTION SERVICES, (10501 HUEBNER ROAD SUITE 4; small business) : $40,606 in 5 contractsfrom 2000 to 2001
Contracts for Maintenance, Repair or Alteration of Real Property -- Other Administrative Facilities and Service Buildings, Maintenance, Repair or Alteration of Real Property -- Restoration of real property, Construction of Structures and Facilities -- Restoration of real property by Army Signed by year:2000: $40,362; 2001: $244; 2002: $0; 2003: $0; 2004: $0; 2005: $0; 2006: $0.
Biggest contracts:
$13,055 with Army for Maintenance, Repair or Alteration of Real Property -- Other Administrative Facilities and Service Buildings. Signed on 2000-09-26. Completion date: 2000-11-15.
$12,950 with Army for Maintenance, Repair or Alteration of Real Property -- Restoration of real property. Signed on 2000-07-28. Completion date: 2000-07-28.
$10,441 with Army for Construction of Structures and Facilities -- Restoration of real property. Signed on 2000-02-02. Completion date: 1999-11-01.
$3,916 with Army for Maintenance, Repair or Alteration of Real Property -- Other Administrative Facilities and Service Buildings. Signed on 2000-09-27. Completion date: 2000-12-29.
Top industries in this zip code by the number of employees in 2005:
Health Care and Social Assistance: Home Health Care Services (over 1000 employees: 1 establishment, 100-249 employees: 1 establishment, 10-19 employees: 1 establishment, 1-4 employees: 1 establishment)
Health Care and Social Assistance: Offices of Physicians (except Mental Health Specialists) (100-249: 1, 50-99: 2, 20-49: 4, 10-19: 8, 5-9: 7, 1-4: 27)
2002 - 2018 National Fire Incident Reporting System (NFIRS) incidents
Based on the data from the years 2002 - 2018 the average number of fires per year is 82. The highest number of reported fire incidents - 124 took place in 2005, and the least - 8 in 2008. The data has a declining trend.
When looking into fire subcategories, the most reports belonged to: Outside Fires (40.0%), and Structure Fires (23.3%).
Fire incident types reported to NFIRS in Zip Code 78240


 Nearest zip codes: 78249, 78229, 78230, 78238, 78250, 78228.
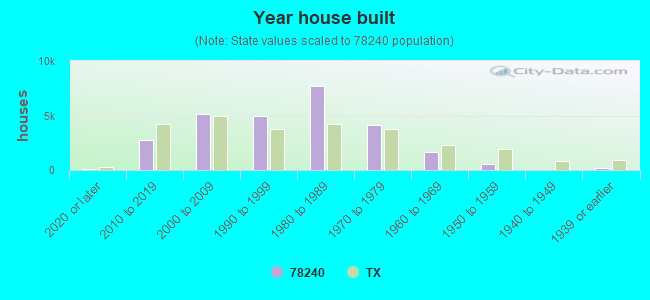


 Based on the data from the years 2002 - 2018 the average number of fires per year is 82. The highest number of reported fire incidents - 124 took place in 2005, and the least - 8 in 2008. The data has a declining trend.
 When looking into fire subcategories, the most reports belonged to: Outside Fires (40.0%), and Structure Fires (23.3%).