Estimated zip code population in 2022: 4,676 Zip code population in 2010: 4,525 Zip code population in 2000: 4,667
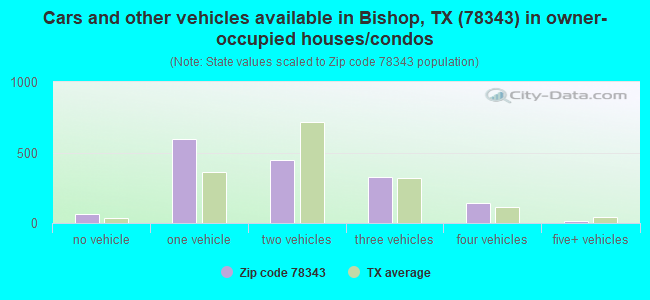
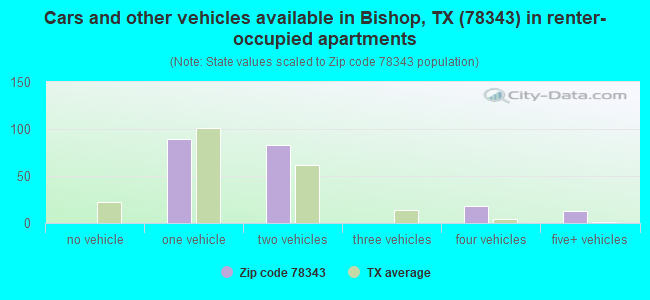
Houses and condos: 2,178 Renter-occupied apartments: 203
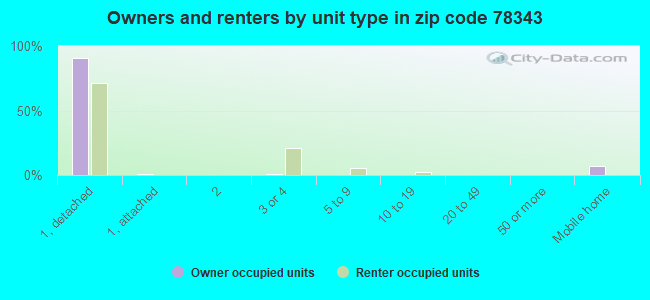
% of renters here:
11%
State:
38%
March 2022 cost of living index in zip code 78343: 84.3 (less than average, U.S. average is 100)
Land area: 165.2 sq. mi. Water area: 0.4 sq. mi.
Population density: 28 people per square mile
(very low).
OSM Map
General Map
Google Map
MSN Map
OSM Map
General Map
Google Map
MSN Map
OSM Map
General Map
Google Map
MSN Map
OSM Map
General Map
Google Map
MSN Map
Please wait while loading the map...
Real estate property taxes paid for housing units in 2022:
This zip code:
1.5% ($1,686)
Texas:
1.5% ($4,050)
Median real estate property taxes paid for housing units with mortgages in 2022: $2,632 (1.9%) Median real estate property taxes paid for housing units with no mortgage in 2022: $1,200 (1.3%)
Business Search- 14 Million verified businesses
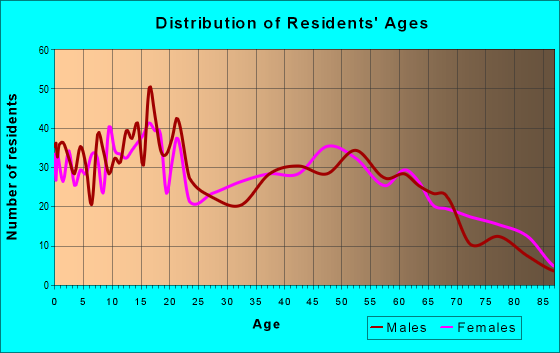
Males: 2,286
(48.9%)
Females: 2,390
(51.1%)
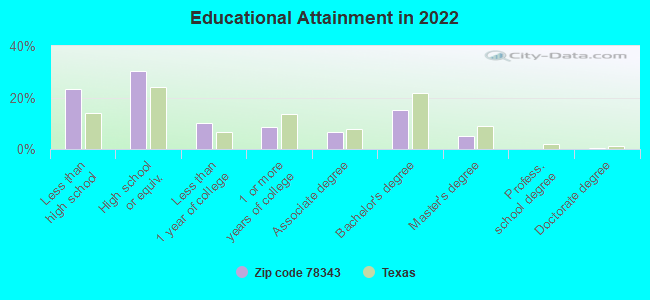
For population 25 years and over in 78343:
High school or higher: 75.1%
Bachelor's degree or higher: 20.4%
Graduate or professional degree: 5.5%
Unemployed: 5.4%
Mean travel time to work (commute): 27.5 minutes
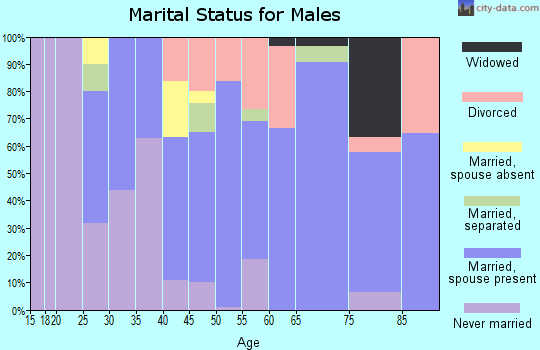
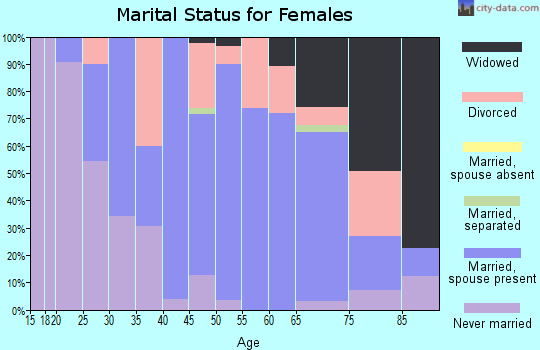
For population 15 years and over in 78343:
Never married: 24.6%
Now married: 57.9%
Separated: 1.5%
Widowed: 7.9%
Divorced: 8.1%
Zip code 78343 compared to state average:
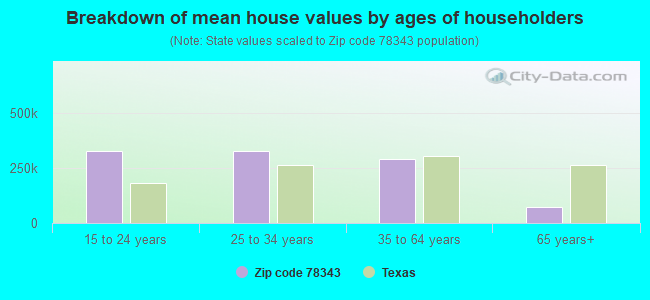
Median house value significantly below state average.
Black race population percentage below state average.
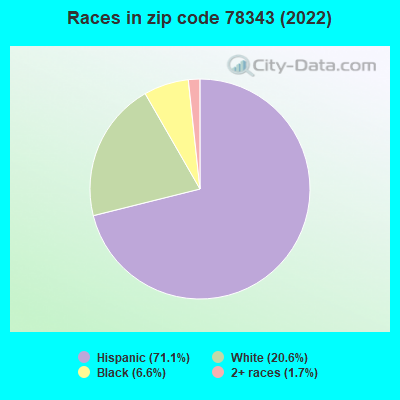
Hispanic race population percentage above state average.
Median age significantly above state average.
Foreign-born population percentage below state average.
Renting percentage significantly below state average.
Length of stay since moving in significantly above state average.
Averages for the 2020 tax year for zip code 78343, filed in 2021:
Average Adjusted Gross Income (AGI) in 2020: $50,605 (Individual Income Tax Returns)
Here:
$50,605
State:
$77,054
Salary/wage: $45,262 (reported on 84.7% of returns)
Here:
$45,262
State:
$62,766
(% of AGI for various income ranges: 1205.2% for AGIs below $25k, 3437.3% for AGIs $25k-50k, 6697.3% for AGIs $50k-75k, 9360.9% for AGIs $75k-100k, 17002.7% for AGIs $100k-200k)
Taxable interest for individuals: $965 (reported on 16.7% of returns)
This zip code:
$965
Texas:
$2,665
(% of AGI for various income ranges: 1.7% for AGIs below $25k, 7.6% for AGIs $25k-50k, 27.3% for AGIs $50k-75k, 37.3% for AGIs $75k-100k, 102.7% for AGIs $100k-200k)
Ordinary dividends: $2,824 (reported on 8.4% of returns)
Here:
$2,824
State:
$10,044
(% of AGI for various income ranges: 7.8% for AGIs $25k-50k, 14.1% for AGIs $50k-75k, 35.5% for AGIs $75k-100k, 250.0% for AGIs $100k-200k)
Net capital gain/loss in AGI: +$10,636 (reported on 6.9% of returns)
Here:
+$10,636
State:
+$39,590
(% of AGI for various income ranges: 40.0% for AGIs $50k-75k, 940.7% for AGIs $100k-200k)
Profit/loss from business: +$3,018 (reported on 13.8% of returns)
Here:
+$3,018
State:
+$10,888
(% of AGI for various income ranges: 71.6% for AGIs below $25k, 7.1% for AGIs $25k-50k, 5.0% for AGIs $50k-75k, 32.7% for AGIs $75k-100k, 234.0% for AGIs $100k-200k)
Taxable individual retirement arrangement distribution: $15,350 (reported on 4.9% of returns)
78343:
$15,350
Texas:
$24,740
(% of AGI for various income ranges: 27.6% for AGIs below $25k, 308.6% for AGIs $50k-75k, 464.0% for AGIs $100k-200k)
Total itemized deductions: $39,475 (reported on 2.0% of returns)
Here:
$39,475
State:
$40,428
(% of AGI for various income ranges: 141.3% for AGIs $25k-50k, 628.7% for AGIs $100k-200k)
Charity contributions: $9,500 (reported on 1.5% of returns)
Here:
$9,500
State:
$18,201
(% of AGI for various income ranges: 190.0% for AGIs $100k-200k)
Taxes paid: $5,800 (reported on 2.0% of returns)
78343:
$5,800
State:
$7,821
(% of AGI for various income ranges: 154.7% for AGIs $100k-200k)
Earned income credit: $2,732 (reported on 23.2% of returns)
Here:
$2,732
State:
$2,584
(% of AGI for various income ranges: 147.9% for AGIs below $25k, 94.7% for AGIs $25k-50k)
Percentage of individuals using paid preparers for their 2020 taxes: 88.2%
Here:
88%
State:
92%
(% for various income ranges: 83.3% for AGIs below $25k, 92.5% for AGIs $25k-50k, 90.0% for AGIs $50k-75k, 93.3% for AGIs $75k-100k, 87.5% for AGIs $100k-200k, 100.0% for AGIs over 200k)
Averages for the 2012 tax year for zip code 78343, filed in 2013:
Average Adjusted Gross Income (AGI) in 2012: $48,065 (Individual Income Tax Returns)
Here:
$48,065
State:
$65,384
Salary/wage: $42,782 (reported on 86.0% of returns)
Here:
$42,782
State:
$52,524
(% of AGI for various income ranges: 79.3% for AGIs below $25k, 83.2% for AGIs $25k-50k, 76.4% for AGIs $50k-75k, 82.2% for AGIs $75k-100k, 91.8% for AGIs $100k-200k)
Taxable interest for individuals: $804 (reported on 24.2% of returns)
This zip code:
$804
Texas:
$2,372
(% of AGI for various income ranges: 0.4% for AGIs below $25k, 0.5% for AGIs $25k-50k, 0.4% for AGIs $50k-75k, 0.5% for AGIs $75k-100k, 0.4% for AGIs $100k-200k)
Ordinary dividends: $2,750 (reported on 10.8% of returns)
Here:
$2,750
State:
$9,721
(% of AGI for various income ranges: 0.3% for AGIs below $25k, 0.4% for AGIs $25k-50k, 0.8% for AGIs $50k-75k, 0.8% for AGIs $75k-100k, 1.0% for AGIs $100k-200k)
Net capital gain/loss in AGI: +$4,564 (reported on 7.5% of returns)
Here:
+$4,564
State:
+$35,319
(% of AGI for various income ranges: 0.2% for AGIs $50k-75k, 0.2% for AGIs $75k-100k, 2.4% for AGIs $100k-200k)
Profit/loss from business: +$8,720 (reported on 13.4% of returns)
Here:
+$8,720
State:
+$13,732
(% of AGI for various income ranges: 8.0% for AGIs below $25k, 1.2% for AGIs $25k-50k, 2.7% for AGIs $50k-75k, 1.8% for AGIs $75k-100k, 2.0% for AGIs $100k-200k)
Taxable individual retirement arrangement distribution: $13,227 (reported on 5.9% of returns)
78343:
$13,227
Texas:
$19,511
(% of AGI for various income ranges: 0.9% for AGIs below $25k, 1.5% for AGIs $25k-50k, 2.3% for AGIs $50k-75k, 1.8% for AGIs $75k-100k, 2.0% for AGIs $100k-200k)
Total itemized deductions: $18,473 (20% of AGI, reported on 14.0% of returns)
Here:
$18,473
State:
$24,724
Here:
19.7% of AGI
State:
15.9% of AGI
(% of AGI for various income ranges: 6.4% for AGIs $25k-50k, 6.2% for AGIs $50k-75k, 7.3% for AGIs $75k-100k, 6.7% for AGIs $100k-200k)
Charity contributions: $4,445 (reported on 10.8% of returns)
Here:
$4,445
State:
$6,808
(% of AGI for various income ranges: 0.7% for AGIs $25k-50k, 1.0% for AGIs $50k-75k, 1.6% for AGIs $75k-100k, 1.5% for AGIs $100k-200k)
Taxes paid: $4,728 (reported on 13.4% of returns)
78343:
$4,728
State:
$6,921
(% of AGI for various income ranges: 1.4% for AGIs $25k-50k, 1.0% for AGIs $50k-75k, 1.7% for AGIs $75k-100k, 2.2% for AGIs $100k-200k)
Earned income credit: $2,494 (reported on 25.3% of returns)
Here:
$2,494
State:
$2,570
(% of AGI for various income ranges: 9.0% for AGIs below $25k, 1.8% for AGIs $25k-50k)
Percentage of individuals using paid preparers for their 2012 taxes: 47.3%
Here:
47%
State:
51%
(% for various income ranges: 41.3% for AGIs below $25k, 44.4% for AGIs $25k-50k, 50.0% for AGIs $50k-75k, 52.6% for AGIs $75k-100k, 66.7% for AGIs $100k-200k, 66.7% for AGIs over 200k)
Averages for the 2004 tax year for zip code 78343, filed in 2005:
Average Adjusted Gross Income (AGI) in 2004: $34,062 (Individual Income Tax Returns)
Here:
$34,062
State:
$47,881
Salary/wage: $31,358 (reported on 86.0% of returns)
Here:
$31,358
State:
$41,947
(% of AGI for various income ranges: 121.5% for AGIs below $10k, 82.3% for AGIs $10k-25k, 83.1% for AGIs $25k-50k, 78.2% for AGIs $50k-75k, 82.2% for AGIs $75k-100k, 64.3% for AGIs over 100k)
Taxable interest for individuals: $1,318 (reported on 29.9% of returns)
This zip code:
$1,318
Texas:
$2,255
(% of AGI for various income ranges: 4.7% for AGIs below $10k, 1.4% for AGIs $10k-25k, 0.7% for AGIs $25k-50k, 1.7% for AGIs $50k-75k, 0.8% for AGIs $75k-100k, 0.9% for AGIs over 100k)
Taxable dividends: $1,934 (reported on 12.5% of returns)
Here:
$1,934
State:
$4,261
(% of AGI for various income ranges: 1.7% for AGIs below $10k, 0.6% for AGIs $10k-25k, 0.6% for AGIs $25k-50k, 1.1% for AGIs $50k-75k, 0.4% for AGIs $75k-100k, 0.6% for AGIs over 100k)
Net capital gain/loss: +$1,821 (reported on 9.8% of returns)
Here:
+$1,821
State:
+$16,110
(% of AGI for various income ranges: 1.4% for AGIs below $10k, -0.3% for AGIs $10k-25k, -0.1% for AGIs $25k-50k, -0.0% for AGIs $50k-75k, 0.6% for AGIs $75k-100k, 2.6% for AGIs over 100k)
Profit/loss from business: +$1,009 (reported on 11.9% of returns)
Here:
+$1,009
State:
+$11,013
(% of AGI for various income ranges: 7.2% for AGIs below $10k, 2.7% for AGIs $10k-25k, 0.2% for AGIs $25k-50k, -0.3% for AGIs $50k-75k, -0.2% for AGIs $75k-100k, -0.8% for AGIs over 100k)
Profit/loss from farming: +$1,988 (reported on 4.4% of returns)
Here:
+$1,988
State:
-$9,403
(% of AGI for various income ranges: -4.9% for AGIs below $10k, -0.3% for AGIs $25k-50k, 2.0% for AGIs $50k-75k, -1.5% for AGIs $75k-100k, 1.3% for AGIs over 100k)
IRA payment deduction: $2,724 (reported on 1.6% of returns)
78343:
$2,724
Texas:
$3,120
Total itemized deductions: $14,158 (20% of AGI, reported on 11.1% of returns)
Here:
$14,158
State:
$19,631
Here:
20.4% of AGI
State:
18.9% of AGI
(% of AGI for various income ranges: 3.0% for AGIs $10k-25k, 3.8% for AGIs $25k-50k, 6.5% for AGIs $50k-75k, 4.5% for AGIs $75k-100k, 5.4% for AGIs over 100k)
Charity contributions deductions: $3,394 (5% of AGI, reported on 9.3% of returns)
Here:
$3,394
State:
$4,753
Here:
4.6% of AGI
State:
4.2% of AGI
(% of AGI for various income ranges: 0.5% for AGIs $10k-25k, 0.5% for AGIs $25k-50k, 1.3% for AGIs $50k-75k, 1.1% for AGIs $75k-100k, 1.5% for AGIs over 100k)
Total tax: $4,674 (reported on 66.7% of returns)
78343:
$4,674
State:
$9,058
(% of AGI for various income ranges: 3.6% for AGIs below $10k, 3.0% for AGIs $10k-25k, 5.7% for AGIs $25k-50k, 8.9% for AGIs $50k-75k, 11.3% for AGIs $75k-100k, 17.8% for AGIs over 100k)
Earned income credit: $1,964 (reported on 26.0% of returns)
Here:
$1,964
State:
$2,024
Percentage of individuals using paid preparers for their 2004 taxes: 58.0%
Here:
58%
State:
57%
(% for various income ranges: 54.3% for AGIs below $10k, 59.4% for AGIs $10k-25k, 58.1% for AGIs $25k-50k, 59.1% for AGIs $50k-75k, 54.3% for AGIs $75k-100k, 72.2% for AGIs over 100k)
Likely homosexual households (counted as self-reported same-sex unmarried-partner households)
Lesbian couples: 0.2% of all households
Gay men: 0.0% of all households
Household received Food Stamps/SNAP in the past 12 months: 230 Household did not receive Food Stamps/SNAP in the past 12 months: 1,553
Women who had a birth in the past 12 months: 184 (179 now married, 7 unmarried) Women who did not have a birth in the past 12 months: 758 (291 now married, 467 unmarried)
Housing units in zip code 78343 with a mortgage: 623 (16 second mortgage, 18 both second mortgage and home equity loan) Median monthly owner costs for units with a mortgage: $1,209 Median monthly owner costs for units without a mortgage: $436
Residents with income below the poverty level in 2022:
This zip code:
17.4%
Whole state:
14.0%
Residents with income below 50% of the poverty level in 2022:
This zip code:
7.2%
Whole state:
7.4%
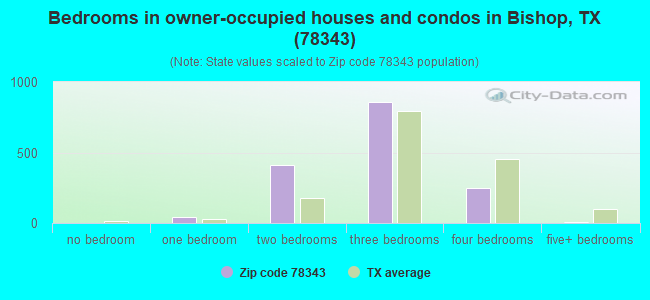
Median number of rooms in houses and condos:
Here:
5.8
State:
6.3
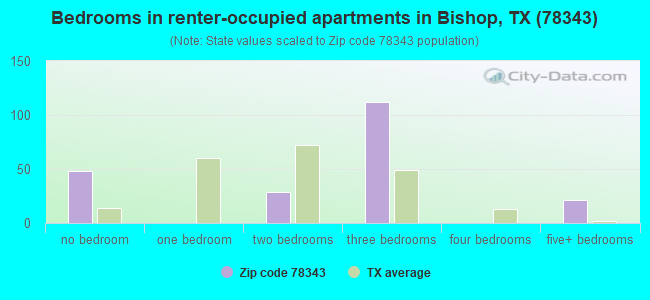
Median number of rooms in apartments:
Here:
4.9
State:
4.0
Notable locations in this zip code not listed on our city pages
Notable locations in zip code 78343: Harlan Tank Farm (A), Robstown Pumping Station (B), Stanolind-Luby Camp Refinery (C), Nueces County Highway Patrol (D), Bishop Police Department (E), Bishop Volunteer Fire Station (F). Display/hide their locations on the map
Churches in zip code 78343 include: First Baptist Church (A), Church of Christ (B), Saint James Catholic Church (C), New Hope Missionary Baptist Church (D), Turcotte Piper Chapel Church (E). Display/hide their locations on the map
Size of family households: 648 2-persons, 292 3-persons, 219 4-persons, 154 5-persons, 30 6-persons, 10 7-or-more-persons
Size of nonfamily households: 385 1-person, 23 2-persons, 13 3-persons
571 married couples with children.
223 single-parent households (223 women).
59.1% of residents of 78343 zip code speak English at home.
41.8% of residents speak Spanish at home (73% very well, 13% well, 9% not well, 5% not at all).
0.2% of residents speak Asian or Pacific Island language at home (100% very well).
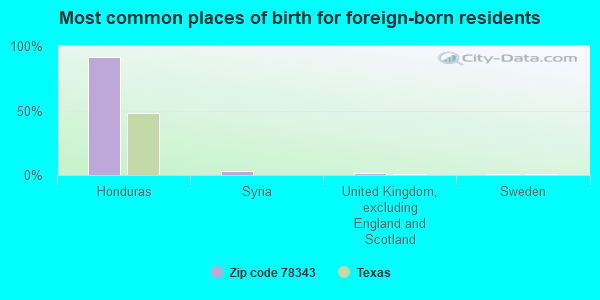
Foreign born population: 382 (8.2%) (69.7% of them are naturalized citizens)
This zip code:
8.2%
Whole state:
17.2%
92%Honduras
3%Syria
1%United Kingdom, excluding England and Scotland
1%Sweden
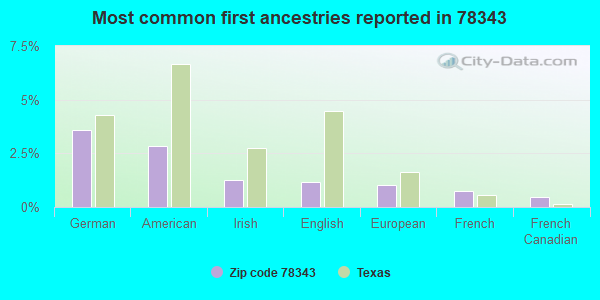
4%German
3%American
1%Irish
1%English
1%European
1%French
0%French Canadian
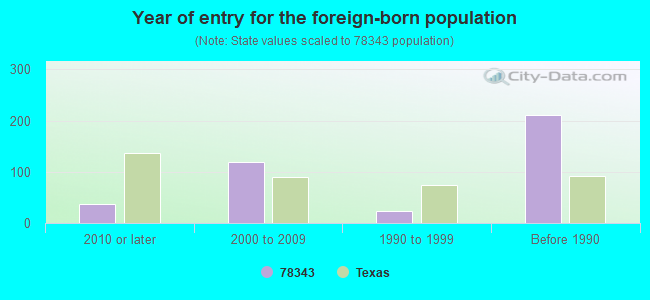
Year of entry for the foreign-born population
382010 or later
1192000 to 2009
231990 to 1999
211Before 1990
Housing units lacking complete plumbing facilities: 8.0% Housing units lacking complete kitchen facilities: 3.2%
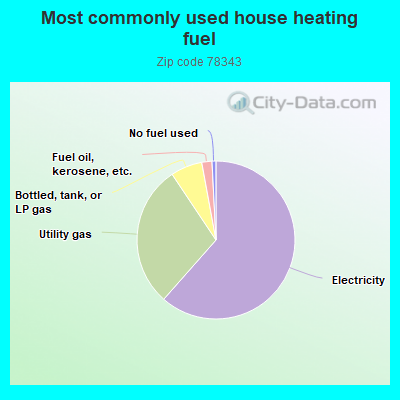
61.7%Electricity
29.2%Utility gas
6.5%Bottled, tank, or LP gas
2.1%Fuel oil, kerosene, etc.
0.8%No fuel used
Population in 1990: 4,608. Population change in the 1990s: +59 (+1.3%).
Place of birth for U.S.-born residents:
This state: 3,888
Northeast: 28
Midwest: 66
South: 110
West: 121
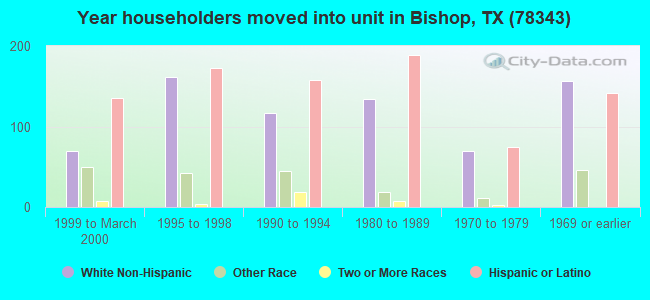
67% of the 78343 zip code residents lived in the same house 5 years ago. Out of people who lived in different houses, 54% lived in this county. Out of people who lived in different counties, 50% lived in Texas.
96% of the 78343 zip code residents lived in the same house 1 year ago. Out of people who lived in different houses, 33% moved from this county. Out of people who lived in different houses, 54% moved from different county within same state. Out of people who lived in different houses, 11% moved from different state. Out of people who lived in different houses, 9% moved from abroad.
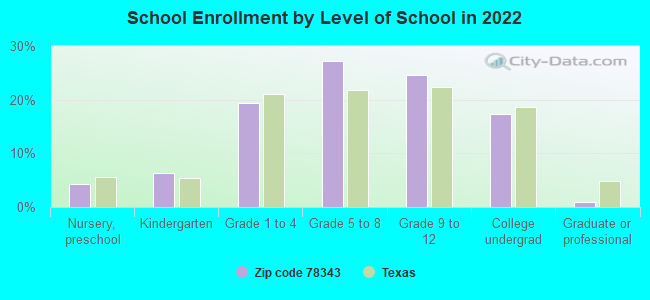
Private vs. public school enrollment:
Students in private schools in grades 1 to 8 (elementary and middle school): 48
Here:
11.0%
Texas:
8.8%
Students in private schools in grades 9 to 12 (high school): 7
Here:
3.2%
Texas:
8.0%
Students in private undergraduate colleges: 16
Here:
10.2%
Texas:
16.2%
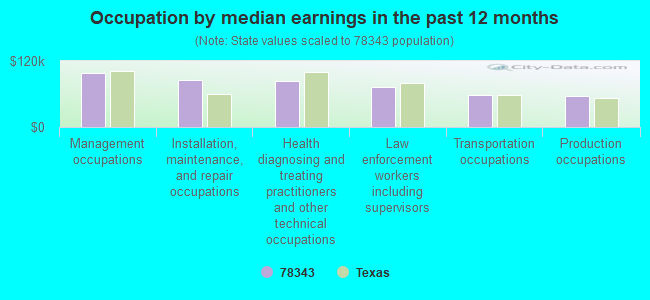
Occupation by median earnings in the past 12 months ($)
97,800Management occupations
84,964Installation, maintenance, and repair occupations
83,229Health diagnosing and treating practitioners and other technical occupations
72,194Law enforcement workers including supervisors
58,801Transportation occupations
55,762Production occupations
Top industries in this zip code by the number of employees in 2005:
Mining: Natural Gas Liquid Extraction (20-49 employees: 1 establishment)
Mining: Support Activities for Oil and Gas Operations (20-49: 1)
Accommodation and Food Services: Full-Service Restaurants (10-19: 1, 1-4: 1)
Health Care and Social Assistance: Offices of Physical, Occupational and Speech Therapists, and Audiologists (10-19: 1)
Accommodation and Food Services: Food Service Contractors (10-19: 1)
Accommodation and Food Services: Limited-Service Restaurants (10-19: 1)
Finance and Insurance: Commercial Banking (10-19: 1)
Educational Services: Elementary and Secondary Schools (10-19: 1)
Fatal accident statistics in 2014:
Fatal accident count: 1
Vehicles involved in fatal accidents: 1
Fatal accidents caused by drunken drivers: 0
Fatalities: 1
Persons involved in fatal accidents: 3
Pedestrians involved in fatal accidents: 0
Fatal accident statistics in 2013:
Fatal accident count: 1
Vehicles involved in fatal accidents: 2
Fatal accidents caused by drunken drivers: 0
Fatalities: 3
Persons involved in fatal accidents: 5
Pedestrians involved in fatal accidents: 0
Home Mortgage Disclosure Act Aggregated Statistics For Year 2009 (Based on 1 full and 4 partial tracts)
A) FHA, FSA/RHS & VA Home Purchase Loans
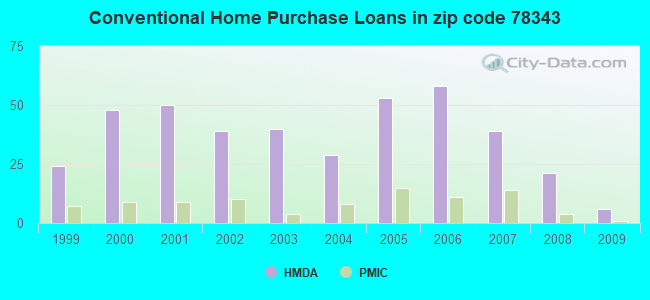
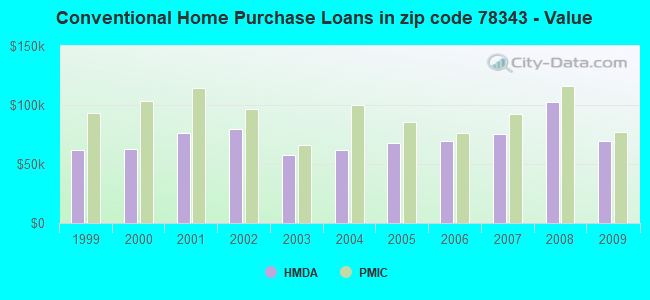
B) Conventional Home Purchase Loans
C) Refinancings
D) Home Improvement Loans
F) Non-occupant Loans on < 5 Family Dwellings (A B C & D)
G) Loans On Manufactured Home Dwelling (A B C & D)
Number
Average Value
Number
Average Value
Number
Average Value
Number
Average Value
Number
Average Value
Number
Average Value
LOANS ORIGINATED
15
$121,393
6
$69,483
26
$75,492
8
$36,758
2
$71,695
5
$34,980
APPLICATIONS APPROVED, NOT ACCEPTED
5
$47,008
7
$161,249
5
$58,428
2
$27,990
1
$17,640
2
$32,970
APPLICATIONS DENIED
4
$128,870
15
$62,709
30
$69,994
21
$24,136
5
$45,902
6
$21,512
APPLICATIONS WITHDRAWN
1
$41,410
6
$78,747
14
$90,543
4
$23,340
1
$15,340
2
$46,270
FILES CLOSED FOR INCOMPLETENESS
1
$153,000
1
$119,620
2
$25,305
2
$19,450
0
$0
2
$29,755
Aggregated Statistics For Year 2008 (Based on 1 full and 4 partial tracts)
A) FHA, FSA/RHS & VA Home Purchase Loans
B) Conventional Home Purchase Loans
C) Refinancings
D) Home Improvement Loans
F) Non-occupant Loans on < 5 Family Dwellings (A B C & D)
G) Loans On Manufactured Home Dwelling (A B C & D)
Number
Average Value
Number
Average Value
Number
Average Value
Number
Average Value
Number
Average Value
Number
Average Value
LOANS ORIGINATED
23
$100,083
21
$102,435
38
$65,334
26
$25,700
5
$59,690
4
$86,968
APPLICATIONS APPROVED, NOT ACCEPTED
4
$88,995
5
$71,292
8
$50,586
3
$15,160
1
$84,000
3
$52,713
APPLICATIONS DENIED
2
$53,770
11
$94,095
44
$70,675
51
$32,905
7
$23,479
6
$44,518
APPLICATIONS WITHDRAWN
2
$75,155
9
$94,460
13
$91,104
5
$44,192
2
$25,320
3
$45,223
FILES CLOSED FOR INCOMPLETENESS
0
$0
0
$0
3
$51,297
2
$71,160
0
$0
0
$0
Aggregated Statistics For Year 2007 (Based on 1 full and 4 partial tracts)
A) FHA, FSA/RHS & VA Home Purchase Loans
B) Conventional Home Purchase Loans
C) Refinancings
D) Home Improvement Loans
F) Non-occupant Loans on < 5 Family Dwellings (A B C & D)
G) Loans On Manufactured Home Dwelling (A B C & D)
Number
Average Value
Number
Average Value
Number
Average Value
Number
Average Value
Number
Average Value
Number
Average Value
LOANS ORIGINATED
12
$113,452
39
$75,575
39
$82,098
27
$24,422
9
$42,737
9
$66,960
APPLICATIONS APPROVED, NOT ACCEPTED
0
$0
10
$69,031
8
$101,588
10
$43,268
1
$60,680
5
$45,576
APPLICATIONS DENIED
2
$126,830
15
$104,261
64
$67,132
39
$34,689
9
$58,839
4
$63,098
APPLICATIONS WITHDRAWN
2
$94,760
8
$88,232
27
$78,130
2
$70,945
2
$94,465
4
$54,352
FILES CLOSED FOR INCOMPLETENESS
0
$0
1
$50,000
5
$74,460
2
$33,170
0
$0
0
$0
Aggregated Statistics For Year 2006 (Based on 1 full and 4 partial tracts)
A) FHA, FSA/RHS & VA Home Purchase Loans
B) Conventional Home Purchase Loans
C) Refinancings
D) Home Improvement Loans
F) Non-occupant Loans on < 5 Family Dwellings (A B C & D)
G) Loans On Manufactured Home Dwelling (A B C & D)
Number
Average Value
Number
Average Value
Number
Average Value
Number
Average Value
Number
Average Value
Number
Average Value
LOANS ORIGINATED
11
$103,213
58
$69,106
42
$69,694
26
$32,346
15
$55,331
12
$74,008
APPLICATIONS APPROVED, NOT ACCEPTED
2
$114,335
9
$58,471
8
$60,666
5
$30,988
1
$44,470
2
$39,605
APPLICATIONS DENIED
2
$47,825
52
$70,963
50
$58,804
41
$22,037
4
$35,152
11
$43,887
APPLICATIONS WITHDRAWN
1
$23,000
17
$76,703
26
$78,919
4
$35,655
2
$45,000
1
$20,700
FILES CLOSED FOR INCOMPLETENESS
1
$31,000
1
$149,000
6
$66,837
2
$28,500
1
$51,000
0
$0
Aggregated Statistics For Year 2005 (Based on 1 full and 4 partial tracts)
A) FHA, FSA/RHS & VA Home Purchase Loans
B) Conventional Home Purchase Loans
C) Refinancings
D) Home Improvement Loans
F) Non-occupant Loans on < 5 Family Dwellings (A B C & D)
G) Loans On Manufactured Home Dwelling (A B C & D)
Number
Average Value
Number
Average Value
Number
Average Value
Number
Average Value
Number
Average Value
Number
Average Value
LOANS ORIGINATED
9
$70,111
53
$67,918
48
$69,913
32
$31,302
12
$43,850
11
$58,658
APPLICATIONS APPROVED, NOT ACCEPTED
2
$58,235
17
$82,374
8
$53,250
2
$32,500
1
$200,130
3
$38,410
APPLICATIONS DENIED
2
$49,520
31
$43,846
66
$59,218
49
$21,199
7
$36,997
18
$41,468
APPLICATIONS WITHDRAWN
0
$0
6
$71,630
41
$66,054
8
$54,114
0
$0
2
$79,045
FILES CLOSED FOR INCOMPLETENESS
0
$0
2
$112,335
4
$78,632
1
$56,000
0
$0
0
$0
Aggregated Statistics For Year 2004 (Based on 1 full and 4 partial tracts)
A) FHA, FSA/RHS & VA Home Purchase Loans
B) Conventional Home Purchase Loans
C) Refinancings
D) Home Improvement Loans
F) Non-occupant Loans on < 5 Family Dwellings (A B C & D)
G) Loans On Manufactured Home Dwelling (A B C & D)
Number
Average Value
Number
Average Value
Number
Average Value
Number
Average Value
Number
Average Value
Number
Average Value
LOANS ORIGINATED
14
$72,549
29
$61,472
52
$60,472
21
$20,297
8
$31,230
8
$58,764
APPLICATIONS APPROVED, NOT ACCEPTED
0
$0
15
$42,235
4
$59,408
3
$26,620
2
$17,800
7
$30,734
APPLICATIONS DENIED
0
$0
30
$39,706
73
$57,766
61
$20,215
9
$25,807
17
$28,432
APPLICATIONS WITHDRAWN
2
$64,500
7
$116,007
49
$68,270
5
$33,186
2
$111,000
0
$0
FILES CLOSED FOR INCOMPLETENESS
0
$0
0
$0
9
$75,291
0
$0
1
$28,000
0
$0
Aggregated Statistics For Year 2003 (Based on 1 full and 4 partial tracts)
A) FHA, FSA/RHS & VA Home Purchase Loans
B) Conventional Home Purchase Loans
C) Refinancings
D) Home Improvement Loans
F) Non-occupant Loans on < 5 Family Dwellings (A B C & D)
Number
Average Value
Number
Average Value
Number
Average Value
Number
Average Value
Number
Average Value
LOANS ORIGINATED
17
$67,774
40
$57,390
85
$60,240
15
$15,091
10
$37,694
APPLICATIONS APPROVED, NOT ACCEPTED
0
$0
6
$80,005
17
$61,261
1
$25,000
2
$104,500
APPLICATIONS DENIED
1
$137,260
27
$51,237
56
$64,983
35
$15,368
8
$39,079
APPLICATIONS WITHDRAWN
1
$85,750
6
$51,485
52
$66,172
5
$17,402
0
$0
FILES CLOSED FOR INCOMPLETENESS
0
$0
0
$0
5
$47,244
0
$0
0
$0
Aggregated Statistics For Year 2002 (Based on 1 full and 4 partial tracts)
A) FHA, FSA/RHS & VA Home Purchase Loans
B) Conventional Home Purchase Loans
C) Refinancings
D) Home Improvement Loans
F) Non-occupant Loans on < 5 Family Dwellings (A B C & D)
Number
Average Value
Number
Average Value
Number
Average Value
Number
Average Value
Number
Average Value
LOANS ORIGINATED
14
$105,659
39
$79,387
79
$77,746
12
$20,444
9
$54,237
APPLICATIONS APPROVED, NOT ACCEPTED
2
$73,000
8
$72,695
15
$51,053
2
$30,670
3
$27,433
APPLICATIONS DENIED
3
$86,517
26
$40,624
45
$60,829
39
$8,736
9
$30,966
APPLICATIONS WITHDRAWN
0
$0
7
$70,164
31
$62,298
4
$12,230
4
$63,768
FILES CLOSED FOR INCOMPLETENESS
0
$0
5
$50,800
6
$78,197
1
$15,340
2
$91,250
Aggregated Statistics For Year 2001 (Based on 1 full and 4 partial tracts)
A) FHA, FSA/RHS & VA Home Purchase Loans
B) Conventional Home Purchase Loans
C) Refinancings
D) Home Improvement Loans
F) Non-occupant Loans on < 5 Family Dwellings (A B C & D)
Number
Average Value
Number
Average Value
Number
Average Value
Number
Average Value
Number
Average Value
LOANS ORIGINATED
22
$75,978
50
$76,292
57
$60,376
26
$18,310
9
$29,249
APPLICATIONS APPROVED, NOT ACCEPTED
1
$52,590
8
$52,350
8
$63,319
3
$6,587
0
$0
APPLICATIONS DENIED
0
$0
31
$42,330
43
$54,515
23
$14,080
3
$20,623
APPLICATIONS WITHDRAWN
1
$71,000
6
$65,985
29
$48,888
3
$12,750
1
$8,000
FILES CLOSED FOR INCOMPLETENESS
0
$0
0
$0
2
$55,585
3
$23,153
0
$0
Aggregated Statistics For Year 2000 (Based on 1 full and 4 partial tracts)
A) FHA, FSA/RHS & VA Home Purchase Loans
B) Conventional Home Purchase Loans
C) Refinancings
D) Home Improvement Loans
F) Non-occupant Loans on < 5 Family Dwellings (A B C & D)
Number
Average Value
Number
Average Value
Number
Average Value
Number
Average Value
Number
Average Value
LOANS ORIGINATED
11
$62,604
48
$62,918
19
$37,976
13
$13,545
4
$13,400
APPLICATIONS APPROVED, NOT ACCEPTED
1
$25,080
19
$50,023
3
$33,460
4
$30,538
0
$0
APPLICATIONS DENIED
7
$43,934
61
$45,691
18
$50,220
14
$12,116
3
$52,077
APPLICATIONS WITHDRAWN
2
$83,340
1
$82,810
14
$31,544
1
$13,040
0
$0
FILES CLOSED FOR INCOMPLETENESS
1
$64,720
0
$0
14
$63,155
0
$0
1
$17,000
Aggregated Statistics For Year 1999 (Based on 1 full and 2 partial tracts)
A) FHA, FSA/RHS & VA Home Purchase Loans
B) Conventional Home Purchase Loans
C) Refinancings
D) Home Improvement Loans
F) Non-occupant Loans on < 5 Family Dwellings (A B C & D)
2002 - 2018 National Fire Incident Reporting System (NFIRS) incidents
Based on the data from the years 2002 - 2018 the average number of fires per year is 12. The highest number of reported fires - 68 took place in 2002, and the least - 0 in 2006. The data has a dropping trend.
When looking into fire subcategories, the most reports belonged to: Outside Fires (64.0%), and Structure Fires (22.5%).
Fire incident types reported to NFIRS in Zip Code 78343


+$1,988
-$9,403
(% of AGI for various income ranges: -4.9% for AGIs below $10k, -0.3% for AGIs $25k-50k, 2.0% for AGIs $50k-75k, -1.5% for AGIs $75k-100k, 1.3% for AGIs over 100k) Nearest zip codes: 78351, 78380, 78339, 78330, 78363, 78410.


 Based on the data from the years 2002 - 2018 the average number of fires per year is 12. The highest number of reported fires - 68 took place in 2002, and the least - 0 in 2006. The data has a dropping trend.
 When looking into fire subcategories, the most reports belonged to: Outside Fires (64.0%), and Structure Fires (22.5%).