Estimated zip code population in 2022: 30,422 Zip code population in 2010: 29,854 Zip code population in 2000: 26,529
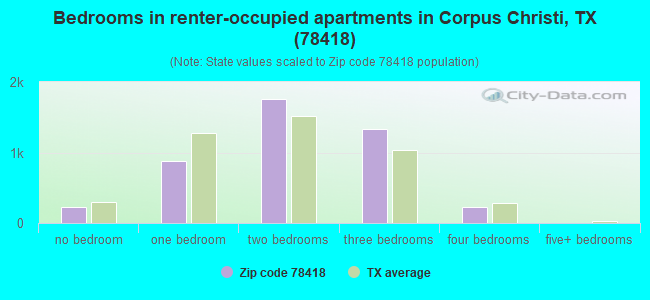
Houses and condos: 16,209 Renter-occupied apartments: 4,464
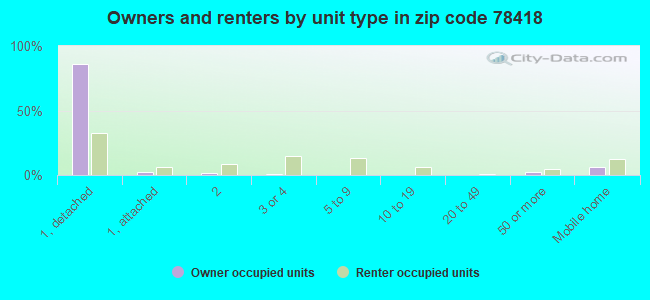
% of renters here:
35%
State:
38%
March 2022 cost of living index in zip code 78418: 86.8 (less than average, U.S. average is 100)
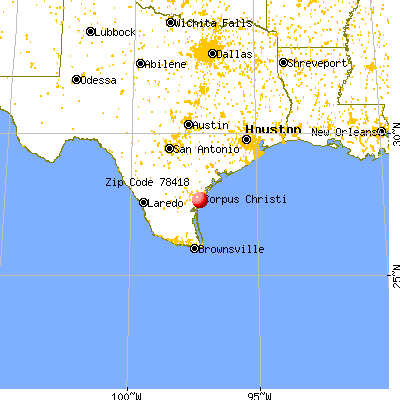
Land area: 43.5 sq. mi. Water area: 37.1 sq. mi.
Population density: 700 people per square mile
(low).
OSM Map
General Map
Google Map
MSN Map
OSM Map
General Map
Google Map
MSN Map
OSM Map
General Map
Google Map
MSN Map
OSM Map
General Map
Google Map
MSN Map
Please wait while loading the map...
Real estate property taxes paid for housing units in 2022:
This zip code:
1.7% ($4,971)
Texas:
1.5% ($4,050)
Median real estate property taxes paid for housing units with mortgages in 2022: $5,963 (1.9%) Median real estate property taxes paid for housing units with no mortgage in 2022: $3,358 (1.2%)
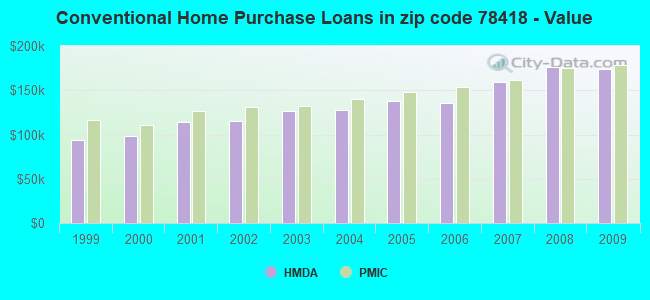
Estimated median house/condo value in 2022: $299,353
78418:
$299,353
Texas:
$275,400
According to our research of Texas and other state lists, there were 70 registered sex offenders living in 78418 zip code as of April 27, 2024. The ratio of all residents to sex offenders in zip code 78418 is 446 to 1. The ratio of registered sex offenders to all residents in this zip code is near the state average.
Median resident age:
This zip code:
43.0 years
Texas median age:
35.6 years
Average household size:
This zip code:
2.4 people
Texas:
2.6 people
Averages for the 2020 tax year for zip code 78418, filed in 2021:
Average Adjusted Gross Income (AGI) in 2020: $77,309 (Individual Income Tax Returns)
Here:
$77,309
State:
$77,054
Salary/wage: $62,606 (reported on 80.2% of returns)
Here:
$62,606
State:
$62,766
(% of AGI for various income ranges: 1083.1% for AGIs below $25k, 3380.0% for AGIs $25k-50k, 6039.5% for AGIs $50k-75k, 8776.0% for AGIs $75k-100k, 17383.1% for AGIs $100k-200k, 66528.2% for AGIs over 200k)
Taxable interest for individuals: $2,233 (reported on 30.4% of returns)
This zip code:
$2,233
Texas:
$2,665
(% of AGI for various income ranges: 11.8% for AGIs below $25k, 32.0% for AGIs $25k-50k, 35.0% for AGIs $50k-75k, 110.1% for AGIs $75k-100k, 146.4% for AGIs $100k-200k, 1776.1% for AGIs over 200k)
Ordinary dividends: $6,912 (reported on 17.3% of returns)
Here:
$6,912
State:
$10,044
(% of AGI for various income ranges: 18.3% for AGIs below $25k, 40.1% for AGIs $25k-50k, 75.4% for AGIs $50k-75k, 132.1% for AGIs $75k-100k, 316.7% for AGIs $100k-200k, 3136.4% for AGIs over 200k)
Net capital gain/loss in AGI: +$21,633 (reported on 17.3% of returns)
Here:
+$21,633
State:
+$39,590
(% of AGI for various income ranges: 11.5% for AGIs below $25k, 33.7% for AGIs $25k-50k, 84.4% for AGIs $50k-75k, 163.1% for AGIs $75k-100k, 565.4% for AGIs $100k-200k, 15067.5% for AGIs over 200k)
Profit/loss from business: +$16,122 (reported on 19.3% of returns)
Here:
+$16,122
State:
+$10,888
(% of AGI for various income ranges: 135.6% for AGIs below $25k, 143.3% for AGIs $25k-50k, 256.2% for AGIs $50k-75k, 358.5% for AGIs $75k-100k, 648.0% for AGIs $100k-200k, 7271.4% for AGIs over 200k)
Taxable individual retirement arrangement distribution: $24,895 (reported on 7.9% of returns)
78418:
$24,895
Texas:
$24,740
(% of AGI for various income ranges: 32.8% for AGIs below $25k, 89.8% for AGIs $25k-50k, 186.9% for AGIs $50k-75k, 391.5% for AGIs $75k-100k, 756.7% for AGIs $100k-200k, 2836.8% for AGIs over 200k)
Self-employed (Keogh) retirement plans: $31,886 (reported on 0.5% of returns)
78418:
$31,886
Texas:
$29,298
(% of AGI for various income ranges: 25.1% for AGIs $50k-75k, 663.6% for AGIs over 200k)
Total itemized deductions: $36,717 (reported on 8.0% of returns)
Here:
$36,717
State:
$40,428
(% of AGI for various income ranges: 33.8% for AGIs below $25k, 121.0% for AGIs $25k-50k, 239.5% for AGIs $50k-75k, 440.4% for AGIs $75k-100k, 848.1% for AGIs $100k-200k, 6588.9% for AGIs over 200k)
Charity contributions: $13,101 (reported on 6.0% of returns)
Here:
$13,101
State:
$18,201
(% of AGI for various income ranges: 2.5% for AGIs below $25k, 12.1% for AGIs $25k-50k, 27.1% for AGIs $50k-75k, 53.9% for AGIs $75k-100k, 152.5% for AGIs $100k-200k, 2801.4% for AGIs over 200k)
Taxes paid: $7,975 (reported on 7.7% of returns)
78418:
$7,975
State:
$7,821
(% of AGI for various income ranges: 7.8% for AGIs below $25k, 24.9% for AGIs $25k-50k, 56.3% for AGIs $50k-75k, 113.2% for AGIs $75k-100k, 213.2% for AGIs $100k-200k, 1096.4% for AGIs over 200k)
Earned income credit: $2,350 (reported on 16.1% of returns)
Here:
$2,350
State:
$2,584
(% of AGI for various income ranges: 104.0% for AGIs below $25k, 70.3% for AGIs $25k-50k, 1.0% for AGIs $50k-75k)
Percentage of individuals using paid preparers for their 2020 taxes: 91.8%
Here:
92%
State:
92%
(% for various income ranges: 91.0% for AGIs below $25k, 93.3% for AGIs $25k-50k, 92.4% for AGIs $50k-75k, 91.5% for AGIs $75k-100k, 92.1% for AGIs $100k-200k, 89.2% for AGIs over 200k)
Averages for the 2012 tax year for zip code 78418, filed in 2013:
Average Adjusted Gross Income (AGI) in 2012: $62,584 (Individual Income Tax Returns)
Here:
$62,584
State:
$65,384
Salary/wage: $51,178 (reported on 84.3% of returns)
Here:
$51,178
State:
$52,524
(% of AGI for various income ranges: 79.2% for AGIs below $25k, 78.1% for AGIs $25k-50k, 77.9% for AGIs $50k-75k, 76.3% for AGIs $75k-100k, 75.2% for AGIs $100k-200k, 46.4% for AGIs over 200k)
Taxable interest for individuals: $2,009 (reported on 31.5% of returns)
This zip code:
$2,009
Texas:
$2,372
(% of AGI for various income ranges: 0.8% for AGIs below $25k, 0.8% for AGIs $25k-50k, 0.6% for AGIs $50k-75k, 0.9% for AGIs $75k-100k, 0.6% for AGIs $100k-200k, 1.9% for AGIs over 200k)
Ordinary dividends: $5,700 (reported on 16.2% of returns)
Here:
$5,700
State:
$9,721
(% of AGI for various income ranges: 1.3% for AGIs below $25k, 0.8% for AGIs $25k-50k, 0.8% for AGIs $50k-75k, 1.1% for AGIs $75k-100k, 1.0% for AGIs $100k-200k, 2.8% for AGIs over 200k)
Net capital gain/loss in AGI: +$21,611 (reported on 13.8% of returns)
Here:
+$21,611
State:
+$35,319
(% of AGI for various income ranges: 0.4% for AGIs $25k-50k, 0.4% for AGIs $50k-75k, 0.6% for AGIs $75k-100k, 1.2% for AGIs $100k-200k, 16.5% for AGIs over 200k)
Profit/loss from business: +$18,791 (reported on 17.0% of returns)
Here:
+$18,791
State:
+$13,732
(% of AGI for various income ranges: 8.2% for AGIs below $25k, 3.8% for AGIs $25k-50k, 3.0% for AGIs $50k-75k, 3.2% for AGIs $75k-100k, 4.0% for AGIs $100k-200k, 8.1% for AGIs over 200k)
Taxable individual retirement arrangement distribution: $19,115 (reported on 8.1% of returns)
78418:
$19,115
Texas:
$19,511
(% of AGI for various income ranges: 1.9% for AGIs below $25k, 2.0% for AGIs $25k-50k, 2.3% for AGIs $50k-75k, 2.5% for AGIs $75k-100k, 3.3% for AGIs $100k-200k, 2.0% for AGIs over 200k)
Self-employment retirement plans: $24,725 (reported on 0.6% of returns)
78418:
$24,725
Texas:
$23,938
Total itemized deductions: $22,178 (17% of AGI, reported on 25.6% of returns)
Here:
$22,178
State:
$24,724
Here:
17.3% of AGI
State:
15.9% of AGI
(% of AGI for various income ranges: 6.1% for AGIs below $25k, 8.1% for AGIs $25k-50k, 9.1% for AGIs $50k-75k, 9.5% for AGIs $75k-100k, 11.1% for AGIs $100k-200k, 8.0% for AGIs over 200k)
Charity contributions: $4,543 (reported on 20.0% of returns)
Here:
$4,543
State:
$6,808
(% of AGI for various income ranges: 0.5% for AGIs below $25k, 0.7% for AGIs $25k-50k, 1.2% for AGIs $50k-75k, 1.3% for AGIs $75k-100k, 1.6% for AGIs $100k-200k, 2.2% for AGIs over 200k)
Taxes paid: $6,653 (reported on 25.0% of returns)
78418:
$6,653
State:
$6,921
(% of AGI for various income ranges: 1.3% for AGIs below $25k, 1.9% for AGIs $25k-50k, 2.3% for AGIs $50k-75k, 2.7% for AGIs $75k-100k, 3.6% for AGIs $100k-200k, 2.6% for AGIs over 200k)
Earned income credit: $2,265 (reported on 19.1% of returns)
Here:
$2,265
State:
$2,570
(% of AGI for various income ranges: 7.1% for AGIs below $25k, 1.2% for AGIs $25k-50k)
Percentage of individuals using paid preparers for their 2012 taxes: 45.4%
Here:
45%
State:
51%
(% for various income ranges: 40.1% for AGIs below $25k, 40.8% for AGIs $25k-50k, 45.8% for AGIs $50k-75k, 49.6% for AGIs $75k-100k, 53.9% for AGIs $100k-200k, 82.7% for AGIs over 200k)
Averages for the 2004 tax year for zip code 78418, filed in 2005:
Average Adjusted Gross Income (AGI) in 2004: $48,684 (Individual Income Tax Returns)
Here:
$48,684
State:
$47,881
Salary/wage: $40,330 (reported on 84.7% of returns)
Here:
$40,330
State:
$41,947
(% of AGI for various income ranges: 138.4% for AGIs below $10k, 78.3% for AGIs $10k-25k, 78.9% for AGIs $25k-50k, 78.9% for AGIs $50k-75k, 78.2% for AGIs $75k-100k, 55.1% for AGIs over 100k)
Taxable interest for individuals: $1,730 (reported on 38.0% of returns)
This zip code:
$1,730
Texas:
$2,255
(% of AGI for various income ranges: 4.8% for AGIs below $10k, 1.2% for AGIs $10k-25k, 1.2% for AGIs $25k-50k, 1.2% for AGIs $50k-75k, 1.3% for AGIs $75k-100k, 1.4% for AGIs over 100k)
Taxable dividends: $3,018 (reported on 20.4% of returns)
Here:
$3,018
State:
$4,261
(% of AGI for various income ranges: 4.2% for AGIs below $10k, 1.0% for AGIs $10k-25k, 0.7% for AGIs $25k-50k, 1.0% for AGIs $50k-75k, 1.0% for AGIs $75k-100k, 1.7% for AGIs over 100k)
Net capital gain/loss: +$13,362 (reported on 17.7% of returns)
Here:
+$13,362
State:
+$16,110
(% of AGI for various income ranges: 0.5% for AGIs below $10k, 0.3% for AGIs $10k-25k, 0.5% for AGIs $25k-50k, 1.1% for AGIs $50k-75k, 1.8% for AGIs $75k-100k, 10.7% for AGIs over 100k)
Profit/loss from business: +$13,250 (reported on 17.1% of returns)
Here:
+$13,250
State:
+$11,013
(% of AGI for various income ranges: 9.9% for AGIs below $10k, 6.1% for AGIs $10k-25k, 3.2% for AGIs $25k-50k, 2.6% for AGIs $50k-75k, 3.0% for AGIs $75k-100k, 6.4% for AGIs over 100k)
IRA payment deduction: $3,148 (reported on 2.8% of returns)
78418:
$3,148
Texas:
$3,120
(% of AGI for various income ranges: 0.5% for AGIs below $10k, 0.2% for AGIs $10k-25k, 0.3% for AGIs $25k-50k, 0.2% for AGIs $50k-75k, 0.1% for AGIs $75k-100k, 0.1% for AGIs over 100k)
Self-employed pension: $15,375 (reported on 0.9% of returns)
Here:
$15,375
Texas:
$16,401
(% of AGI for various income ranges: 0.1% for AGIs $25k-50k, 0.2% for AGIs $50k-75k, 0.1% for AGIs $75k-100k, 0.6% for AGIs over 100k)
Total itemized deductions: $19,059 (19% of AGI, reported on 26.7% of returns)
Here:
$19,059
State:
$19,631
Here:
19.0% of AGI
State:
18.9% of AGI
(% of AGI for various income ranges: 11.1% for AGIs below $10k, 6.7% for AGIs $10k-25k, 9.2% for AGIs $25k-50k, 11.6% for AGIs $50k-75k, 13.2% for AGIs $75k-100k, 10.2% for AGIs over 100k)
Charity contributions deductions: $3,422 (3% of AGI, reported on 22.1% of returns)
Here:
$3,422
State:
$4,753
Here:
3.2% of AGI
State:
4.2% of AGI
(% of AGI for various income ranges: 0.6% for AGIs below $10k, 0.4% for AGIs $10k-25k, 1.0% for AGIs $25k-50k, 1.4% for AGIs $50k-75k, 1.8% for AGIs $75k-100k, 2.1% for AGIs over 100k)
Total tax: $8,570 (reported on 73.8% of returns)
78418:
$8,570
State:
$9,058
(% of AGI for various income ranges: 3.8% for AGIs below $10k, 4.0% for AGIs $10k-25k, 6.5% for AGIs $25k-50k, 9.2% for AGIs $50k-75k, 11.1% for AGIs $75k-100k, 20.4% for AGIs over 100k)
Earned income credit: $1,813 (reported on 19.0% of returns)
Here:
$1,813
State:
$2,024
Percentage of individuals using paid preparers for their 2004 taxes: 49.9%
Here:
50%
State:
57%
(% for various income ranges: 42.3% for AGIs below $10k, 49.4% for AGIs $10k-25k, 49.4% for AGIs $25k-50k, 51.1% for AGIs $50k-75k, 51.9% for AGIs $75k-100k, 65.5% for AGIs over 100k)
Likely homosexual households (counted as self-reported same-sex unmarried-partner households)
Lesbian couples: 0.3% of all households
Gay men: 0.0% of all households
Household received Food Stamps/SNAP in the past 12 months: 1,145 Household did not receive Food Stamps/SNAP in the past 12 months: 11,595
Women who had a birth in the past 12 months: 483 (259 now married, 220 unmarried) Women who did not have a birth in the past 12 months: 5,838 (2,923 now married, 2,904 unmarried)
Housing units in zip code 78418 with a mortgage: 4,921 (115 second mortgage, 85 both second mortgage and home equity loan) Houses without a mortgage: 70
Median monthly owner costs for units with a mortgage: $1,897 Median monthly owner costs for units without a mortgage: $747
Residents with income below the poverty level in 2022:
This zip code:
14.1%
Whole state:
14.0%
Residents with income below 50% of the poverty level in 2022:
This zip code:
8.3%
Whole state:
7.4%
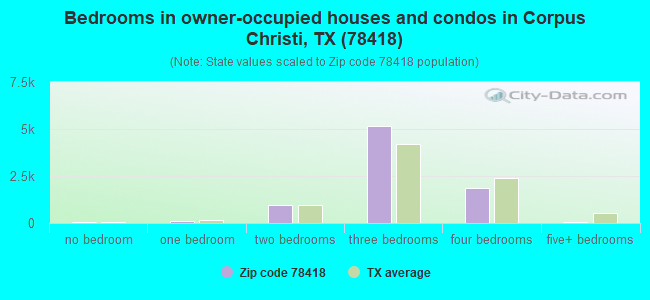
Median number of rooms in houses and condos:
Here:
5.6
State:
6.3
Median number of rooms in apartments:
Here:
4.2
State:
4.0
Notable locations in this zip code not listed on our city pages
Notable locations in zip code 78418: Malaquite Beach Development (A), The Coastway Marina (B), Laguna Marina (C), Land and Sea Marina (D), Marker 37 Marina (E), Puenta Vista Marina (F), Bluff Landing Marina (G), Bob Hall Pier (H), Dunn Ranch -A1541 Novillo Line Camp (I), Light Twentyone (J), Matanza Windmill (K), Range A Front Light (L), Range A Light (M), Nueces County Emergency Services District 2 (N), Corpus Christi Fire Department Station 13 (O), Corpus Christi Fire Department Station 15 (P), Nueces County Rural Fire Protection District 2 (Q). Display/hide their locations on the map
Churches in zip code 78418 include: First Baptist Church Flour Bluff (A), Filipino International Baptist Church (B), Church of Christ in Flour Bluff (C), Saint Andrew by the Sea Catholic Church (D), Waldron Road Baptist Church (E), Primera Iglesia Bautista of Flour Bluff Church (F), Lord of Life Lutheran Church (G), Island Presbyterian Church (H), Saint Peters by the Sea Methodist Church (I). Display/hide their locations on the map
Parks in zip code 78418 include: Waldron Field (1), Retta Place Park (2), Redhead Pond Wildlife Management Area (3), Parker Park (4), Padre Bali Park (5), Mustang Island State Park (6), Wranosky Park (7), Turtle Cove Park (8), Packery Channel Park (9). Display/hide their locations on the map
Tourist attraction (not listed on the city page) : Corpus Christi Area Convention & Visitors Bureau - Padre Island Visitors Information Ce (14252 South Padre Island Drive) (1). Display/hide its approximate location on the map
4,218 married couples with children.
1,663 single-parent households (356 men, 1,307 women).
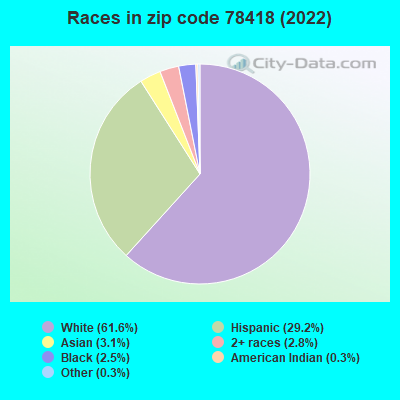
81.2% of residents of 78418 zip code speak English at home.
15.4% of residents speak Spanish at home (82% very well, 16% well, 2% not at all).
1.3% of residents speak other Indo-European language at home (84% very well, 9% well, 7% not well).
2.3% of residents speak Asian or Pacific Island language at home (70% very well, 30% well).
0.1% of residents speak other language at home (77% very well, 9% well, 14% not well).
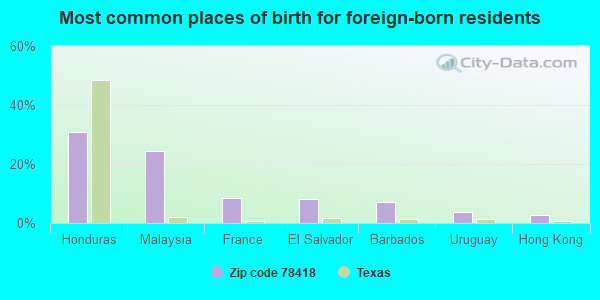
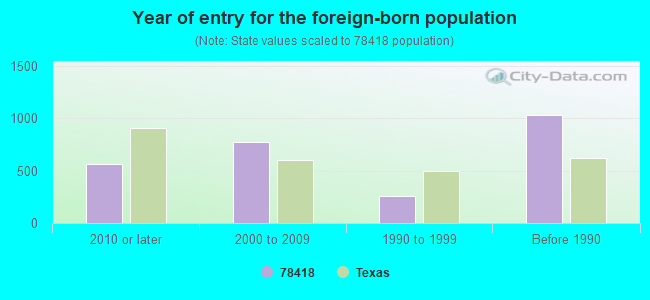
Foreign born population: 2,263 (7.4%) (46.7% of them are naturalized citizens)
Housing units lacking complete plumbing facilities: 1.0% Housing units lacking complete kitchen facilities: 1.5%
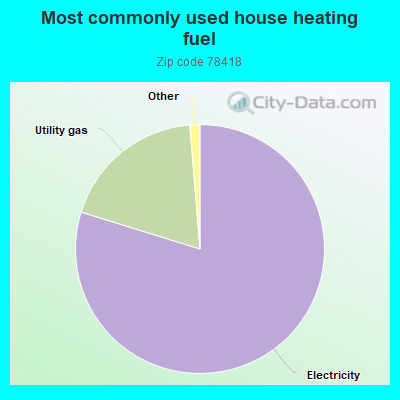
79.8%Electricity
18.9%Utility gas
0.6%Bottled, tank, or LP gas
0.6%No fuel used
Population in 1990: 20,449. Population change in the 1990s: +6,080 (+29.7%).
Place of birth for U.S.-born residents:
This state: 17,857
Northeast: 1,942
Midwest: 2,647
South: 2,736
West: 2,549
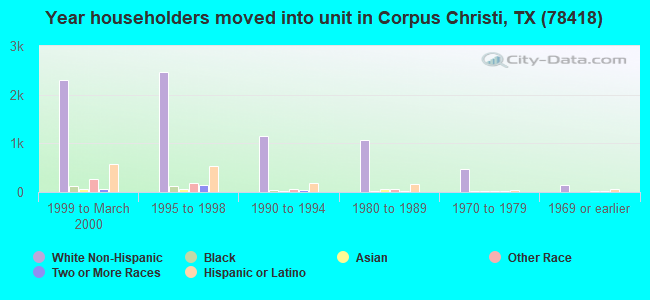
40% of the 78418 zip code residents lived in the same house 5 years ago. Out of people who lived in different houses, 48% lived in this county. Out of people who lived in different counties, 50% lived in Texas.
85% of the 78418 zip code residents lived in the same house 1 year ago. Out of people who lived in different houses, 48% moved from this county. Out of people who lived in different houses, 25% moved from different county within same state. Out of people who lived in different houses, 23% moved from different state. Out of people who lived in different houses, 4% moved from abroad.
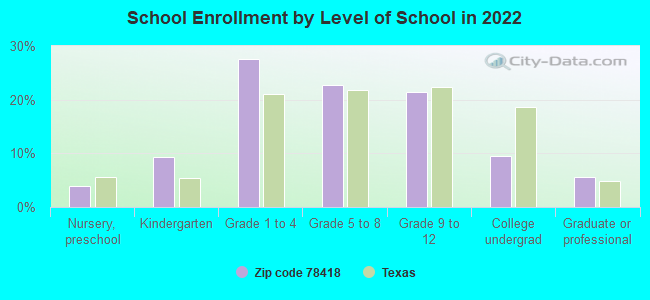
Private vs. public school enrollment:
Students in private schools in grades 1 to 8 (elementary and middle school): 48
Here:
1.3%
Texas:
8.8%
Students in private schools in grades 9 to 12 (high school): 15
Here:
1.0%
Texas:
8.0%
Students in private undergraduate colleges: 73
Here:
10.6%
Texas:
16.2%
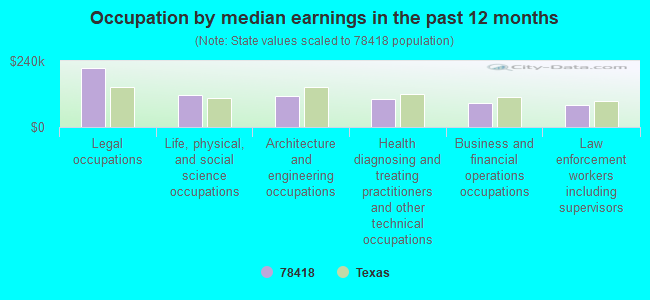
Occupation by median earnings in the past 12 months ($)
213,651Legal occupations
118,007Life, physical, and social science occupations
113,438Architecture and engineering occupations
102,707Health diagnosing and treating practitioners and other technical occupations
87,643Business and financial operations occupations
81,330Law enforcement workers including supervisors
Companies with biggest federal contracts located in this zip code (CORPUS CHRISTI, TX):
THE GABRIEL GROUP, INC (1129 MONTREAL DRIVE; small business) : $5,900,486 in 24 contractsfrom 2000 to 2006
Contracts for Library Services, Other Housekeeping Services by Army, Air Force Signed by year:2000: $648,135; 2001: $0; 2002: $1,109,822; 2003: $1,101,652; 2004: $1,221,507; 2005: $1,818,323; 2006: $1,047.
Biggest contracts:
$1,250,000 with Army for Library Services. Signed on 2005-12-29. Completion date: 2010-12-31.
$936,991, same as above.Signed on 2004-10-01. Completion date: 2005-09-30.
$814,603, same as above.Signed on 2003-10-01. Completion date: 2004-09-30.
$798,655, same as above.Signed on 2002-10-02. Completion date: 2001-09-30.
THIRD COAST FOOD SERVICES INC (1945 FLOUR BLUFF DR; small business) : $2,449,344 in 34 contractsfrom 2000 to 2006
Contracts for Food Services, Composite Food Packages, Condiments and Related Products, Perishable Subsistence $10k To $25K, and moreby Navy, Army Signed by year:2000: $27,972; 2001: $0; 2002: $794,048; 2003: $758,857; 2004: $743,768; 2005: $65,295; 2006: $59,404.
Biggest contracts:
$752,508 with Navy for Food Services. Signed on 2002-10-01. Completion date: 2003-09-30.
$752,508, same as above.Signed on 2003-10-22. Completion date: 2004-09-30.
$729,687, same as above.Signed on 2004-08-24. Completion date: 2003-09-30.
$27,972 with Army for Composite Food Packages. Signed on 2000-02-18. Completion date: 2000-02-20.
THE LC FOUNDATION, INC (222 NAS DRIVE) : $2,430,367 in 38 contractsfrom 1999 to 2005
Contracts for Custodial Janitorial Services by Navy Signed by year:2000: $700,594; 2001: $795,412; 2002: $38,610; 2003: $0; 2004: $0; 2005: $111,825; 2006: $0.
Biggest contracts:
$717,585 with Navy for Custodial Janitorial Services. Signed on 1999-12-23. Completion date: 2000-12-24.
$620,594, same as above.Signed on 2000-12-20. Completion date: 2000-12-24.
$421,566, same as above.Signed on 2001-12-20. Completion date: 2002-12-26.
$180,000, same as above.Signed on 2001-01-29. Completion date: 2000-12-24.
A/C & R SERVICES OF SOUTH TEXA (2134 FLOUR BLUFF DRIVE; small business) : $2,216,671 in 12 contractsfrom 2005 to 2006
Contracts for Maintenance, Repair and Rebuilding of Equipment -- Refrigeration, Air Conditioning, and Air Circulating Equipment by Air Force Signed by year:2000: $0; 2001: $0; 2002: $0; 2003: $0; 2004: $0; 2005: $2,030,628; 2006: $186,043.
Biggest contracts:
$1,423,452 with Air Force for Maintenance, Repair and Rebuilding of Equipment -- Refrigeration, Air Conditioning, and Air Circulating Equipment. Taking place in ME. Signed on 2005-11-29. Completion date: 2006-11-30.
$465,304 with Air Force for Maintenance, Repair and Rebuilding of Equipment -- Refrigeration, Air Conditioning, and Air Circulating Equipment. Taking place in CA. Signed on 2005-10-01. Completion date: 2006-09-30.
$169,280 with Air Force for Maintenance, Repair and Rebuilding of Equipment -- Refrigeration, Air Conditioning, and Air Circulating Equipment. Taking place in AK. Signed on 2006-04-12. Completion date: 2007-03-31.
$141,872, same as above.Signed on 2005-04-28. Completion date: 2006-03-31.
SALVATION ARMY, THE* (NONE) : $445,665 in 15 contractsfrom 2000 to 2003
Contracts for Nursing Home Care Contracts by Department of Veterans Affairs Signed by year:2000: $129,000; 2001: $105,000; 2002: $113,845; 2003: $97,820; 2004: $0; 2005: $0; 2006: $0.
Biggest contracts:
$53,000 with Department of Veterans Affairs for Nursing Home Care Contracts. Taking place in GA. Signed on 2000-02-15. Completion date: 2000-03-15.
$37,748 with Department of Veterans Affairs for Nursing Home Care Contracts. Signed on 2003-01-15. Completion date: 2003-03-15.
$34,527, same as above.Signed on 2003-07-15. Completion date: 2003-09-15.
$33,845, same as above.Signed on 2002-10-15. Completion date: 2002-12-15.
ISLAND BOTANICS ENVIRONMENTAL (3732 FLOUR BLUFF DR; small business) : $215,500 in 5 contractsfrom 2000 to 2005
Contracts for Other Environmental Services, Studies, and Analytical Support, Other Management Support Services, Landscaping/Groundskeeping Services by Navy Signed by year:2000: $28,000; 2001: $73,500; 2002: $18,000; 2003: $73,000; 2004: $0; 2005: $23,000; 2006: $0.
Biggest contracts:
$73,500 with Navy for Other Environmental Services, Studies, and Analytical Support. Signed on 2001-04-10. Completion date: 2001-10-05.
$73,000 with Navy for Other Management Support Services. Taking place in FL. Signed on 2003-04-30. Completion date: 2003-10-28.
$28,000 with Navy for Other Environmental Services, Studies, and Analytical Support. Signed on 2000-07-27. Completion date: 2001-01-31.
$23,000 with Navy for Landscaping/Groundskeeping Services. Signed on 2005-05-27. Completion date: 2005-11-20.
CUSTOM SECURITY SYSTEMS (2224 WALDRON RD; small business) : $88,780 in 8 contractsfrom 2004 to 2005
Contracts for Technical Representation Services -- Automatic Data Processing Equipment (Including Firmware), Software, Supplies and Support Equipment, Miscellaneous Items, Communications Security Equipment and Components, Miscellaneous Alarm, Signal and Security Detection Systems, and moreby Defense Logistics Agency, Navy Signed by year:2000: $0; 2001: $0; 2002: $0; 2003: $0; 2004: $20,703; 2005: $68,077; 2006: $0.
Biggest contracts:
$39,300 with Defense Logistics Agency for Technical Representation Services -- Automatic Data Processing Equipment (Including Firmware), Software, Supplies and Support Equipment. Signed on 2005-10-25. Completion date: 2006-09-30.
$26,200 with Defense Logistics Agency for Miscellaneous Items. Signed on 2005-04-28. Completion date: 2005-06-30.
$9,825, same as above.Signed on 2004-10-01. Completion date: 2004-10-30.
$3,986 with Navy for Communications Security Equipment and Components. Signed on 2004-09-17. Completion date: 2004-09-28.
MALLOY COMMUNICATIONS (3134 MEADOW RIDGE DR; small business) : $85,418 in 2 contractsfrom 2004 to 2006
$85,168 with Army for Radio and Television Communication Equipment, Airborne. Signed on 2004-09-14. Completion date: 2004-11-30.
$250 with Army for Maintenance, Repair and Rebuilding of Equipment -- Communication, Detection, and Coherent Radiation Equipment. Signed on 2006-05-08. Completion date: 2006-05-09.
BROUGH, JOHN (14002 HAWKSNEST BAY DR; small business) : $23,043 in 5 contractsfrom 2004 to 2006
Contracts for Hazard-Detecting Instruments and Apparatus, Maintenance, Repair and Rebuilding of Equipment -- Instruments and Laboratory Equipment, Fire Control Computing Sights and Devices, Maintenance, Repair and Rebuilding of Equipment -- Maintenance and Repair Shop Equipment by Army, Navy Signed by year:2000: $0; 2001: $0; 2002: $0; 2003: $0; 2004: $13,280; 2005: $6,795; 2006: $2,968.
Biggest contracts:
$13,280 with Army for Hazard-Detecting Instruments and Apparatus. Signed on 2004-05-17. Completion date: 2004-05-21.
$4,000 with Army for Maintenance, Repair and Rebuilding of Equipment -- Instruments and Laboratory Equipment. Signed on 2006-04-28. Completion date: 2007-04-29.
$3,795 with Navy for Fire Control Computing Sights and Devices. Signed on 2005-09-26. Completion date: 2005-10-07.
$3,000 with Army for Maintenance, Repair and Rebuilding of Equipment -- Maintenance and Repair Shop Equipment. Signed on 2005-01-05. Completion date: 2005-01-10.
JAMES M TOZER, M D (9853 COMPTON ROAD; small business) : $16,439 in 5 contractsfrom 2002 to 2005
Contracts for General Health Care Services by Army Signed by year:2000: $0; 2001: $0; 2002: $16,999; 2003: $11,999; 2004: $12,000; 2005: -$24,559; 2006: $0.
Biggest contracts:
$16,999 with Army for General Health Care Services. Signed on 2002-11-04. Completion date: 2003-09-30.
$12,000, same as above.Signed on 2004-10-06. Completion date: 2005-09-30.
$11,999, same as above.Signed on 2003-11-04. Completion date: 2003-09-30.
$0, same as above.Signed on 2002-11-04. Completion date: 2003-09-30.
Top industries in this zip code by the number of employees in 2005:
Administrative and Support and Waste Management and Remediation Services: Telemarketing Bureaus (100-249: 1, 5-9: 1)
Administrative and Support and Waste Management and Remediation Services: Temporary Help Services (100-249: 1)
Other Services (except Public Administration): Other Similar Organizations (except Business, Professional, Labor, and Political Organizations) (20-49: 1, 10-19: 4, 5-9: 3, 1-4: 5)
Accommodation and Food Services: Hotels (except Casino Hotels) and Motels (50-99: 1, 10-19: 2)
2002 - 2018 National Fire Incident Reporting System (NFIRS) incidents
Based on the data from the years 2002 - 2018 the average number of fire incidents per year is 212. The highest number of reported fires - 290 took place in 2005, and the least - 148 in 2014. The data has a declining trend.
When looking into fire subcategories, the most incidents belonged to: Outside Fires (55.2%), and Structure Fires (25.6%).
Fire incident types reported to NFIRS in Zip Code 78418


 Nearest zip codes: 78419, 78412, 78414, 78413, 78411, 78404.
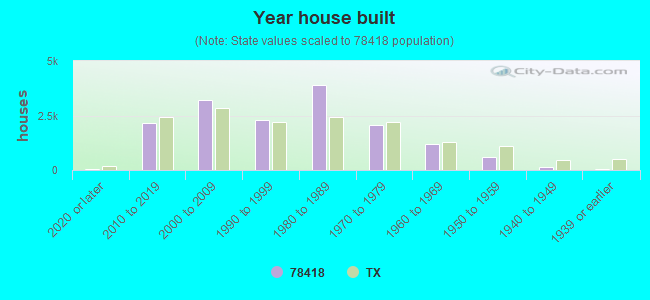


 : $5,900,486 in 24 contracts from 2000 to 2006

 Based on the data from the years 2002 - 2018 the average number of fire incidents per year is 212. The highest number of reported fires - 290 took place in 2005, and the least - 148 in 2014. The data has a declining trend.
 When looking into fire subcategories, the most incidents belonged to: Outside Fires (55.2%), and Structure Fires (25.6%).