Estimated zip code population in 2022: 62,639 Zip code population in 2010: 48,703 Zip code population in 2000: 32,807
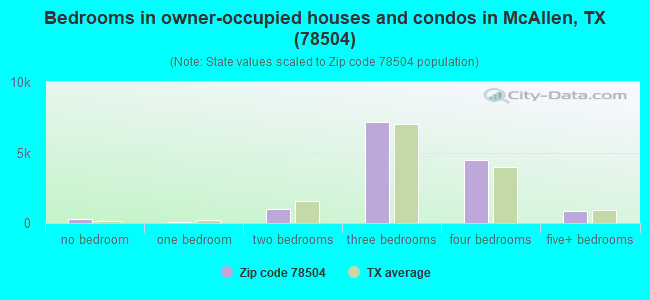
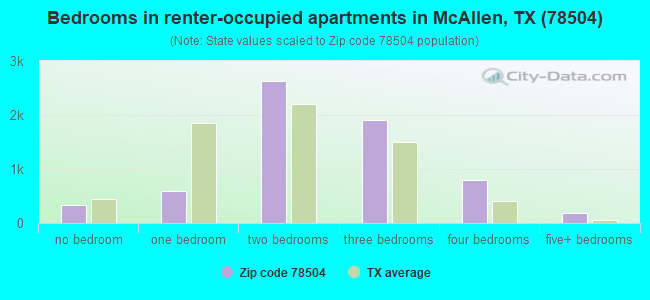
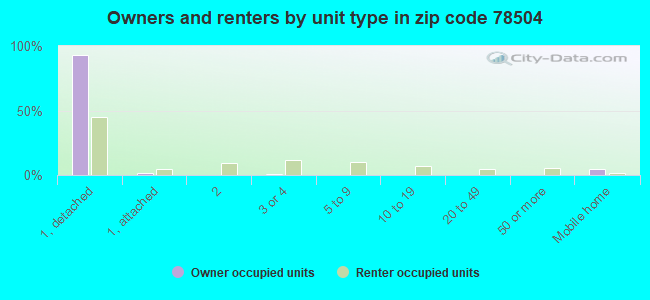
Houses and condos: 21,666 Renter-occupied apartments: 6,476
% of renters here:
32%
State:
38%
March 2022 cost of living index in zip code 78504: 82.4 (low, U.S. average is 100)
Land area: 17.7 sq. mi. Water area: 0.0 sq. mi.
Population density: 3,543 people per square mile
(average).
OSM Map
General Map
Google Map
MSN Map
OSM Map
General Map
Google Map
MSN Map
OSM Map
General Map
Google Map
MSN Map
OSM Map
General Map
Google Map
MSN Map
Please wait while loading the map...
Real estate property taxes paid for housing units in 2022:
This zip code:
1.8% ($3,680)
Texas:
1.5% ($4,050)
Median real estate property taxes paid for housing units with mortgages in 2022: $3,865 (1.7%) Median real estate property taxes paid for housing units with no mortgage in 2022: $3,382 (1.9%)
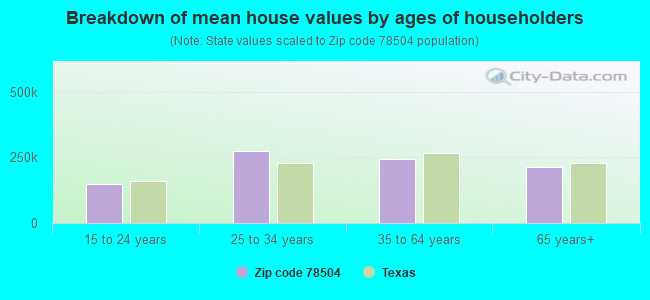
Estimated median house/condo value in 2022: $210,021
78504:
$210,021
Texas:
$275,400
According to our research of Texas and other state lists, there were 84 registered sex offenders living in 78504 zip code as of May 08, 2024. The ratio of all residents to sex offenders in zip code 78504 is 634 to 1. The ratio of registered sex offenders to all residents in this zip code is lower than the state average.
Median resident age:
This zip code:
31.5 years
Texas median age:
35.6 years
Average household size:
This zip code:
3.1 people
Texas:
2.6 people
Averages for the 2020 tax year for zip code 78504, filed in 2021:
Average Adjusted Gross Income (AGI) in 2020: $69,235 (Individual Income Tax Returns)
Here:
$69,235
State:
$77,054
Salary/wage: $57,793 (reported on 83.3% of returns)
Here:
$57,793
State:
$62,766
(% of AGI for various income ranges: 1132.5% for AGIs below $25k, 3490.8% for AGIs $25k-50k, 6556.8% for AGIs $50k-75k, 9905.2% for AGIs $75k-100k, 17889.0% for AGIs $100k-200k, 85001.6% for AGIs over 200k)
Taxable interest for individuals: $3,146 (reported on 17.9% of returns)
This zip code:
$3,146
Texas:
$2,665
(% of AGI for various income ranges: 10.0% for AGIs below $25k, 17.3% for AGIs $25k-50k, 27.0% for AGIs $50k-75k, 48.3% for AGIs $75k-100k, 84.9% for AGIs $100k-200k, 2913.1% for AGIs over 200k)
Ordinary dividends: $8,254 (reported on 10.1% of returns)
Here:
$8,254
State:
$10,044
(% of AGI for various income ranges: 8.6% for AGIs below $25k, 16.0% for AGIs $25k-50k, 34.1% for AGIs $50k-75k, 59.9% for AGIs $75k-100k, 195.5% for AGIs $100k-200k, 4246.6% for AGIs over 200k)
Net capital gain/loss in AGI: +$22,787 (reported on 10.9% of returns)
Here:
+$22,787
State:
+$39,590
(% of AGI for various income ranges: 9.6% for AGIs below $25k, 22.4% for AGIs $25k-50k, 38.8% for AGIs $50k-75k, 129.1% for AGIs $75k-100k, 306.0% for AGIs $100k-200k, 15845.0% for AGIs over 200k)
Profit/loss from business: +$11,706 (reported on 25.0% of returns)
Here:
+$11,706
State:
+$10,888
(% of AGI for various income ranges: 173.8% for AGIs below $25k, 121.5% for AGIs $25k-50k, 111.5% for AGIs $50k-75k, 149.6% for AGIs $75k-100k, 645.7% for AGIs $100k-200k, 11360.3% for AGIs over 200k)
Taxable individual retirement arrangement distribution: $19,473 (reported on 3.8% of returns)
78504:
$19,473
Texas:
$24,740
(% of AGI for various income ranges: 15.8% for AGIs below $25k, 35.3% for AGIs $25k-50k, 93.7% for AGIs $50k-75k, 173.0% for AGIs $75k-100k, 313.7% for AGIs $100k-200k, 1421.9% for AGIs over 200k)
Self-employed (Keogh) retirement plans: $29,433 (reported on 0.4% of returns)
78504:
$29,433
Texas:
$29,298
(% of AGI for various income ranges: 20.3% for AGIs $100k-200k, 704.7% for AGIs over 200k)
Total itemized deductions: $38,138 (reported on 6.3% of returns)
Here:
$38,138
State:
$40,428
(% of AGI for various income ranges: 25.8% for AGIs below $25k, 93.3% for AGIs $25k-50k, 302.0% for AGIs $50k-75k, 408.3% for AGIs $75k-100k, 709.2% for AGIs $100k-200k, 7895.3% for AGIs over 200k)
Charity contributions: $16,681 (reported on 4.9% of returns)
Here:
$16,681
State:
$18,201
(% of AGI for various income ranges: 3.5% for AGIs below $25k, 14.4% for AGIs $25k-50k, 51.2% for AGIs $50k-75k, 88.7% for AGIs $75k-100k, 190.8% for AGIs $100k-200k, 4072.5% for AGIs over 200k)
Taxes paid: $7,757 (reported on 6.0% of returns)
78504:
$7,757
State:
$7,821
(% of AGI for various income ranges: 6.0% for AGIs below $25k, 23.1% for AGIs $25k-50k, 73.2% for AGIs $50k-75k, 99.5% for AGIs $75k-100k, 170.4% for AGIs $100k-200k, 1000.6% for AGIs over 200k)
Earned income credit: $2,642 (reported on 23.5% of returns)
Here:
$2,642
State:
$2,584
(% of AGI for various income ranges: 143.2% for AGIs below $25k, 106.6% for AGIs $25k-50k, 1.8% for AGIs $50k-75k)
Percentage of individuals using paid preparers for their 2020 taxes: 91.0%
Here:
91%
State:
92%
(% for various income ranges: 90.2% for AGIs below $25k, 92.5% for AGIs $25k-50k, 91.6% for AGIs $50k-75k, 90.5% for AGIs $75k-100k, 90.7% for AGIs $100k-200k, 89.4% for AGIs over 200k)
Averages for the 2012 tax year for zip code 78504, filed in 2013:
Average Adjusted Gross Income (AGI) in 2012: $63,441 (Individual Income Tax Returns)
Here:
$63,441
State:
$65,384
Salary/wage: $51,697 (reported on 85.5% of returns)
Here:
$51,697
State:
$52,524
(% of AGI for various income ranges: 77.3% for AGIs below $25k, 85.9% for AGIs $25k-50k, 84.1% for AGIs $50k-75k, 83.9% for AGIs $75k-100k, 80.9% for AGIs $100k-200k, 40.9% for AGIs over 200k)
Taxable interest for individuals: $2,759 (reported on 21.4% of returns)
This zip code:
$2,759
Texas:
$2,372
(% of AGI for various income ranges: 0.7% for AGIs below $25k, 0.4% for AGIs $25k-50k, 0.4% for AGIs $50k-75k, 0.6% for AGIs $75k-100k, 0.7% for AGIs $100k-200k, 1.7% for AGIs over 200k)
Ordinary dividends: $7,540 (reported on 10.5% of returns)
Here:
$7,540
State:
$9,721
(% of AGI for various income ranges: 0.6% for AGIs below $25k, 0.5% for AGIs $25k-50k, 0.5% for AGIs $50k-75k, 0.4% for AGIs $75k-100k, 0.7% for AGIs $100k-200k, 2.8% for AGIs over 200k)
Net capital gain/loss in AGI: +$19,794 (reported on 9.2% of returns)
Here:
+$19,794
State:
+$35,319
(% of AGI for various income ranges: 0.1% for AGIs below $25k, 0.2% for AGIs $25k-50k, 0.5% for AGIs $50k-75k, 0.5% for AGIs $75k-100k, 1.6% for AGIs $100k-200k, 7.5% for AGIs over 200k)
Profit/loss from business: +$16,190 (reported on 24.2% of returns)
Here:
+$16,190
State:
+$13,732
(% of AGI for various income ranges: 15.3% for AGIs below $25k, 3.9% for AGIs $25k-50k, 3.1% for AGIs $50k-75k, 3.2% for AGIs $75k-100k, 3.8% for AGIs $100k-200k, 8.9% for AGIs over 200k)
Taxable individual retirement arrangement distribution: $16,591 (reported on 4.3% of returns)
78504:
$16,591
Texas:
$19,511
(% of AGI for various income ranges: 0.8% for AGIs below $25k, 1.1% for AGIs $25k-50k, 1.4% for AGIs $50k-75k, 1.3% for AGIs $75k-100k, 1.5% for AGIs $100k-200k, 0.7% for AGIs over 200k)
Self-employment retirement plans: $21,230 (reported on 0.5% of returns)
78504:
$21,230
Texas:
$23,938
Total itemized deductions: $22,889 (18% of AGI, reported on 29.5% of returns)
Here:
$22,889
State:
$24,724
Here:
18.0% of AGI
State:
15.9% of AGI
(% of AGI for various income ranges: 5.7% for AGIs below $25k, 12.5% for AGIs $25k-50k, 14.1% for AGIs $50k-75k, 13.6% for AGIs $75k-100k, 11.8% for AGIs $100k-200k, 7.8% for AGIs over 200k)
Charity contributions: $4,750 (reported on 22.1% of returns)
Here:
$4,750
State:
$6,808
(% of AGI for various income ranges: 0.3% for AGIs below $25k, 1.1% for AGIs $25k-50k, 1.5% for AGIs $50k-75k, 1.6% for AGIs $75k-100k, 2.0% for AGIs $100k-200k, 2.0% for AGIs over 200k)
Taxes paid: $6,132 (reported on 28.8% of returns)
78504:
$6,132
State:
$6,921
(% of AGI for various income ranges: 1.3% for AGIs below $25k, 3.0% for AGIs $25k-50k, 3.2% for AGIs $50k-75k, 3.4% for AGIs $75k-100k, 3.4% for AGIs $100k-200k, 2.1% for AGIs over 200k)
Earned income credit: $2,752 (reported on 27.2% of returns)
Here:
$2,752
State:
$2,570
(% of AGI for various income ranges: 11.7% for AGIs below $25k, 1.8% for AGIs $25k-50k)
Percentage of individuals using paid preparers for their 2012 taxes: 61.6%
Here:
62%
State:
51%
(% for various income ranges: 59.1% for AGIs below $25k, 58.9% for AGIs $25k-50k, 61.1% for AGIs $50k-75k, 63.5% for AGIs $75k-100k, 66.2% for AGIs $100k-200k, 89.5% for AGIs over 200k)
Averages for the 2004 tax year for zip code 78504, filed in 2005:
Average Adjusted Gross Income (AGI) in 2004: $54,431 (Individual Income Tax Returns)
Here:
$54,431
State:
$47,881
Salary/wage: $46,347 (reported on 86.2% of returns)
Here:
$46,347
State:
$41,947
(% of AGI for various income ranges: 278.8% for AGIs below $10k, 83.0% for AGIs $10k-25k, 89.1% for AGIs $25k-50k, 87.7% for AGIs $50k-75k, 86.1% for AGIs $75k-100k, 57.4% for AGIs over 100k)
Taxable interest for individuals: $2,356 (reported on 31.5% of returns)
This zip code:
$2,356
Texas:
$2,255
(% of AGI for various income ranges: 15.5% for AGIs below $10k, 1.5% for AGIs $10k-25k, 0.9% for AGIs $25k-50k, 1.0% for AGIs $50k-75k, 0.7% for AGIs $75k-100k, 1.6% for AGIs over 100k)
Taxable dividends: $3,964 (reported on 14.9% of returns)
Here:
$3,964
State:
$4,261
(% of AGI for various income ranges: 6.1% for AGIs below $10k, 0.7% for AGIs $10k-25k, 0.5% for AGIs $25k-50k, 0.6% for AGIs $50k-75k, 0.8% for AGIs $75k-100k, 1.5% for AGIs over 100k)
Net capital gain/loss: +$20,593 (reported on 13.2% of returns)
Here:
+$20,593
State:
+$16,110
(% of AGI for various income ranges: 3.4% for AGIs below $10k, 0.6% for AGIs $10k-25k, 0.4% for AGIs $25k-50k, 0.6% for AGIs $50k-75k, 1.1% for AGIs $75k-100k, 9.4% for AGIs over 100k)
Profit/loss from business: +$14,833 (reported on 22.7% of returns)
Here:
+$14,833
State:
+$11,013
(% of AGI for various income ranges: 18.9% for AGIs below $10k, 9.3% for AGIs $10k-25k, 2.8% for AGIs $25k-50k, 3.1% for AGIs $50k-75k, 3.1% for AGIs $75k-100k, 8.3% for AGIs over 100k)
IRA payment deduction: $3,718 (reported on 2.8% of returns)
78504:
$3,718
Texas:
$3,120
(% of AGI for various income ranges: 0.7% for AGIs below $10k, 0.1% for AGIs $10k-25k, 0.2% for AGIs $25k-50k, 0.2% for AGIs $50k-75k, 0.2% for AGIs $75k-100k, 0.2% for AGIs over 100k)
Self-employed pension: $18,415 (reported on 0.8% of returns)
Here:
$18,415
Texas:
$16,401
Total itemized deductions: $19,443 (20% of AGI, reported on 31.5% of returns)
Here:
$19,443
State:
$19,631
Here:
19.9% of AGI
State:
18.9% of AGI
(% of AGI for various income ranges: 17.5% for AGIs below $10k, 7.2% for AGIs $10k-25k, 13.9% for AGIs $25k-50k, 15.3% for AGIs $50k-75k, 14.0% for AGIs $75k-100k, 9.1% for AGIs over 100k)
Charity contributions deductions: $4,257 (4% of AGI, reported on 25.8% of returns)
Here:
$4,257
State:
$4,753
Here:
4.1% of AGI
State:
4.2% of AGI
(% of AGI for various income ranges: 0.9% for AGIs below $10k, 0.7% for AGIs $10k-25k, 1.4% for AGIs $25k-50k, 2.0% for AGIs $50k-75k, 2.2% for AGIs $75k-100k, 2.4% for AGIs over 100k)
Total tax: $11,131 (reported on 69.5% of returns)
78504:
$11,131
State:
$9,058
(% of AGI for various income ranges: 12.9% for AGIs below $10k, 3.7% for AGIs $10k-25k, 5.8% for AGIs $25k-50k, 8.2% for AGIs $50k-75k, 10.1% for AGIs $75k-100k, 21.1% for AGIs over 100k)
Earned income credit: $2,193 (reported on 24.4% of returns)
Here:
$2,193
State:
$2,024
Percentage of individuals using paid preparers for their 2004 taxes: 65.8%
Here:
66%
State:
57%
(% for various income ranges: 61.0% for AGIs below $10k, 70.3% for AGIs $10k-25k, 63.9% for AGIs $25k-50k, 62.2% for AGIs $50k-75k, 61.2% for AGIs $75k-100k, 75.7% for AGIs over 100k)
Likely homosexual households (counted as self-reported same-sex unmarried-partner households)
Lesbian couples: 0.1% of all households
Gay men: 0.4% of all households
Household received Food Stamps/SNAP in the past 12 months: 3,330 Household did not receive Food Stamps/SNAP in the past 12 months: 16,960
Women who had a birth in the past 12 months: 1,068 (988 now married, 94 unmarried) Women who did not have a birth in the past 12 months: 15,286 (6,576 now married, 8,714 unmarried)
Housing units in zip code 78504 with a mortgage: 8,211 (156 second mortgage, 114 both second mortgage and home equity loan) Houses without a mortgage: 51
Median monthly owner costs for units with a mortgage: $1,612 Median monthly owner costs for units without a mortgage: $594
Residents with income below the poverty level in 2022:
This zip code:
12.4%
Whole state:
14.0%
Residents with income below 50% of the poverty level in 2022:
This zip code:
8.5%
Whole state:
7.4%
Median number of rooms in houses and condos:
Here:
6.0
State:
6.3
Median number of rooms in apartments:
Here:
4.4
State:
4.0
Notable locations in this zip code not listed on our city pages
Notable locations in zip code 78504: McAllen Fire Department Station 5 (A), McAllen International Museum (B), Palm Valley Emergency Medical Services (C), Oxygen Ambulance Service (D), Royalty Ambulance Services (E). Display/hide their locations on the map
Churches in zip code 78504 include: Crosspoint Fellowship Baptist Church (A), Buckner Baptist Benevolences Church (B), United Methodist Church (C). Display/hide their locations on the map
Tourist attractions (not listed on the city page) : Art Connection Center (Museums; 5401 North 10th Street Suite 109B), Azteca Mexico Tours (Tours & Charters; 711 Nolana Street Suite 202D).
In group quarters: 9 (-1 institutionalized population)
Size of family households: 4,979 2-persons, 3,864 3-persons, 3,619 4-persons, 2,728 5-persons, 407 6-persons, 519 7-or-more-persons
Size of nonfamily households: 3,062 1-person, 896 2-persons, 20 4-persons
11,803 married couples with children.
4,614 single-parent households (1,719 men, 2,895 women).
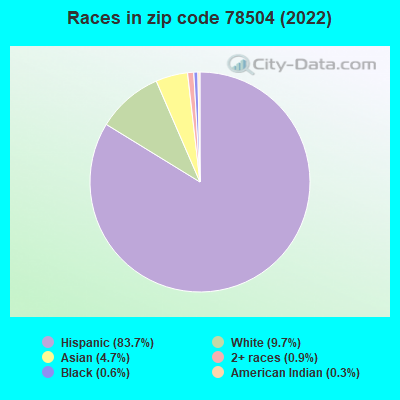
32.1% of residents of 78504 zip code speak English at home.
64.1% of residents speak Spanish at home (71% very well, 14% well, 6% not well, 9% not at all).
0.6% of residents speak other Indo-European language at home (78% very well, 20% well, 2% not well).
3.1% of residents speak Asian or Pacific Island language at home (73% very well, 21% well, 7% not well).
0.2% of residents speak other language at home (50% very well, 12% well, 27% not well, 11% not at all).
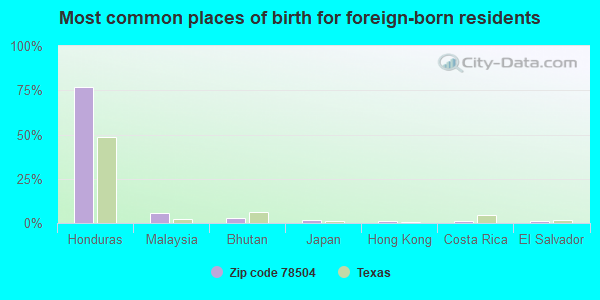
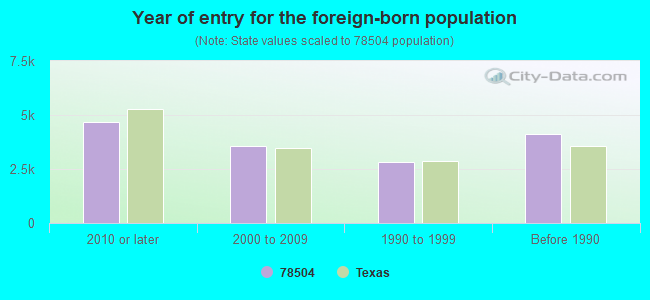
Foreign born population: 14,113 (22.5%) (49.0% of them are naturalized citizens)
Housing units lacking complete plumbing facilities: 1.2% Housing units lacking complete kitchen facilities: 1.1%
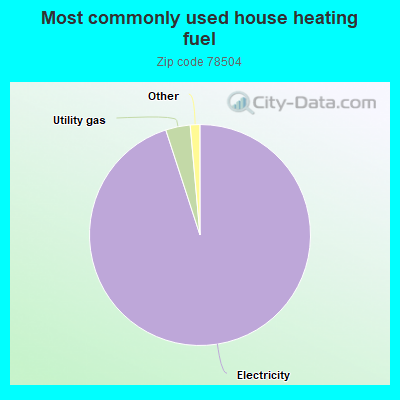
95.0%Electricity
3.6%Utility gas
0.7%Bottled, tank, or LP gas
0.6%No fuel used
Population in 1990: 15,182. Population change in the 1990s: +17,625 (+116.1%).
Place of birth for U.S.-born residents:
This state: 40,043
Northeast: 601
Midwest: 2,440
South: 1,731
West: 2,301
50% of the 78504 zip code residents lived in the same house 5 years ago. Out of people who lived in different houses, 63% lived in this county. Out of people who lived in different counties, 50% lived in Texas.
91% of the 78504 zip code residents lived in the same house 1 year ago. Out of people who lived in different houses, 67% moved from this county. Out of people who lived in different houses, 9% moved from different county within same state. Out of people who lived in different houses, 12% moved from different state. Out of people who lived in different houses, 11% moved from abroad.
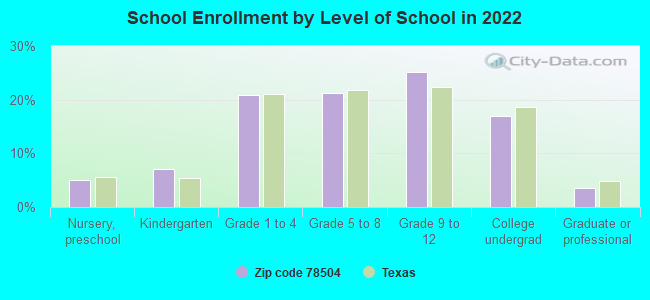
Private vs. public school enrollment:
Students in private schools in grades 1 to 8 (elementary and middle school): 793
Here:
9.6%
Texas:
8.8%
Students in private schools in grades 9 to 12 (high school): 130
Here:
2.6%
Texas:
8.0%
Students in private undergraduate colleges: 221
Here:
6.7%
Texas:
16.2%
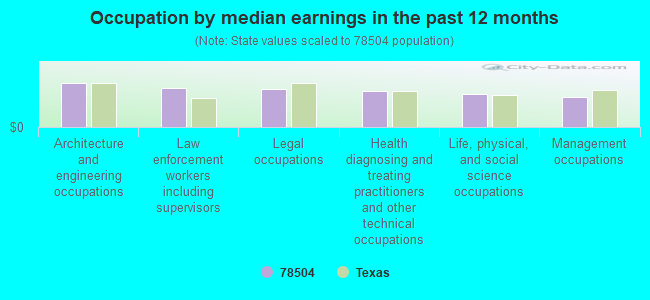
Occupation by median earnings in the past 12 months ($)
103,044Architecture and engineering occupations
91,646Law enforcement workers including supervisors
89,448Legal occupations
84,796Health diagnosing and treating practitioners and other technical occupations
78,451Life, physical, and social science occupations
70,590Management occupations
Companies with federal contracts located in this zip code (MCALLEN, TX):
DESCON CONSTRUCTION, L P (5801 NORTH 10TH, SUITE 600; small business) : $8,111,267 in 26 contractsfrom 1999 to 2002
Contracts for Construction of Structures and Facilities -- Other Administrative Facilities and Service Buildings, Construction of Structures and Facilities -- Miscellaneous Buildings, Maintenance, Repair or Alteration of Real Property -- Other Administrative Facilities and Service Buildings by Air Force Signed by year:2000: $5,125,216; 2001: $2,800,841; 2002: $30,878; 2003: $0; 2004: $0; 2005: $0; 2006: $0.
Biggest contracts:
$1,400,000 with Air Force for Construction of Structures and Facilities -- Other Administrative Facilities and Service Buildings. Signed on 2001-05-03. Completion date: 2001-08-30.
$1,275,000 with Air Force for Construction of Structures and Facilities -- Other Administrative Facilities and Service Buildings. Taking place in NC. Signed on 2000-09-26. Completion date: 2000-11-15.
$675,000 with Air Force for Construction of Structures and Facilities -- Miscellaneous Buildings. Taking place in CA. Signed on 2000-03-03. Completion date: 2000-03-01.
$643,654 with Air Force for Construction of Structures and Facilities -- Other Administrative Facilities and Service Buildings. Taking place in NC. Signed on 2000-09-26. Completion date: 2000-11-15.
PERENNIAL PRODUCE (7601 N WARE RD; small business) : $766,441 in 34 contractsfrom 2004 to 2006
Contracts for Fruits and Vegetables by Defense Logistics Agency Signed by year:2000: $0; 2001: $0; 2002: $0; 2003: $0; 2004: $166,752; 2005: $417,365; 2006: $182,324.
Biggest contracts:
$80,057 with Defense Logistics Agency for Fruits and Vegetables. Signed on 2006-04-27. Completion date: 2006-04-27.
$45,445, same as above.Signed on 2005-05-05. Completion date: 2005-05-05.
$33,908, same as above.Signed on 2004-11-10. Completion date: 2004-11-10.
$30,512, same as above.Signed on 2005-05-25. Completion date: 2005-05-25.
CHRIS HINOJOSA (414 EAST DOVE; small business) : $389,757 in 6 contractsin 2000
Contracts for Policy Review/Development Services, Library Services by Army Signed by year:2000: $389,757; 2001: $0; 2002: $0; 2003: $0; 2004: $0; 2005: $0; 2006: $0.
Biggest contracts:
$65,000 with Army for Policy Review/Development Services. Signed on 2000-04-27. Completion date: 2000-05-31.
$65,000 with Army for Library Services. Signed on 2000-09-01. Completion date: 2000-09-30.
$65,000 with Army for Policy Review/Development Services. Signed on 2000-03-01. Completion date: 2000-03-31.
$65,000, same as above.Signed on 2000-06-05. Completion date: 2000-06-30.
KAPURS INTERNATIONALS INCORPOR (5204 N 26TH ST; small business) : $221,195 in 5 contractsin 2005
Contracts for Badges and Insignia by Defense Logistics Agency Signed by year:2000: $0; 2001: $0; 2002: $0; 2003: $0; 2004: $0; 2005: $221,195; 2006: $0.
Biggest contracts:
$55,640 with Defense Logistics Agency for Badges and Insignia. Signed on 2005-05-02. Completion date: 2006-04-24.
$55,120, same as above.Signed on 2005-06-21. Completion date: 2006-04-24.
$55,055, same as above.Signed on 2005-06-13. Completion date: 2006-04-24.
$52,520, same as above.Signed on 2005-06-22. Completion date: 2006-04-24.
CONTENTO COMPANY INC (515 NOLANA ST STE C; small business) : $81,387 in 4 contractsfrom 2004 to 2005
$62,683 with Army for Food Services. Signed on 2005-02-23. Completion date: 2005-05-26.
$9,835, same as above.Signed on 2005-01-19. Completion date: 2005-03-07.
$5,360, same as above.Signed on 2004-07-09. Completion date: 2004-06-19.
$3,509, same as above.Signed on 2005-03-18. Completion date: 2005-05-26.
LAUVER, JOHN (9601 N 10TH ST #63; small business) : $3,900 in 4 contractsin 2003
$1,320 with Army for Recreational Services. Signed on 2003-11-25. Completion date: 2004-02-29.
$1,320, same as above.Signed on 2003-12-08. Completion date: 2003-12-31.
$1,260, same as above.Signed on 2003-10-07. Completion date: 2004-02-29.
$0, same as above.Signed on 2003-12-08. Completion date: 2003-12-31.
Top industries in this zip code by the number of employees in 2005:
Health Care and Social Assistance: Home Health Care Services (500-999 employees: 1 establishment, 250-499 employees: 2 establishments, 100-249 employees: 3 establishments, 50-99 employees: 1 establishment, 20-49 employees: 5 establishments, 10-19 employees: 4 establishments, 1-4 employees: 5 establishments)
2002 - 2018 National Fire Incident Reporting System (NFIRS) incidents
Based on the data from the years 2002 - 2018 the average number of fires per year is 85. The highest number of reported fires - 147 took place in 2002, and the least - 16 in 2015. The data has a decreasing trend.
When looking into fire subcategories, the most incidents belonged to: Outside Fires (59.4%), and Structure Fires (17.3%).
Fire incident types reported to NFIRS in Zip Code 78504

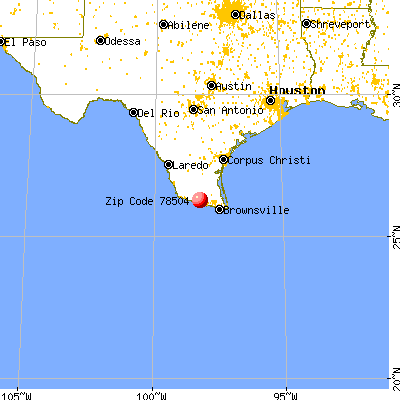


 Nearest zip codes: 78539, 78501, 78573, 78503, 78577, 78589.


 : $8,111,267 in 26 contracts from 1999 to 2002
 Based on the data from the years 2002 - 2018 the average number of fires per year is 85. The highest number of reported fires - 147 took place in 2002, and the least - 16 in 2015. The data has a decreasing trend.
 When looking into fire subcategories, the most incidents belonged to: Outside Fires (59.4%), and Structure Fires (17.3%).