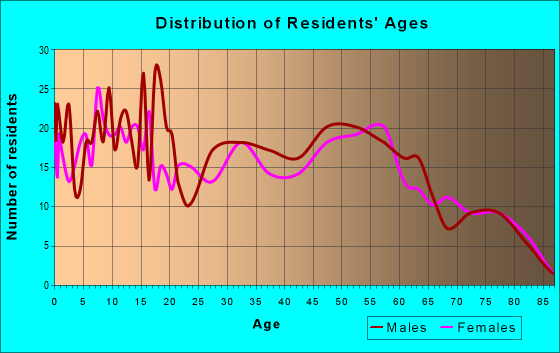
Estimated zip code population in 2022: 1,761 Zip code population in 2010: 2,661 Zip code population in 2000: 2,648
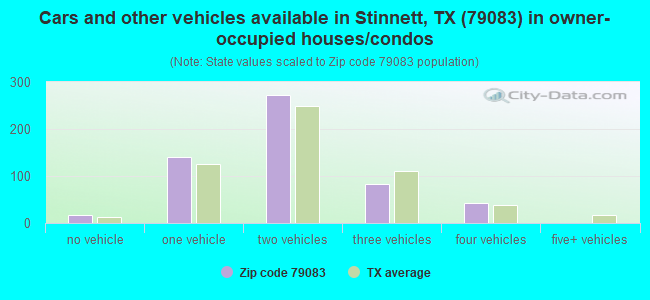
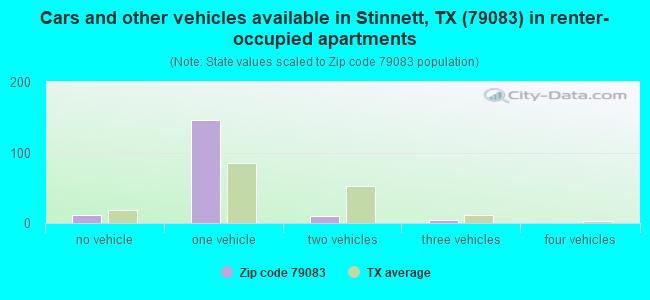
Houses and condos: 1,197 Renter-occupied apartments: 169
% of renters here:
24%
State:
38%
March 2022 cost of living index in zip code 79083: 78.1 (low, U.S. average is 100)
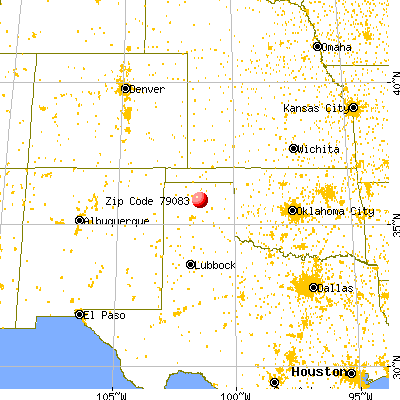
Land area: 317.3 sq. mi. Water area: 0.2 sq. mi.
Population density: 6 people per square mile
(very low).
OSM Map
General Map
Google Map
MSN Map
OSM Map
General Map
Google Map
MSN Map
OSM Map
General Map
Google Map
MSN Map
OSM Map
General Map
Google Map
MSN Map
Please wait while loading the map...
Real estate property taxes paid for housing units in 2022:
This zip code:
1.1% ($1,083)
Texas:
1.5% ($4,050)
Median real estate property taxes paid for housing units with mortgages in 2022: $1,297 (0.9%) Median real estate property taxes paid for housing units with no mortgage in 2022: $976 (1.1%)
Averages for the 2020 tax year for zip code 79083, filed in 2021:
Average Adjusted Gross Income (AGI) in 2020: $66,912 (Individual Income Tax Returns)
Here:
$66,912
State:
$77,054
Salary/wage: $56,944 (reported on 81.4% of returns)
Here:
$56,944
State:
$62,766
(% of AGI for various income ranges: 1097.9% for AGIs below $25k, 3397.1% for AGIs $25k-50k, 6346.7% for AGIs $50k-75k, 8318.8% for AGIs $75k-100k, 12400.0% for AGIs $100k-200k)
Taxable interest for individuals: $1,024 (reported on 35.1% of returns)
This zip code:
$1,024
Texas:
$2,665
(% of AGI for various income ranges: 7.1% for AGIs below $25k, 50.0% for AGIs $25k-50k, 30.8% for AGIs $50k-75k, 26.2% for AGIs $75k-100k, 71.4% for AGIs $100k-200k)
Ordinary dividends: $3,023 (reported on 13.4% of returns)
Here:
$3,023
State:
$10,044
(% of AGI for various income ranges: 27.1% for AGIs below $25k, 94.2% for AGIs $50k-75k, 72.1% for AGIs $100k-200k)
Net capital gain/loss in AGI: +$11,082 (reported on 11.3% of returns)
Here:
+$11,082
State:
+$39,590
(% of AGI for various income ranges: 40.4% for AGIs below $25k, 95.0% for AGIs $50k-75k, 720.0% for AGIs $100k-200k)
Profit/loss from business: +$983 (reported on 12.4% of returns)
Here:
+$983
State:
+$10,888
(% of AGI for various income ranges: 70.0% for AGIs below $25k, 18.2% for AGIs $25k-50k, 7.5% for AGIs $50k-75k)
Taxable individual retirement arrangement distribution: $31,850 (reported on 10.3% of returns)
79083:
$31,850
Texas:
$24,740
(% of AGI for various income ranges: 291.2% for AGIs $25k-50k, 941.7% for AGIs $50k-75k, 1114.3% for AGIs $100k-200k)
Total itemized deductions: $35,200 (reported on 3.1% of returns)
Here:
$35,200
State:
$40,428
(% of AGI for various income ranges: 880.0% for AGIs $50k-75k)
Taxes paid: $3,500 (reported on 2.1% of returns)
79083:
$3,500
State:
$7,821
(% of AGI for various income ranges: 29.2% for AGIs below $25k)
Earned income credit: $2,441 (reported on 17.5% of returns)
Here:
$2,441
State:
$2,584
(% of AGI for various income ranges: 110.8% for AGIs below $25k, 87.6% for AGIs $25k-50k)
Percentage of individuals using paid preparers for their 2020 taxes: 94.8%
Here:
95%
State:
92%
(% for various income ranges: 96.7% for AGIs below $25k, 95.0% for AGIs $25k-50k, 93.8% for AGIs $50k-75k, 90.0% for AGIs $75k-100k, 94.1% for AGIs $100k-200k, 100.0% for AGIs over 200k)
Averages for the 2012 tax year for zip code 79083, filed in 2013:
Average Adjusted Gross Income (AGI) in 2012: $61,601 (Individual Income Tax Returns)
Here:
$61,601
State:
$65,384
Salary/wage: $52,194 (reported on 85.7% of returns)
Here:
$52,194
State:
$52,524
(% of AGI for various income ranges: 73.3% for AGIs below $25k, 82.9% for AGIs $25k-50k, 81.7% for AGIs $50k-75k, 86.7% for AGIs $75k-100k, 93.3% for AGIs $100k-200k)
Taxable interest for individuals: $637 (reported on 35.7% of returns)
This zip code:
$637
Texas:
$2,372
(% of AGI for various income ranges: 0.6% for AGIs below $25k, 0.4% for AGIs $25k-50k, 0.2% for AGIs $50k-75k, 0.3% for AGIs $75k-100k, 0.2% for AGIs $100k-200k, 0.8% for AGIs over 200k)
Ordinary dividends: $2,892 (reported on 13.3% of returns)
Here:
$2,892
State:
$9,721
(% of AGI for various income ranges: 0.9% for AGIs below $25k, 0.8% for AGIs $25k-50k, 0.5% for AGIs $50k-75k, 1.2% for AGIs $100k-200k)
Net capital gain/loss in AGI: +$7,780 (reported on 10.2% of returns)
Here:
+$7,780
State:
+$35,319
(% of AGI for various income ranges: 0.4% for AGIs below $25k, 4.0% for AGIs $100k-200k)
Profit/loss from business: +$7,938 (reported on 16.3% of returns)
Here:
+$7,938
State:
+$13,732
(% of AGI for various income ranges: 4.5% for AGIs below $25k, 1.6% for AGIs $25k-50k, 2.7% for AGIs $50k-75k, 1.7% for AGIs $75k-100k, 2.8% for AGIs $100k-200k)
Taxable individual retirement arrangement distribution: $16,711 (reported on 9.2% of returns)
79083:
$16,711
Texas:
$19,511
(% of AGI for various income ranges: 5.6% for AGIs below $25k, 2.6% for AGIs $25k-50k, 5.1% for AGIs $50k-75k, 3.1% for AGIs $100k-200k)
Total itemized deductions: $23,682 (17% of AGI, reported on 11.2% of returns)
Here:
$23,682
State:
$24,724
Here:
16.8% of AGI
State:
15.9% of AGI
(% of AGI for various income ranges: 4.9% for AGIs $25k-50k, 10.4% for AGIs $50k-75k, 6.3% for AGIs $100k-200k)
Charity contributions: $13,138 (reported on 8.2% of returns)
Here:
$13,138
State:
$6,808
Taxes paid: $2,767 (reported on 12.2% of returns)
79083:
$2,767
State:
$6,921
(% of AGI for various income ranges: 1.3% for AGIs below $25k, 1.1% for AGIs $50k-75k, 1.0% for AGIs $100k-200k)
Earned income credit: $2,038 (reported on 16.3% of returns)
Here:
$2,038
State:
$2,570
(% of AGI for various income ranges: 5.9% for AGIs below $25k, 1.4% for AGIs $25k-50k)
Percentage of individuals using paid preparers for their 2012 taxes: 58.2%
Here:
58%
State:
51%
(% for various income ranges: 50.0% for AGIs below $25k, 54.5% for AGIs $25k-50k, 66.7% for AGIs $50k-75k, 58.3% for AGIs $75k-100k, 80.0% for AGIs $100k-200k)
Averages for the 2004 tax year for zip code 79083, filed in 2005:
Average Adjusted Gross Income (AGI) in 2004: $36,047 (Individual Income Tax Returns)
Here:
$36,047
State:
$47,881
Salary/wage: $34,689 (reported on 83.9% of returns)
Here:
$34,689
State:
$41,947
(% of AGI for various income ranges: 129.7% for AGIs below $10k, 69.5% for AGIs $10k-25k, 79.0% for AGIs $25k-50k, 86.9% for AGIs $50k-75k, 84.5% for AGIs $75k-100k, 73.5% for AGIs over 100k)
Taxable interest for individuals: $981 (reported on 40.0% of returns)
This zip code:
$981
Texas:
$2,255
(% of AGI for various income ranges: 4.7% for AGIs below $10k, 2.8% for AGIs $10k-25k, 1.1% for AGIs $25k-50k, 0.8% for AGIs $50k-75k, 0.4% for AGIs $75k-100k, 0.8% for AGIs over 100k)
Taxable dividends: $856 (reported on 12.8% of returns)
Here:
$856
State:
$4,261
(% of AGI for various income ranges: 2.1% for AGIs below $10k, 0.9% for AGIs $10k-25k, 0.2% for AGIs $25k-50k, 0.1% for AGIs $50k-75k, 0.1% for AGIs $75k-100k, 0.3% for AGIs over 100k)
Net capital gain/loss: +$3,042 (reported on 11.4% of returns)
Here:
+$3,042
State:
+$16,110
(% of AGI for various income ranges: -2.1% for AGIs below $10k, 1.1% for AGIs $10k-25k, 0.8% for AGIs $25k-50k, 0.1% for AGIs $50k-75k, 3.4% for AGIs over 100k)
Profit/loss from business: +$4,575 (reported on 15.5% of returns)
Here:
+$4,575
State:
+$11,013
(% of AGI for various income ranges: 23.2% for AGIs below $10k, 3.7% for AGIs $10k-25k, 2.9% for AGIs $25k-50k, 1.2% for AGIs $50k-75k, 0.6% for AGIs $75k-100k)
Total itemized deductions: $15,740 (20% of AGI, reported on 9.3% of returns)
Here:
$15,740
State:
$19,631
Here:
20.2% of AGI
State:
18.9% of AGI
(% of AGI for various income ranges: 4.8% for AGIs $25k-50k, 4.7% for AGIs $50k-75k, 3.9% for AGIs $75k-100k, 5.1% for AGIs over 100k)
Charity contributions deductions: $6,587 (8% of AGI, reported on 7.3% of returns)
Here:
$6,587
State:
$4,753
Here:
8.2% of AGI
State:
4.2% of AGI
(% of AGI for various income ranges: 1.1% for AGIs $25k-50k, 1.2% for AGIs $50k-75k, 1.4% for AGIs $75k-100k, 2.5% for AGIs over 100k)
Total tax: $5,023 (reported on 68.2% of returns)
79083:
$5,023
State:
$9,058
(% of AGI for various income ranges: 3.4% for AGIs below $10k, 3.6% for AGIs $10k-25k, 5.7% for AGIs $25k-50k, 9.4% for AGIs $50k-75k, 11.0% for AGIs $75k-100k, 17.0% for AGIs over 100k)
Earned income credit: $1,673 (reported on 19.3% of returns)
Here:
$1,673
State:
$2,024
Percentage of individuals using paid preparers for their 2004 taxes: 63.6%
Here:
64%
State:
57%
(% for various income ranges: 55.7% for AGIs below $10k, 63.3% for AGIs $10k-25k, 64.3% for AGIs $25k-50k, 69.4% for AGIs $50k-75k, 67.1% for AGIs $75k-100k, 78.4% for AGIs over 100k)
Household received Food Stamps/SNAP in the past 12 months: 80 Household did not receive Food Stamps/SNAP in the past 12 months: 641
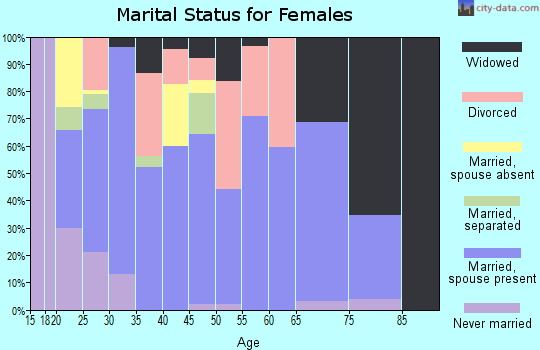
Women who did not have a birth in the past 12 months: 334 (123 now married, 211 unmarried)
Housing units in zip code 79083 with a mortgage: 144 Median monthly owner costs for units with a mortgage: $1,214 Median monthly owner costs for units without a mortgage: $453
Residents with income below the poverty level in 2022:
This zip code:
14.2%
Whole state:
14.0%
Residents with income below 50% of the poverty level in 2022:
This zip code:
2.2%
Whole state:
7.4%
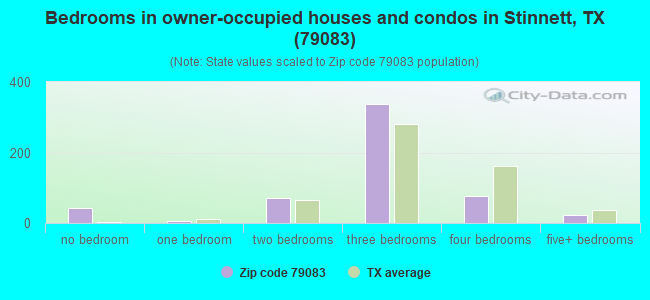
Median number of rooms in houses and condos:
Here:
6.2
State:
6.3
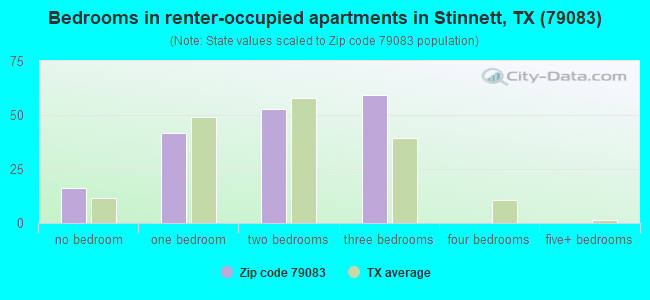
Median number of rooms in apartments:
Here:
4.2
State:
4.0
Notable locations in this zip code not listed on our city pages
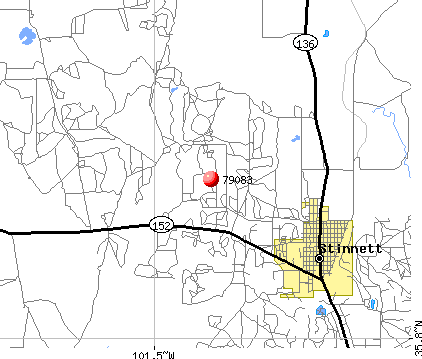
Notable locations in zip code 79083: Creslenn Camp (A), Herring Ranch (B), Morton Elevator (C), Sneed Camp (D), Supreme Camp (E), Yake Ranch (F), Johnson Pumping Station (G), Pantex Water System Kay Station (H), Rocking D Ranch (I), Britain Ranch (J), Stinnett Volunteer Fire Department (K), Stinnett Ambulance Service (L). Display/hide their locations on the map
In group quarters: 52 (-1 institutionalized population)
Size of family households: 144 2-persons, 135 3-persons, 49 4-persons, 4 5-persons, 22 6-persons
Size of nonfamily households: 340 1-person, 31 2-persons
233 married couples with children.
186 single-parent households (186 women).
92.2% of residents of 79083 zip code speak English at home.
7.1% of residents speak Spanish at home (100% very well).
0.8% of residents speak other Indo-European language at home (100% very well).
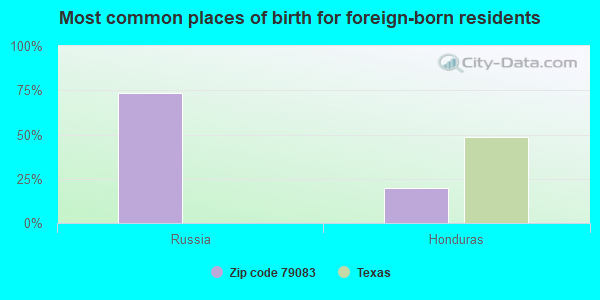
Foreign born population: 16 (0.9%) (75.4% of them are naturalized citizens)
This zip code:
0.9%
Whole state:
17.2%
73%Russia
20%Honduras
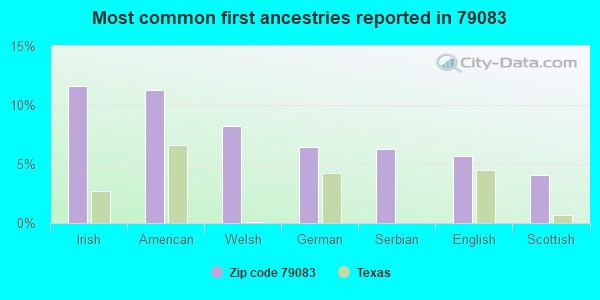
12%Irish
11%American
8%Welsh
6%German
6%Serbian
6%English
4%Scottish
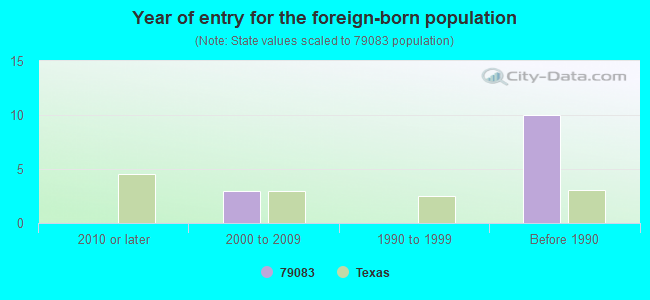
Year of entry for the foreign-born population
02010 or later
32000 to 2009
01990 to 1999
10Before 1990
Facilities with environmental interests located in this zip code:
AMERICAN TEL & TEL CO LONG LINES (2M N L433610 in STINNETT, TX)
(Resource Conservation and Recovery Act (tracking hazardous waste)) Organizations: AMERICAN TELEPHONE AND TELEGRAPH COMPANY (CONTACT/OPERATOR)
ANT ENTERPRISES INC. (408 MAIN ST in STINNETT, TX)
National Pollutant Discharge Elimination System NON-MAJOR (Tracking pollutant discharge elimination systems) - permit Business SIC classification: READY-MIXED CONCRETE
AMERICAN STAR ENERGY AND MINERALS CO (3.7 MI SW OF STINNET ON FM 687 in STINNETT, TX)
AIR MAJOR (AIRS/AFS) Business SIC classification: NATURAL GAS LIQUIDS
ANADARKO GATHERING COMPANY (2 MI. S. OF INTER. F.M. 1913 & in STINNETT, TX)
CRITERIA AND HAZARDOUS AIR POLLUTANT INVENTORY (Inventory of air pollution sources) Business SIC classification: CRUDE PETROLEUM AND NATURAL GAS
Housing units lacking complete plumbing facilities: 19.6% Housing units lacking complete kitchen facilities: 17.3%
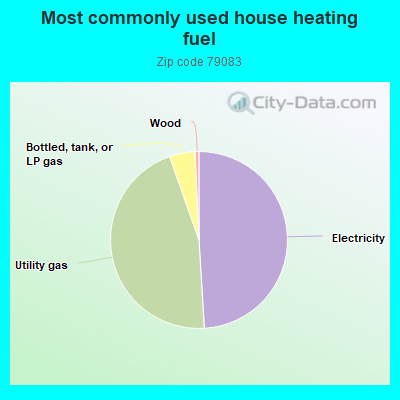
49.2%Electricity
45.7%Utility gas
4.7%Bottled, tank, or LP gas
0.7%Wood
Population in 1990: 3,277.
Place of birth for U.S.-born residents:
This state: 1,235
Northeast: 40
Midwest: 12
South: 374
West: 74
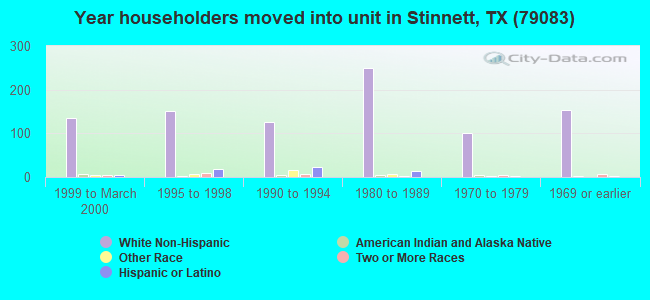
67% of the 79083 zip code residents lived in the same house 5 years ago. Out of people who lived in different houses, 60% lived in this county. Out of people who lived in different counties, 50% lived in Texas.
93% of the 79083 zip code residents lived in the same house 1 year ago. Out of people who lived in different houses, 45% moved from this county. Out of people who lived in different houses, 26% moved from different county within same state. Out of people who lived in different houses, 31% moved from different state.
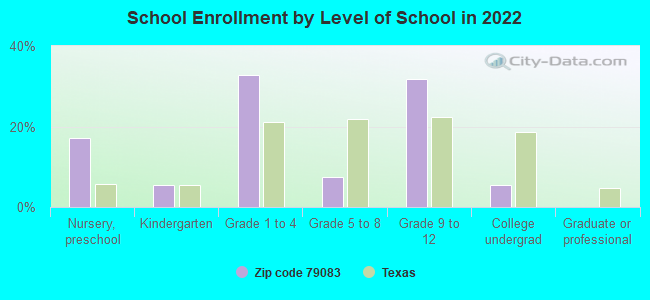
Private vs. public school enrollment:
Students in private schools in grades 1 to 8 (elementary and middle school):
Here:
0.0%
Texas:
8.8%
Students in private schools in grades 9 to 12 (high school):
Here:
0.0%
Texas:
8.0%
Students in private undergraduate colleges:
Here:
0.0%
Texas:
16.2%
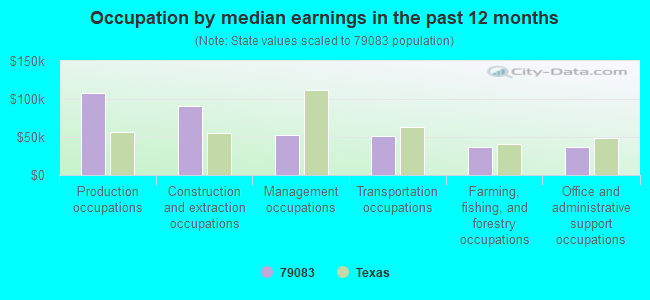
Occupation by median earnings in the past 12 months ($)
108,072Production occupations
90,985Construction and extraction occupations
52,791Management occupations
51,526Transportation occupations
37,232Farming, fishing, and forestry occupations
36,597Office and administrative support occupations
Top industries in this zip code by the number of employees in 2005:
Management of Companies and Enterprises: Corporate, Subsidiary, and Regional Managing Offices (20-49 employees: 1 establishment)
Professional, Scientific, and Technical Services: All Other Professional, Scientific, and Technical Services (20-49: 1)
Mining: Support Activities for Oil and Gas Operations (10-19: 1, 5-9: 1, 1-4: 2)
Accommodation and Food Services: Limited-Service Restaurants (10-19: 1, 1-4: 3)
Mining: Natural Gas Liquid Extraction (10-19: 1)
Construction: Framing Contractors (10-19: 1)
Construction: Electrical Contractors (10-19: 1)
Finance and Insurance: Credit Unions (10-19: 1)
Mining: Crude Petroleum and Natural Gas Extraction (5-9: 1, 1-4: 1)
People in group quarters in 2010:
91 people in local jails and other municipal confinement facilities
People in group quarters in 2000:
31 people in local jails and other confinement facilities (including police lockups)
Fatal accident statistics in 2012:
Fatal accident count: 1
Vehicles involved in fatal accidents: 2
Fatal accidents caused by drunken drivers: 0
Fatalities: 1
Persons involved in fatal accidents: 2
Pedestrians involved in fatal accidents: 0
Fatal accident statistics in 2011:
Fatal accident count: 1
Vehicles involved in fatal accidents: 2
Fatal accidents caused by drunken drivers: 0
Fatalities: 1
Persons involved in fatal accidents: 2
Pedestrians involved in fatal accidents: 0
2003 - 2018 National Fire Incident Reporting System (NFIRS) incidents
Based on the data from the years 2003 - 2018 the average number of fires per year is 30. The highest number of fire incidents - 72 took place in 2006, and the least - 0 in 2013. The data has a declining trend.
When looking into fire subcategories, the most reports belonged to: Outside Fires (79.0%), and Structure Fires (11.9%).
Fire incident types reported to NFIRS in Zip Code 79083


 Nearest zip codes: 79062, 79078, 79007, 79036, 79086, 79080.


 Based on the data from the years 2003 - 2018 the average number of fires per year is 30. The highest number of fire incidents - 72 took place in 2006, and the least - 0 in 2013. The data has a declining trend.
 When looking into fire subcategories, the most reports belonged to: Outside Fires (79.0%), and Structure Fires (11.9%).