Estimated zip code population in 2022: 5,285 Zip code population in 2010: 5,128 Zip code population in 2000: 5,440
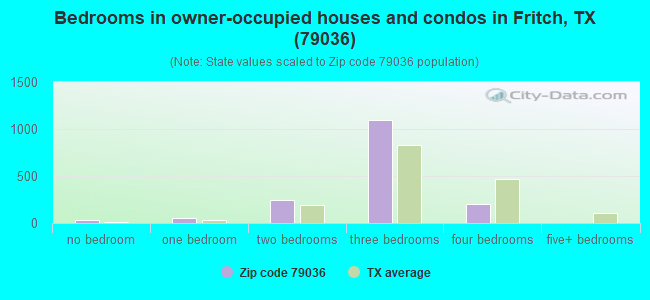
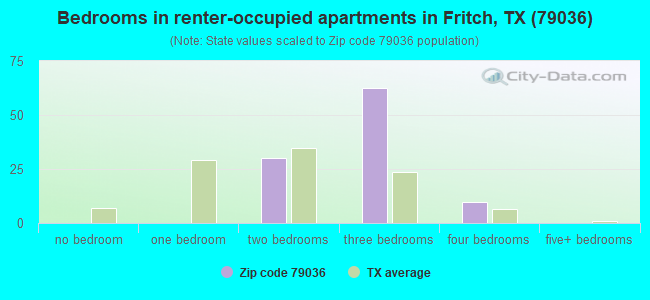
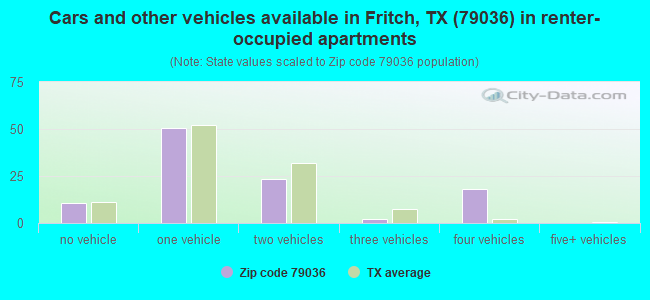
Houses and condos: 2,488 Renter-occupied apartments: 104
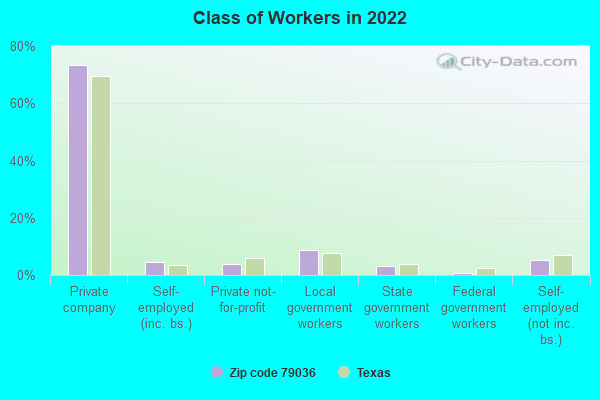
% of renters here:
6%
State:
38%
March 2022 cost of living index in zip code 79036: 81.7 (low, U.S. average is 100)
Land area: 64.1 sq. mi. Water area: 3.8 sq. mi.
Population density: 82 people per square mile
(very low).
OSM Map
General Map
Google Map
MSN Map
OSM Map
General Map
Google Map
MSN Map
OSM Map
General Map
Google Map
MSN Map
OSM Map
General Map
Google Map
MSN Map
Please wait while loading the map...
Real estate property taxes paid for housing units in 2022:
This zip code:
1.1% ($1,526)
Texas:
1.5% ($4,050)
Median real estate property taxes paid for housing units with mortgages in 2022: $1,737 (1.2%) Median real estate property taxes paid for housing units with no mortgage in 2022: $1,487 (1.2%)
Business Search- 14 Million verified businesses
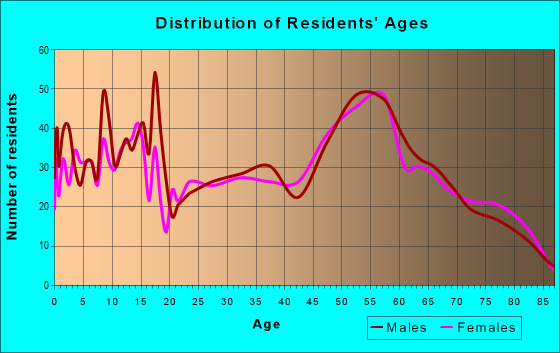
Males: 2,692
(50.9%)
Females: 2,593
(49.1%)
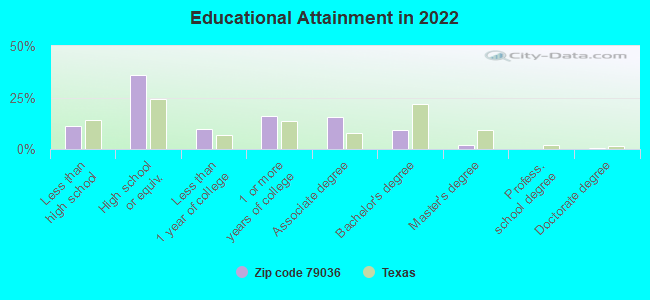
For population 25 years and over in 79036:
High school or higher: 88.7%
Bachelor's degree or higher: 12.0%
Graduate or professional degree: 2.7%
Unemployed: 5.5%
Mean travel time to work (commute): 21.3 minutes
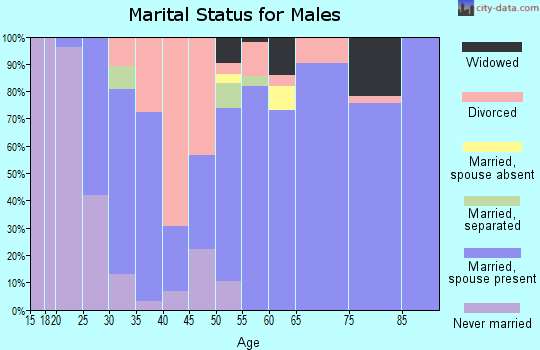
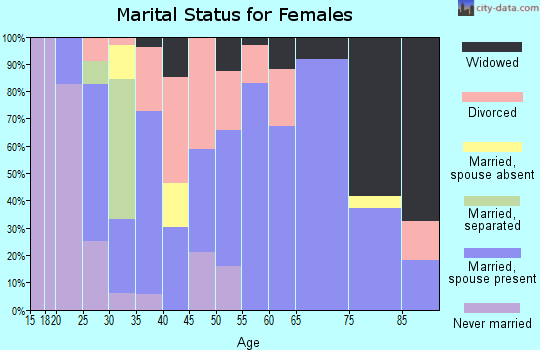
For population 15 years and over in 79036:
Never married: 23.9%
Now married: 57.9%
Separated: 0.3%
Widowed: 7.2%
Divorced: 10.8%
Zip code 79036 compared to state average:
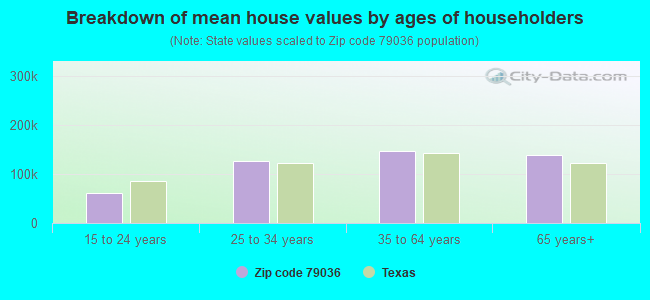
Median house value below state average.
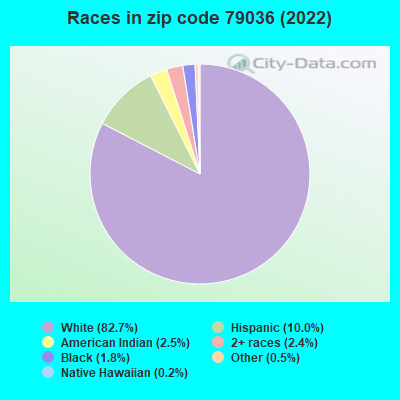
Black race population percentage significantly below state average.
Hispanic race population percentage significantly below state average.
Median age above state average.
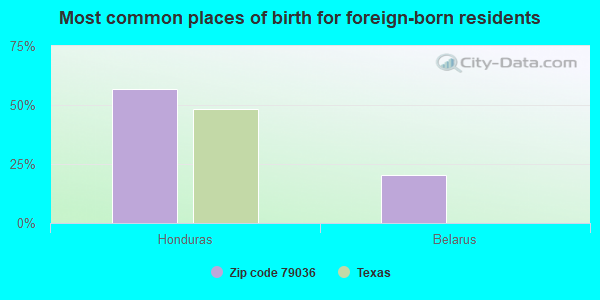
Foreign-born population percentage significantly below state average.
Renting percentage significantly below state average.
Length of stay since moving in significantly above state average.
Number of college students below state average.
Percentage of population with a bachelor's degree or higher significantly below state average.
Averages for the 2020 tax year for zip code 79036, filed in 2021:
Average Adjusted Gross Income (AGI) in 2020: $66,429 (Individual Income Tax Returns)
Here:
$66,429
State:
$77,054
Salary/wage: $60,721 (reported on 78.8% of returns)
Here:
$60,721
State:
$62,766
(% of AGI for various income ranges: 954.2% for AGIs below $25k, 3307.2% for AGIs $25k-50k, 5786.8% for AGIs $50k-75k, 8601.5% for AGIs $75k-100k, 15459.7% for AGIs $100k-200k, 27303.3% for AGIs over 200k)
Taxable interest for individuals: $619 (reported on 36.8% of returns)
This zip code:
$619
Texas:
$2,665
(% of AGI for various income ranges: 30.0% for AGIs below $25k, 22.5% for AGIs $25k-50k, 19.1% for AGIs $50k-75k, 35.0% for AGIs $75k-100k, 41.0% for AGIs $100k-200k, 73.3% for AGIs over 200k)
Ordinary dividends: $2,810 (reported on 14.2% of returns)
Here:
$2,810
State:
$10,044
(% of AGI for various income ranges: 19.0% for AGIs below $25k, 57.8% for AGIs $25k-50k, 77.3% for AGIs $50k-75k, 48.5% for AGIs $75k-100k, 75.8% for AGIs $100k-200k, 203.3% for AGIs over 200k)
Net capital gain/loss in AGI: +$5,233 (reported on 11.3% of returns)
Here:
+$5,233
State:
+$39,590
(% of AGI for various income ranges: 13.8% for AGIs below $25k, 21.6% for AGIs $25k-50k, 71.8% for AGIs $50k-75k, 40.0% for AGIs $75k-100k, 283.9% for AGIs $100k-200k)
Profit/loss from business: +$5,283 (reported on 13.7% of returns)
Here:
+$5,283
State:
+$10,888
(% of AGI for various income ranges: 83.8% for AGIs below $25k, 86.6% for AGIs $25k-50k, 61.8% for AGIs $50k-75k, 228.1% for AGIs $100k-200k)
Taxable individual retirement arrangement distribution: $36,833 (reported on 15.6% of returns)
79036:
$36,833
Texas:
$24,740
(% of AGI for various income ranges: 109.6% for AGIs below $25k, 317.8% for AGIs $25k-50k, 535.0% for AGIs $50k-75k, 621.5% for AGIs $75k-100k, 1433.2% for AGIs $100k-200k, 12423.3% for AGIs over 200k)
Total itemized deductions: $35,650 (reported on 2.8% of returns)
Here:
$35,650
State:
$40,428
(% of AGI for various income ranges: 690.0% for AGIs $100k-200k)
Charity contributions: $13,360 (reported on 2.4% of returns)
Here:
$13,360
State:
$18,201
(% of AGI for various income ranges: 215.5% for AGIs $100k-200k)
Taxes paid: $4,300 (reported on 2.8% of returns)
79036:
$4,300
State:
$7,821
(% of AGI for various income ranges: 83.2% for AGIs $100k-200k)
Earned income credit: $2,196 (reported on 12.3% of returns)
Here:
$2,196
State:
$2,584
(% of AGI for various income ranges: 74.2% for AGIs below $25k, 62.5% for AGIs $25k-50k)
Percentage of individuals using paid preparers for their 2020 taxes: 94.8%
Here:
95%
State:
92%
(% for various income ranges: 92.4% for AGIs below $25k, 95.1% for AGIs $25k-50k, 96.6% for AGIs $50k-75k, 96.0% for AGIs $75k-100k, 95.6% for AGIs $100k-200k, 100.0% for AGIs over 200k)
Averages for the 2012 tax year for zip code 79036, filed in 2013:
Average Adjusted Gross Income (AGI) in 2012: $57,500 (Individual Income Tax Returns)
Here:
$57,500
State:
$65,384
Salary/wage: $54,170 (reported on 81.6% of returns)
Here:
$54,170
State:
$52,524
(% of AGI for various income ranges: 70.8% for AGIs below $25k, 71.6% for AGIs $25k-50k, 81.4% for AGIs $50k-75k, 79.3% for AGIs $75k-100k, 80.5% for AGIs $100k-200k, 56.0% for AGIs over 200k)
Taxable interest for individuals: $682 (reported on 39.6% of returns)
This zip code:
$682
Texas:
$2,372
(% of AGI for various income ranges: 1.5% for AGIs below $25k, 1.1% for AGIs $25k-50k, 0.4% for AGIs $50k-75k, 0.4% for AGIs $75k-100k, 0.2% for AGIs $100k-200k)
Ordinary dividends: $3,150 (reported on 13.2% of returns)
Here:
$3,150
State:
$9,721
(% of AGI for various income ranges: 2.0% for AGIs below $25k, 0.9% for AGIs $25k-50k, 1.0% for AGIs $50k-75k, 1.0% for AGIs $75k-100k, 0.3% for AGIs $100k-200k)
Net capital gain/loss in AGI: +$1,659 (reported on 10.4% of returns)
Here:
+$1,659
State:
+$35,319
(% of AGI for various income ranges: 0.2% for AGIs below $25k, 0.8% for AGIs $50k-75k, 0.5% for AGIs $100k-200k)
Profit/loss from business: +$5,738 (reported on 12.3% of returns)
Here:
+$5,738
State:
+$13,732
(% of AGI for various income ranges: 4.9% for AGIs below $25k, 2.7% for AGIs $25k-50k, 0.5% for AGIs $50k-75k, 1.1% for AGIs $75k-100k, 0.7% for AGIs $100k-200k)
Taxable individual retirement arrangement distribution: $23,570 (reported on 15.6% of returns)
79036:
$23,570
Texas:
$19,511
(% of AGI for various income ranges: 5.9% for AGIs below $25k, 7.1% for AGIs $25k-50k, 4.6% for AGIs $50k-75k, 8.1% for AGIs $75k-100k, 7.4% for AGIs $100k-200k)
Total itemized deductions: $20,990 (23% of AGI, reported on 14.2% of returns)
Here:
$20,990
State:
$24,724
Here:
23.3% of AGI
State:
15.9% of AGI
(% of AGI for various income ranges: 8.3% for AGIs $25k-50k, 5.4% for AGIs $50k-75k, 5.0% for AGIs $75k-100k, 5.9% for AGIs $100k-200k)
Charity contributions: $6,120 (reported on 9.4% of returns)
Here:
$6,120
State:
$6,808
(% of AGI for various income ranges: 1.7% for AGIs $25k-50k, 1.0% for AGIs $50k-75k, 0.6% for AGIs $75k-100k, 1.3% for AGIs $100k-200k)
Taxes paid: $3,569 (reported on 13.7% of returns)
79036:
$3,569
State:
$6,921
(% of AGI for various income ranges: 0.9% for AGIs $25k-50k, 0.6% for AGIs $50k-75k, 0.8% for AGIs $75k-100k, 1.3% for AGIs $100k-200k)
Earned income credit: $2,003 (reported on 15.1% of returns)
Here:
$2,003
State:
$2,570
(% of AGI for various income ranges: 6.2% for AGIs below $25k, 1.1% for AGIs $25k-50k)
Percentage of individuals using paid preparers for their 2012 taxes: 50.0%
Here:
50%
State:
51%
(% for various income ranges: 41.8% for AGIs below $25k, 53.3% for AGIs $25k-50k, 52.9% for AGIs $50k-75k, 51.9% for AGIs $75k-100k, 55.6% for AGIs $100k-200k, 66.7% for AGIs over 200k)
Averages for the 2004 tax year for zip code 79036, filed in 2005:
Average Adjusted Gross Income (AGI) in 2004: $43,468 (Individual Income Tax Returns)
Here:
$43,468
State:
$47,881
Salary/wage: $39,568 (reported on 81.8% of returns)
Here:
$39,568
State:
$41,947
(% of AGI for various income ranges: 87.8% for AGIs below $10k, 64.9% for AGIs $10k-25k, 79.5% for AGIs $25k-50k, 81.5% for AGIs $50k-75k, 84.9% for AGIs $75k-100k, 57.3% for AGIs over 100k)
Taxable interest for individuals: $1,026 (reported on 48.7% of returns)
This zip code:
$1,026
Texas:
$2,255
(% of AGI for various income ranges: 4.5% for AGIs below $10k, 3.1% for AGIs $10k-25k, 1.5% for AGIs $25k-50k, 0.8% for AGIs $50k-75k, 0.6% for AGIs $75k-100k, 0.6% for AGIs over 100k)
Taxable dividends: $1,228 (reported on 17.4% of returns)
Here:
$1,228
State:
$4,261
(% of AGI for various income ranges: 1.7% for AGIs below $10k, 1.3% for AGIs $10k-25k, 0.6% for AGIs $25k-50k, 0.3% for AGIs $50k-75k, 0.4% for AGIs $75k-100k, 0.3% for AGIs over 100k)
Net capital gain/loss: +$1,538 (reported on 14.2% of returns)
Here:
+$1,538
State:
+$16,110
(% of AGI for various income ranges: -2.2% for AGIs below $10k, 0.8% for AGIs $10k-25k, 0.4% for AGIs $25k-50k, 0.6% for AGIs $50k-75k, -0.0% for AGIs $75k-100k, 0.9% for AGIs over 100k)
Profit/loss from business: +$684 (reported on 14.3% of returns)
Here:
+$684
State:
+$11,013
(% of AGI for various income ranges: -6.8% for AGIs below $10k, 4.0% for AGIs $10k-25k, 1.4% for AGIs $25k-50k, 0.1% for AGIs $50k-75k, -1.1% for AGIs $75k-100k, -0.5% for AGIs over 100k)
IRA payment deduction: $2,080 (reported on 1.2% of returns)
79036:
$2,080
Texas:
$3,120
Total itemized deductions: $15,467 (22% of AGI, reported on 12.0% of returns)
Here:
$15,467
State:
$19,631
Here:
22.5% of AGI
State:
18.9% of AGI
(% of AGI for various income ranges: 5.6% for AGIs $10k-25k, 4.5% for AGIs $25k-50k, 4.6% for AGIs $50k-75k, 4.6% for AGIs $75k-100k, 3.3% for AGIs over 100k)
Charity contributions deductions: $5,106 (7% of AGI, reported on 8.8% of returns)
Here:
$5,106
State:
$4,753
Here:
7.1% of AGI
State:
4.2% of AGI
(% of AGI for various income ranges: 1.2% for AGIs $10k-25k, 0.8% for AGIs $25k-50k, 1.1% for AGIs $50k-75k, 1.1% for AGIs $75k-100k, 1.1% for AGIs over 100k)
Total tax: $6,100 (reported on 75.3% of returns)
79036:
$6,100
State:
$9,058
(% of AGI for various income ranges: 2.0% for AGIs below $10k, 3.6% for AGIs $10k-25k, 6.3% for AGIs $25k-50k, 9.4% for AGIs $50k-75k, 11.4% for AGIs $75k-100k, 18.0% for AGIs over 100k)
Earned income credit: $1,686 (reported on 15.8% of returns)
Here:
$1,686
State:
$2,024
Percentage of individuals using paid preparers for their 2004 taxes: 54.9%
Here:
55%
State:
57%
(% for various income ranges: 39.2% for AGIs below $10k, 59.9% for AGIs $10k-25k, 60.1% for AGIs $25k-50k, 55.0% for AGIs $50k-75k, 54.5% for AGIs $75k-100k, 66.4% for AGIs over 100k)
Household received Food Stamps/SNAP in the past 12 months: 103 Household did not receive Food Stamps/SNAP in the past 12 months: 1,628
Women who had a birth in the past 12 months: 27 (28 now married, 0 unmarried) Women who did not have a birth in the past 12 months: 1,016 (492 now married, 522 unmarried)
Housing units in zip code 79036 with a mortgage: 527 (38 second mortgage, 41 both second mortgage and home equity loan) Median monthly owner costs for units with a mortgage: $1,220 Median monthly owner costs for units without a mortgage: $493
Residents with income below the poverty level in 2022:
This zip code:
5.6%
Whole state:
14.0%
Residents with income below 50% of the poverty level in 2022:
This zip code:
2.8%
Whole state:
7.4%
Median number of rooms in houses and condos:
Here:
6.1
State:
6.3
Median number of rooms in apartments:
Here:
5.5
State:
4.0
Notable locations in this zip code not listed on our city pages
Notable locations in zip code 79036: Carson Camp (A), Fritch Fortress Picnic Area (B), Poling Ranch (C), Sanford Ranch (D), Huber Booster Station (E), Huber Water Station (F), Burnett Camp (G), Lake Meredith Aquatic and Wildlife Museum (H), Fritch Volunteer Fire Department (I), Fritch Emergency Medical Services (J). Display/hide their locations on the map
Size of family households: 728 2-persons, 280 3-persons, 230 4-persons, 83 5-persons, 8 6-persons
Size of nonfamily households: 384 1-person, 21 2-persons
861 married couples with children.
168 single-parent households (56 men, 112 women).
93.2% of residents of 79036 zip code speak English at home.
7.0% of residents speak Spanish at home (96% very well, 4% well).
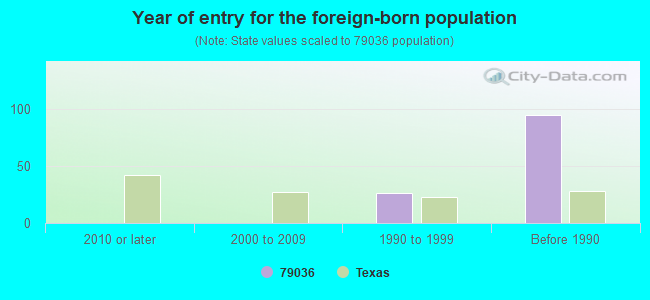
Foreign born population: 78 (1.5%) (92.4% of them are naturalized citizens)
This zip code:
1.5%
Whole state:
17.2%
57%Honduras
20%Belarus
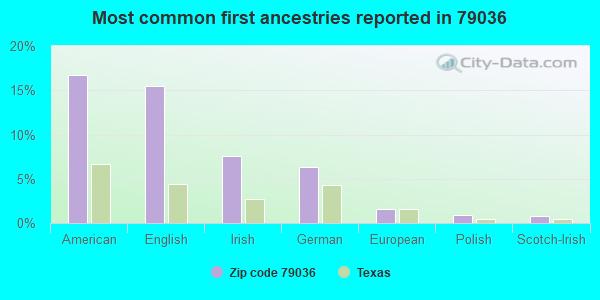
17%American
15%English
8%Irish
6%German
2%European
1%Polish
1%Scotch-Irish
Year of entry for the foreign-born population
02010 or later
02000 to 2009
261990 to 1999
95Before 1990
Facilities with environmental interests located in this zip code:
AMERICAN PROCESSING CO INC (HWY 136 35M N OF AMARILLO in FRITCH, TX)
(Resource Conservation and Recovery Act (tracking hazardous waste)) Business NAICS classification: NATURAL GAS LIQUID EXTRACTION. Alternative names: TURKEY CREEK
ANDARKO GATHERING COMPANY (S 2 1/2 MI TO POLING RANCH, 1S in FRITCH, TX)
AIR MINOR (AIRS/AFS) Business SIC classification: NATURAL GAS TRANSMISSION
AMERICAN PROCESSING, L.P. (8 MI. S. OF FRITCH, TX., ON ST in FRITCH, TX)
AIR MAJOR (AIRS/AFS) CRITERIA AND HAZARDOUS AIR POLLUTANT INVENTORY (Inventory of air pollution sources) Business SIC classification: CRUDE PETROLEUM AND NATURAL GAS; NATURAL GAS LIQUIDS Business NAICS classification: NATURAL GAS LIQUID EXTRACTION.
Housing units lacking complete plumbing facilities: 21.5% Housing units lacking complete kitchen facilities: 16.0%
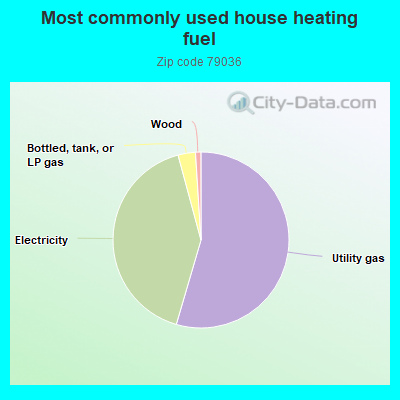
54.6%Utility gas
41.3%Electricity
3.2%Bottled, tank, or LP gas
1.0%Wood
Population in 1990: 5,073. Population change in the 1990s: +367 (+7.2%).
Place of birth for U.S.-born residents:
This state: 4,017
Northeast: 125
Midwest: 205
South: 437
West: 340
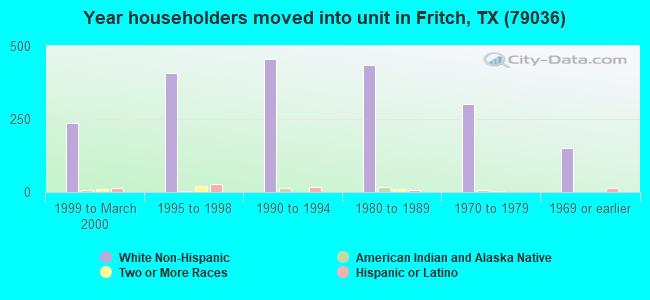
65% of the 79036 zip code residents lived in the same house 5 years ago. Out of people who lived in different houses, 46% lived in this county. Out of people who lived in different counties, 50% lived in Texas.
96% of the 79036 zip code residents lived in the same house 1 year ago. Out of people who lived in different houses, 42% moved from this county. Out of people who lived in different houses, 39% moved from different county within same state. Out of people who lived in different houses, 21% moved from different state. Out of people who lived in different houses, 4% moved from abroad.
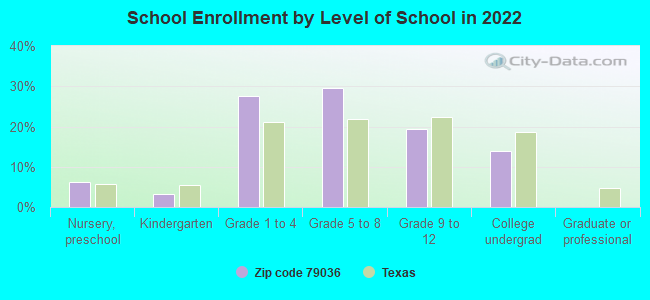
Private vs. public school enrollment:
Students in private schools in grades 1 to 8 (elementary and middle school): 51
Here:
8.7%
Texas:
8.8%
Students in private schools in grades 9 to 12 (high school):
Here:
0.0%
Texas:
8.0%
Students in private undergraduate colleges:
Here:
0.0%
Texas:
16.2%
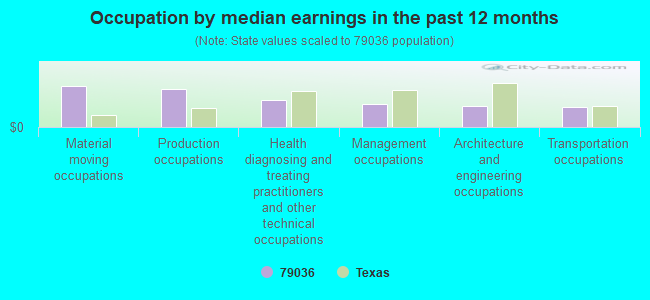
Occupation by median earnings in the past 12 months ($)
105,745Material moving occupations
100,390Production occupations
70,360Health diagnosing and treating practitioners and other technical occupations
59,613Management occupations
53,930Architecture and engineering occupations
52,845Transportation occupations
Companies with federal contracts located in this zip code:
HI-TEXAS WATER CORP (205 EAGLE BLVD in FRITCH, TX) 4 employees, $250000 revenue
$227,000 with National Park Service for Water Services. Signed on 2001-05-15. Completion date: 2011-05-15.
SOUTHWEST PARKS AND MONUMENTS (No data from D and B in FRITCH, TX)
$14,000 with Bureau of Reclamation for Guard Services. Signed on 2002-09-15. Completion date: 2002-09-15.
Top industries in this zip code by the number of employees in 2005:
Real Estate and Rental and Leasing: Video Tape and Disc Rental (20-49 employees: 1 establishment)
Accommodation and Food Services: Full-Service Restaurants (10-19: 1)
Other Services (except Public Administration): Religious Organizations (5-9: 1, 1-4: 4)
Mining: Natural Gas Liquid Extraction (10-19: 1)
Construction: Plumbing, Heating, and Air-Conditioning Contractors (5-9: 1, 1-4: 1)
Finance and Insurance: Credit Unions (5-9: 1, 1-4: 1)
Fatal accident statistics in 2014:
Fatal accident count: 2
Vehicles involved in fatal accidents: 4
Fatal accidents caused by drunken drivers: 2
Fatalities: 3
Persons involved in fatal accidents: 4
Pedestrians involved in fatal accidents: 0
Fatal accident statistics in 2013:
Fatal accident count: 1
Vehicles involved in fatal accidents: 2
Fatal accidents caused by drunken drivers: 0
Fatalities: 1
Persons involved in fatal accidents: 6
Pedestrians involved in fatal accidents: 0
2002 - 2018 National Fire Incident Reporting System (NFIRS) incidents
According to the data from the years 2002 - 2018 the average number of fires per year is 45. The highest number of reported fire incidents - 79 took place in 2018, and the least - 2 in 2013. The data has a rising trend.
When looking into fire subcategories, the most reports belonged to: Outside Fires (66.4%), and Structure Fires (21.9%).
Fire incident types reported to NFIRS in Zip Code 79036
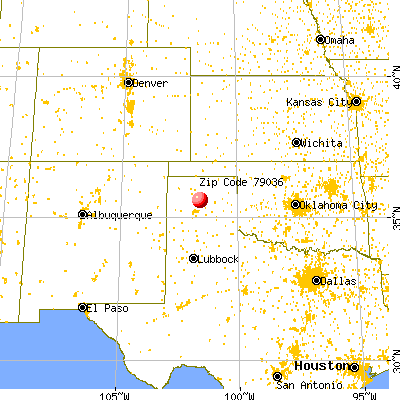


 Nearest zip codes: 79078, 79007, 79083, 79105, 79068, 79058.
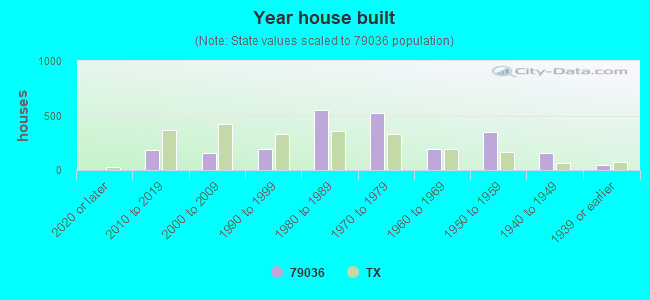


 According to the data from the years 2002 - 2018 the average number of fires per year is 45. The highest number of reported fire incidents - 79 took place in 2018, and the least - 2 in 2013. The data has a rising trend.
 When looking into fire subcategories, the most reports belonged to: Outside Fires (66.4%), and Structure Fires (21.9%).