Estimated zip code population in 2022: 29,226 Zip code population in 2010: 27,728 Zip code population in 2000: 24,981
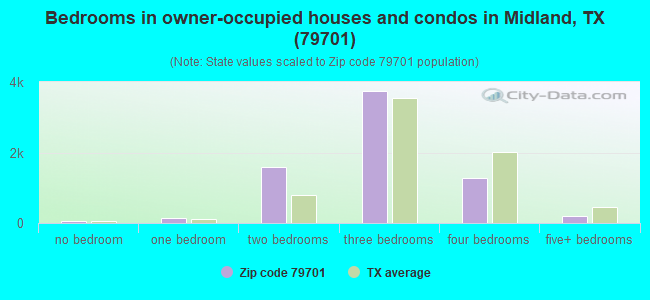
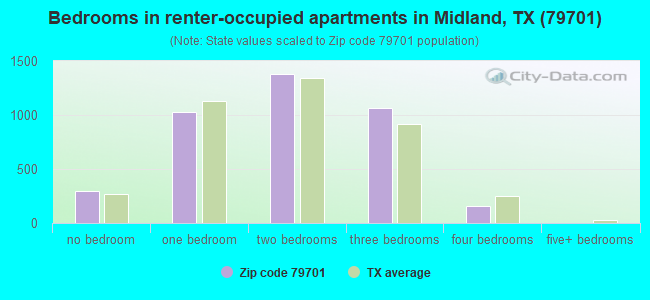
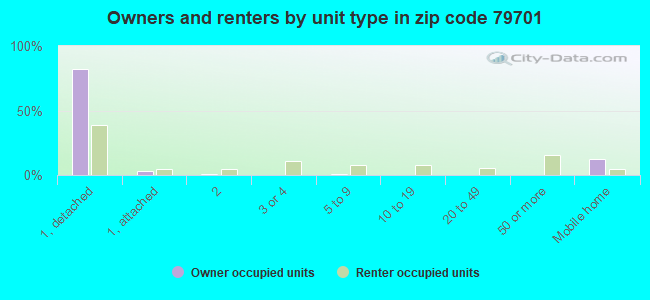
Houses and condos: 12,075 Renter-occupied apartments: 3,929
% of renters here:
36%
State:
38%
March 2022 cost of living index in zip code 79701: 84.7 (less than average, U.S. average is 100)
Land area: 11.9 sq. mi. Water area: 0.0 sq. mi.
Population density: 2,458 people per square mile
(low).
OSM Map
General Map
Google Map
MSN Map
OSM Map
General Map
Google Map
MSN Map
OSM Map
General Map
Google Map
MSN Map
OSM Map
General Map
Google Map
MSN Map
Please wait while loading the map...
Real estate property taxes paid for housing units in 2022:
This zip code:
0.9% ($2,012)
Texas:
1.5% ($4,050)
Median real estate property taxes paid for housing units with mortgages in 2022: $2,941 (1.1%) Median real estate property taxes paid for housing units with no mortgage in 2022: $1,633 (0.9%)
Averages for the 2020 tax year for zip code 79701, filed in 2021:
Average Adjusted Gross Income (AGI) in 2020: $76,336 (Individual Income Tax Returns)
Here:
$76,336
State:
$77,054
Salary/wage: $50,928 (reported on 86.4% of returns)
Here:
$50,928
State:
$62,766
(% of AGI for various income ranges: 1168.3% for AGIs below $25k, 3605.9% for AGIs $25k-50k, 6544.8% for AGIs $50k-75k, 9825.5% for AGIs $75k-100k, 16929.6% for AGIs $100k-200k, 80212.9% for AGIs over 200k)
Taxable interest for individuals: $4,122 (reported on 14.2% of returns)
This zip code:
$4,122
Texas:
$2,665
(% of AGI for various income ranges: 3.2% for AGIs below $25k, 4.9% for AGIs $25k-50k, 6.9% for AGIs $50k-75k, 13.7% for AGIs $75k-100k, 80.3% for AGIs $100k-200k, 4662.9% for AGIs over 200k)
Ordinary dividends: $30,130 (reported on 8.3% of returns)
Here:
$30,130
State:
$10,044
(% of AGI for various income ranges: 8.0% for AGIs below $25k, 8.8% for AGIs $25k-50k, 27.7% for AGIs $50k-75k, 84.0% for AGIs $75k-100k, 217.5% for AGIs $100k-200k, 20883.6% for AGIs over 200k)
Net capital gain/loss in AGI: +$54,012 (reported on 8.2% of returns)
Here:
+$54,012
State:
+$39,590
(% of AGI for various income ranges: 6.6% for AGIs below $25k, 10.1% for AGIs $25k-50k, 27.7% for AGIs $50k-75k, 143.7% for AGIs $75k-100k, 507.3% for AGIs $100k-200k, 37016.4% for AGIs over 200k)
Profit/loss from business: +$18,046 (reported on 21.3% of returns)
Here:
+$18,046
State:
+$10,888
(% of AGI for various income ranges: 223.6% for AGIs below $25k, 110.7% for AGIs $25k-50k, 179.4% for AGIs $50k-75k, 212.8% for AGIs $75k-100k, 587.7% for AGIs $100k-200k, 21128.6% for AGIs over 200k)
Taxable individual retirement arrangement distribution: $18,360 (reported on 3.3% of returns)
79701:
$18,360
Texas:
$24,740
(% of AGI for various income ranges: 14.3% for AGIs below $25k, 17.6% for AGIs $25k-50k, 63.4% for AGIs $50k-75k, 68.4% for AGIs $75k-100k, 310.4% for AGIs $100k-200k, 2097.9% for AGIs over 200k)
Self-employed (Keogh) retirement plans: $23,733 (reported on 0.2% of returns)
79701:
$23,733
Texas:
$29,298
(% of AGI for various income ranges: 508.6% for AGIs over 200k)
Total itemized deductions: $67,305 (reported on 4.4% of returns)
Here:
$67,305
State:
$40,428
(% of AGI for various income ranges: 14.3% for AGIs below $25k, 62.2% for AGIs $25k-50k, 107.9% for AGIs $50k-75k, 299.3% for AGIs $75k-100k, 672.6% for AGIs $100k-200k, 19616.4% for AGIs over 200k)
Charity contributions: $39,533 (reported on 3.7% of returns)
Here:
$39,533
State:
$18,201
(% of AGI for various income ranges: 10.4% for AGIs $25k-50k, 27.1% for AGIs $50k-75k, 64.3% for AGIs $75k-100k, 203.0% for AGIs $100k-200k, 11561.4% for AGIs over 200k)
Taxes paid: $7,142 (reported on 4.4% of returns)
79701:
$7,142
State:
$7,821
(% of AGI for various income ranges: 2.6% for AGIs below $25k, 6.1% for AGIs $25k-50k, 18.0% for AGIs $50k-75k, 59.1% for AGIs $75k-100k, 148.1% for AGIs $100k-200k, 1373.6% for AGIs over 200k)
Earned income credit: $2,575 (reported on 26.7% of returns)
Here:
$2,575
State:
$2,584
(% of AGI for various income ranges: 162.0% for AGIs below $25k, 94.9% for AGIs $25k-50k, 2.5% for AGIs $50k-75k)
Percentage of individuals using paid preparers for their 2020 taxes: 92.6%
Here:
93%
State:
92%
(% for various income ranges: 92.1% for AGIs below $25k, 93.3% for AGIs $25k-50k, 92.8% for AGIs $50k-75k, 90.9% for AGIs $75k-100k, 93.3% for AGIs $100k-200k, 94.0% for AGIs over 200k)
Averages for the 2012 tax year for zip code 79701, filed in 2013:
Average Adjusted Gross Income (AGI) in 2012: $75,903 (Individual Income Tax Returns)
Here:
$75,903
State:
$65,384
Salary/wage: $43,489 (reported on 88.4% of returns)
Here:
$43,489
State:
$52,524
(% of AGI for various income ranges: 83.8% for AGIs below $25k, 90.0% for AGIs $25k-50k, 89.1% for AGIs $50k-75k, 86.7% for AGIs $75k-100k, 75.6% for AGIs $100k-200k, 15.8% for AGIs over 200k)
Taxable interest for individuals: $10,116 (reported on 14.5% of returns)
This zip code:
$10,116
Texas:
$2,372
(% of AGI for various income ranges: 0.3% for AGIs below $25k, 0.3% for AGIs $25k-50k, 0.2% for AGIs $50k-75k, 0.2% for AGIs $75k-100k, 0.6% for AGIs $100k-200k, 3.6% for AGIs over 200k)
Ordinary dividends: $35,890 (reported on 8.8% of returns)
Here:
$35,890
State:
$9,721
(% of AGI for various income ranges: 1.4% for AGIs below $25k, 0.6% for AGIs $25k-50k, 0.5% for AGIs $50k-75k, 0.7% for AGIs $75k-100k, 1.2% for AGIs $100k-200k, 7.5% for AGIs over 200k)
Net capital gain/loss in AGI: +$157,170 (reported on 7.7% of returns)
Here:
+$157,170
State:
+$35,319
(% of AGI for various income ranges: 0.2% for AGIs below $25k, 0.2% for AGIs $25k-50k, 0.2% for AGIs $50k-75k, 0.6% for AGIs $75k-100k, 1.2% for AGIs $100k-200k, 31.6% for AGIs over 200k)
Profit/loss from business: +$17,946 (reported on 18.9% of returns)
Here:
+$17,946
State:
+$13,732
(% of AGI for various income ranges: 10.7% for AGIs below $25k, 4.8% for AGIs $25k-50k, 3.1% for AGIs $50k-75k, 3.3% for AGIs $75k-100k, 8.2% for AGIs $100k-200k, 3.1% for AGIs over 200k)
Taxable individual retirement arrangement distribution: $16,200 (reported on 4.3% of returns)
79701:
$16,200
Texas:
$19,511
(% of AGI for various income ranges: 1.1% for AGIs below $25k, 0.7% for AGIs $25k-50k, 1.0% for AGIs $50k-75k, 1.1% for AGIs $75k-100k, 1.6% for AGIs $100k-200k, 0.7% for AGIs over 200k)
Self-employment retirement plans: $34,000 (reported on 0.5% of returns)
79701:
$34,000
Texas:
$23,938
(% of AGI for various income ranges: 0.4% for AGIs below $25k, 0.4% for AGIs over 200k)
Total itemized deductions: $42,444 (14% of AGI, reported on 14.0% of returns)
Here:
$42,444
State:
$24,724
Here:
13.9% of AGI
State:
15.9% of AGI
(% of AGI for various income ranges: 3.1% for AGIs below $25k, 4.3% for AGIs $25k-50k, 5.6% for AGIs $50k-75k, 6.9% for AGIs $75k-100k, 8.0% for AGIs $100k-200k, 10.0% for AGIs over 200k)
Charity contributions: $26,685 (reported on 9.7% of returns)
Here:
$26,685
State:
$6,808
(% of AGI for various income ranges: 0.3% for AGIs below $25k, 0.5% for AGIs $25k-50k, 0.8% for AGIs $50k-75k, 1.0% for AGIs $75k-100k, 1.9% for AGIs $100k-200k, 5.9% for AGIs over 200k)
Taxes paid: $7,842 (reported on 13.3% of returns)
79701:
$7,842
State:
$6,921
(% of AGI for various income ranges: 0.4% for AGIs below $25k, 0.7% for AGIs $25k-50k, 0.8% for AGIs $50k-75k, 1.3% for AGIs $75k-100k, 1.9% for AGIs $100k-200k, 1.7% for AGIs over 200k)
Earned income credit: $2,594 (reported on 28.8% of returns)
Here:
$2,594
State:
$2,570
(% of AGI for various income ranges: 10.5% for AGIs below $25k, 1.7% for AGIs $25k-50k)
Percentage of individuals using paid preparers for their 2012 taxes: 62.5%
Here:
63%
State:
51%
(% for various income ranges: 61.5% for AGIs below $25k, 58.5% for AGIs $25k-50k, 64.8% for AGIs $50k-75k, 63.7% for AGIs $75k-100k, 65.9% for AGIs $100k-200k, 85.1% for AGIs over 200k)
Averages for the 2004 tax year for zip code 79701, filed in 2005:
Average Adjusted Gross Income (AGI) in 2004: $46,958 (Individual Income Tax Returns)
Here:
$46,958
State:
$47,881
Salary/wage: $28,280 (reported on 85.3% of returns)
Here:
$28,280
State:
$41,947
(% of AGI for various income ranges: 156.8% for AGIs below $10k, 84.3% for AGIs $10k-25k, 87.1% for AGIs $25k-50k, 77.1% for AGIs $50k-75k, 68.4% for AGIs $75k-100k, 23.0% for AGIs over 100k)
Taxable interest for individuals: $4,846 (reported on 20.9% of returns)
This zip code:
$4,846
Texas:
$2,255
(% of AGI for various income ranges: 7.0% for AGIs below $10k, 1.2% for AGIs $10k-25k, 0.8% for AGIs $25k-50k, 1.3% for AGIs $50k-75k, 3.5% for AGIs $75k-100k, 2.7% for AGIs over 100k)
Taxable dividends: $10,206 (reported on 12.3% of returns)
Here:
$10,206
State:
$4,261
(% of AGI for various income ranges: 5.1% for AGIs below $10k, 0.5% for AGIs $10k-25k, 0.5% for AGIs $25k-50k, 1.3% for AGIs $50k-75k, 1.9% for AGIs $75k-100k, 4.1% for AGIs over 100k)
Net capital gain/loss: +$38,488 (reported on 11.1% of returns)
Here:
+$38,488
State:
+$16,110
(% of AGI for various income ranges: 31.8% for AGIs below $10k, 0.1% for AGIs $10k-25k, 0.1% for AGIs $25k-50k, 1.5% for AGIs $50k-75k, 2.2% for AGIs $75k-100k, 15.5% for AGIs over 100k)
Profit/loss from business: +$28,171 (reported on 18.2% of returns)
Here:
+$28,171
State:
+$11,013
(% of AGI for various income ranges: 11.5% for AGIs below $10k, 7.1% for AGIs $10k-25k, 3.3% for AGIs $25k-50k, 4.0% for AGIs $50k-75k, 4.2% for AGIs $75k-100k, 16.1% for AGIs over 100k)
IRA payment deduction: $3,310 (reported on 1.2% of returns)
79701:
$3,310
Texas:
$3,120
(% of AGI for various income ranges: 0.4% for AGIs below $10k, 0.0% for AGIs $10k-25k, 0.1% for AGIs $25k-50k, 0.1% for AGIs $50k-75k, 0.3% for AGIs $75k-100k, 0.0% for AGIs over 100k)
Self-employed pension: $23,145 (reported on 0.7% of returns)
Here:
$23,145
Texas:
$16,401
Total itemized deductions: $31,949 (15% of AGI, reported on 11.3% of returns)
Here:
$31,949
State:
$19,631
Here:
14.5% of AGI
State:
18.9% of AGI
(% of AGI for various income ranges: 5.6% for AGIs below $10k, 1.9% for AGIs $10k-25k, 4.8% for AGIs $25k-50k, 7.2% for AGIs $50k-75k, 10.5% for AGIs $75k-100k, 9.8% for AGIs over 100k)
Charity contributions deductions: $20,832 (8% of AGI, reported on 9.4% of returns)
Here:
$20,832
State:
$4,753
Here:
8.2% of AGI
State:
4.2% of AGI
(% of AGI for various income ranges: 0.5% for AGIs below $10k, 0.2% for AGIs $10k-25k, 0.8% for AGIs $25k-50k, 1.5% for AGIs $50k-75k, 3.1% for AGIs $75k-100k, 6.8% for AGIs over 100k)
Total tax: $12,173 (reported on 58.4% of returns)
79701:
$12,173
State:
$9,058
(% of AGI for various income ranges: 5.3% for AGIs below $10k, 3.3% for AGIs $10k-25k, 5.5% for AGIs $25k-50k, 9.2% for AGIs $50k-75k, 12.3% for AGIs $75k-100k, 22.5% for AGIs over 100k)
Earned income credit: $2,067 (reported on 37.8% of returns)
Here:
$2,067
State:
$2,024
Percentage of individuals using paid preparers for their 2004 taxes: 69.8%
Here:
70%
State:
57%
(% for various income ranges: 66.3% for AGIs below $10k, 74.2% for AGIs $10k-25k, 68.0% for AGIs $25k-50k, 64.2% for AGIs $50k-75k, 65.0% for AGIs $75k-100k, 78.5% for AGIs over 100k)
Household received Food Stamps/SNAP in the past 12 months: 1,640 Household did not receive Food Stamps/SNAP in the past 12 months: 9,333
Women who had a birth in the past 12 months: 554 (458 now married, 100 unmarried) Women who did not have a birth in the past 12 months: 6,171 (2,596 now married, 3,579 unmarried)
Housing units in zip code 79701 with a mortgage: 2,199 (84 second mortgage, 39 both second mortgage and home equity loan) Median monthly owner costs for units with a mortgage: $1,685 Median monthly owner costs for units without a mortgage: $587
Residents with income below the poverty level in 2022:
This zip code:
20.9%
Whole state:
14.0%
Residents with income below 50% of the poverty level in 2022:
This zip code:
12.7%
Whole state:
7.4%
Median number of rooms in houses and condos:
Here:
5.7
State:
6.3
Median number of rooms in apartments:
Here:
4.1
State:
4.0
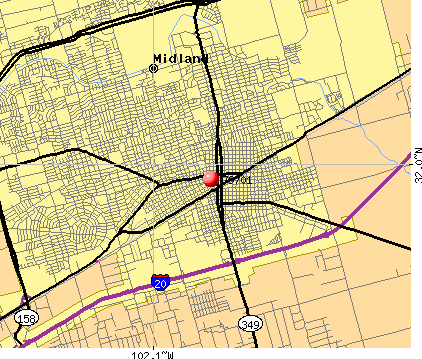
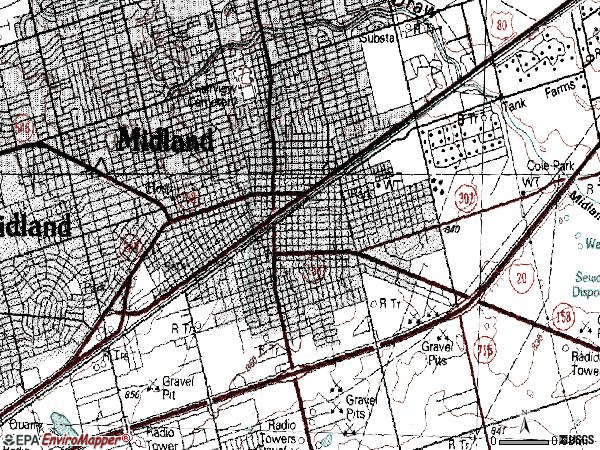
Notable locations in this zip code not listed on our city pages
Notable locations in zip code 79701: Fred and Juliette Turner House (A), Midland County Courthouse (B), Midland Fire Department Station 3 (C), Midland Fire Department Station 2 (D), Z Taylor Brown-Sarah Dorsey Medallion Home (E), Permian Basin Petroleum Museum (F), Museum of the Southwest (G), Midland County Historical Museum (H), Midland Fire Department and Emergency Medical Services (I), Brown-Dorsey House (J), Nita Stewart Haley Memorial Library (K). Display/hide their locations on the map
Churches in zip code 79701 include: First Baptist Church (A), Trinity Presbyterian Church (B), Saint Luke's United Methodist Church (C), First Baptist Church Mission House (D), First Baptist Church (E), Emmanuel Baptist Church (F), Dellwood Baptist Church (G), Bethel Missionary Baptist Church (H), Faith Tabernacle Apostolic Church (I). Display/hide their locations on the map
Parks in zip code 79701 include: Halff Park (1), Haley Park (2), Halff Park (3), Gowden Park (4), Wadley Barron Park (5), Ulmer Park (6), Taylor Park (7), Sparks Park (8), Elkin Park (9). Display/hide their locations on the map
In group quarters: 721 (-1 institutionalized population)
Size of family households: 2,105 2-persons, 2,170 3-persons, 1,390 4-persons, 941 5-persons, 653 6-persons, 166 7-or-more-persons
Size of nonfamily households: 2,970 1-person, 526 2-persons, 10 3-persons
4,634 married couples with children.
2,668 single-parent households (735 men, 1,933 women).
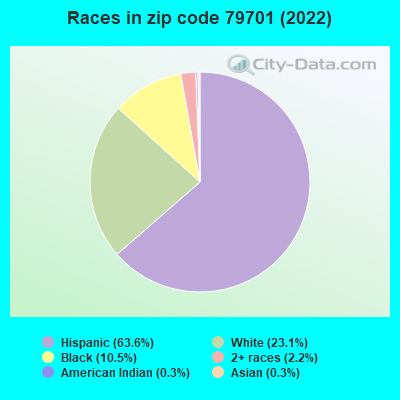
50.4% of residents of 79701 zip code speak English at home.
48.5% of residents speak Spanish at home (60% very well, 18% well, 15% not well, 7% not at all).
0.2% of residents speak other Indo-European language at home (72% very well, 28% well).
0.3% of residents speak Asian or Pacific Island language at home (17% very well, 25% well, 57% not well).
0.3% of residents speak other language at home (35% very well, 65% not well).
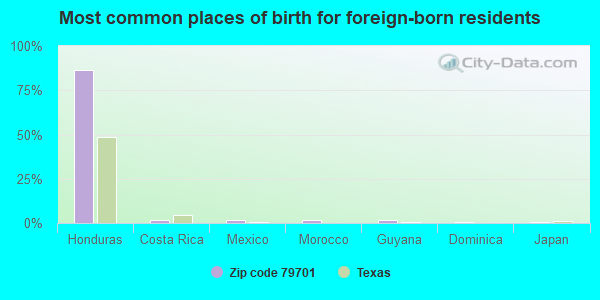
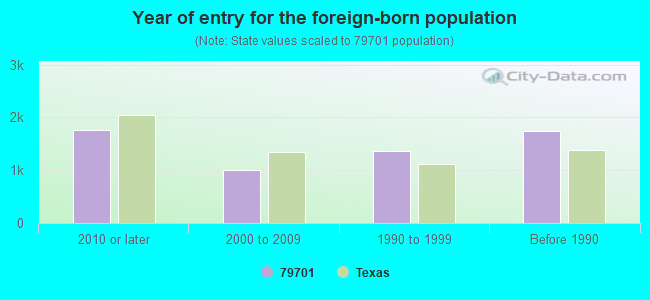
Foreign born population: 5,565 (19.0%) (40.6% of them are naturalized citizens)
Facilities with environmental interests located in this zip code:
ARCO PIPELINE COMPANY (4500 EAST HIGHWAY 80 in MIDLAND, TX)
AIR MINOR (AIRS/AFS) CRITERIA AND HAZARDOUS AIR POLLUTANT INVENTORY (Inventory of air pollution sources) (Resource Conservation and Recovery Act (tracking hazardous waste)) Business SIC classification: CRUDE PETROLEUM PIPELINES; PETROLEUM BULK STATIONS AND TERMINALS Business NAICS classification: PIPELINE TRANSPORTATION OF CRUDE OIL. Organizations: ARCO PIPE LINE COMPANY (CONTACT/OPERATOR)
Alternative names: ARCO PIPE LINE MIDLAND MAINTENANCE
120 WEST AUTO SALVAGE (TXU010755) (COUNTY ROAD 120 & 11W in MIDLAND, TX)
B & W PAINT & BODY SHOP (1608 W FRONT STREET in MIDLAND, TX)
(Resource Conservation and Recovery Act (tracking hazardous waste)) Business NAICS classification: AUTOMOTIVE BODY, PAINT, AND INTERIOR REPAIR AND MAINTENANCE. Alternative names: B&W PAINT & BO/SH
ASHLAND CHEMICAL COMPANY (RANKIN HWY in MIDLAND, TX)
Large Quantity Generators, more that 1000 kg of hazardous waste/month (Resource Conservation and Recovery Act (tracking hazardous waste)) TRANSPORTER (Resource Conservation and Recovery Act (tracking hazardous waste)) - notification
APEX SIGNS (3202 W WALL in MIDLAND, TX)
(Resource Conservation and Recovery Act (tracking hazardous waste))
ARC BODY SHOP (2800 W FRANCIS in MIDLAND, TX)
(Resource Conservation and Recovery Act (tracking hazardous waste)) Business NAICS classification: AUTOMOTIVE BODY, PAINT, AND INTERIOR REPAIR AND MAINTENANCE. Organizations: ALLEN Z FRAISER (CONTACT/OPERATOR)
CO2 INC (PORTABLE SOURCE in PORTABLE SOURCE, NM)
AIR MINOR (AIRS/AFS) Business SIC classification: OIL AND GAS FIELD SERVICES Alternative names: CO2 INC CO2 INC, CO2 INC PORTABLE CO2 PUMP
ANTHONY SIGN (1101 S LAMESA in MIDLAND, TX)
(Resource Conservation and Recovery Act (tracking hazardous waste))
AUTOMOTIVE SPECIALTIES (706 S COLORADO in MIDLAND, TX)
(Resource Conservation and Recovery Act (tracking hazardous waste))
AMERICAN GATHERING L.P. (.9 MI. S. ON PLT. RD. in MIDLAND, TX)
AIR MAJOR (AIRS/AFS) CRITERIA AND HAZARDOUS AIR POLLUTANT INVENTORY (Inventory of air pollution sources) Business SIC classification: NATURAL GAS TRANSMISSION Business NAICS classification: PIPELINE TRANSPORTATION OF NATURAL GAS.
AZALEA BOOSTER STATION (0.7 MI. W., F.M. 1317; 1.7 MI. in MIDLAND, TX)
AIR MAJOR (AIRS/AFS) CRITERIA AND HAZARDOUS AIR POLLUTANT INVENTORY (Inventory of air pollution sources) Business SIC and NAICS classification: CRUDE PETROLEUM AND NATURAL GAS Alternative names: DUKE ENERGY FIELD SERVICES, L.P., G.P.M. GAS SERVICES COMPANY
ARCO PERMIAN (10 M W ON IH 20 16 M S ON FM 1 in MIDLAND, TX)
CRITERIA AND HAZARDOUS AIR POLLUTANT INVENTORY (Inventory of air pollution sources) Business SIC and NAICS classification: CRUDE PETROLEUM AND NATURAL GAS
Housing units lacking complete plumbing facilities: 3.2% Housing units lacking complete kitchen facilities: 2.8%
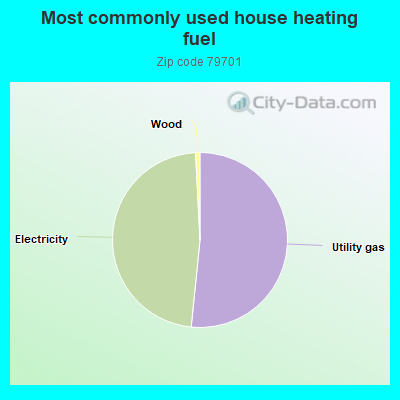
51.3%Utility gas
47.3%Electricity
0.8%Wood
Population in 1990: 32,926.
Place of birth for U.S.-born residents:
This state: 18,901
Northeast: 264
Midwest: 1,036
South: 943
West: 2,064
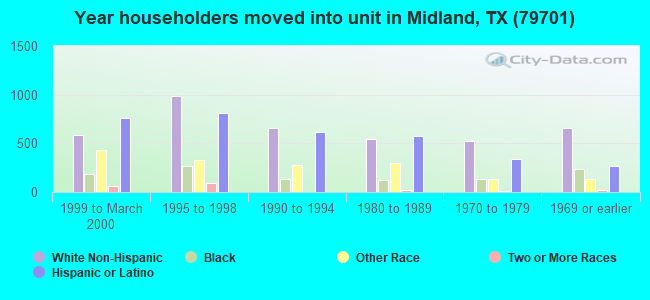
61% of the 79701 zip code residents lived in the same house 5 years ago. Out of people who lived in different houses, 66% lived in this county. Out of people who lived in different counties, 50% lived in Texas.
88% of the 79701 zip code residents lived in the same house 1 year ago. Out of people who lived in different houses, 52% moved from this county. Out of people who lived in different houses, 32% moved from different county within same state. Out of people who lived in different houses, 14% moved from different state. Out of people who lived in different houses, 1% moved from abroad.
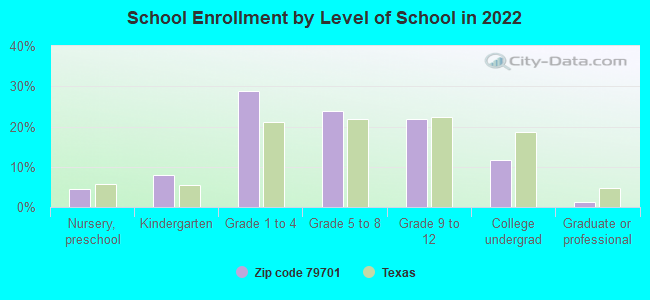
Private vs. public school enrollment:
Students in private schools in grades 1 to 8 (elementary and middle school): 617
Here:
14.9%
Texas:
8.8%
Students in private schools in grades 9 to 12 (high school): 49
Here:
2.9%
Texas:
8.0%
Students in private undergraduate colleges: 53
Here:
5.9%
Texas:
16.2%
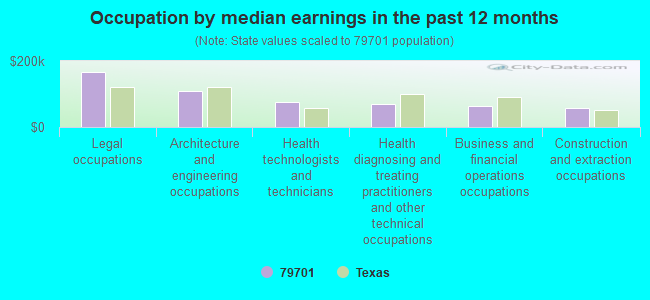
Occupation by median earnings in the past 12 months ($)
166,309Legal occupations
110,052Architecture and engineering occupations
74,368Health technologists and technicians
68,470Health diagnosing and treating practitioners and other technical occupations
62,733Business and financial operations occupations
58,247Construction and extraction occupations
Companies with federal contracts located in this zip code (MIDLAND, TX):
DAWSON GEOPHYSICAL CO INC (508 W WALL STE 800) : $1,970,195 in 4 contractsfrom 1999 to 2005
$1,340,050 with Navy for Other Special Studies and Analyses. Signed on 2003-09-25. Completion date: 2004-01-23.
$495,425 with Navy for Other Photographic, Mapping, Printing, and Publication Services. Taking place in CA. Signed on 1999-12-06. Completion date: 2000-06-26.
$69,184 with Navy for Other Photographic, Mapping, Printing, and Publication Services. Signed on 2000-02-01. Completion date: 2000-06-30.
$65,536 with Navy for Scientific Data Studies. Signed on 2005-06-23. Completion date: 2005-11-11.
FIRST SERVICE AIR CONDITIONING (3009 GARDEN CITY HWY; small business) : $1,701,901 in 25 contractsfrom 2000 to 2006
Contracts for Maintenance, Repair or Alteration of Real Property -- Office Buildings, Maintenance, Repair or Alteration of Real Property -- Troop Housing Facilities, Maintenance, Repair or Alteration of Real Property -- Heating and Cooling Plants, Maintenance, Repair and Rebuilding of Equipment -- Refrigeration, Air Conditioning, and Air Circulating Equipment, and moreby Public Buildings Service, Air Force Signed by year:2000: $1,258,905; 2001: $211,460; 2002: $122,847; 2003: $34,707; 2004: $0; 2005: $56,426; 2006: $17,556.
Biggest contracts:
$645,000 with Public Buildings Service for Maintenance, Repair or Alteration of Real Property -- Office Buildings. Signed on 2000-10-15. Completion date: 2001-05-15.
$392,000, same as above.Signed on 2000-12-15. Completion date: 2001-08-15.
$165,000, same as above.Signed on 2000-09-15. Completion date: 2001-03-15.
$67,000, same as above.Signed on 2001-08-15. Completion date: 2001-10-15.
PROFESSIONAL JANITORIAL SERVIC (3222 COMMERCIAL DR; small business) : $42,845 in 7 contractsfrom 2002 to 2006
Contracts for Custodial Janitorial Services by Army Signed by year:2000: $0; 2001: $0; 2002: $4,895; 2003: $9,790; 2004: $10,270; 2005: $10,270; 2006: $7,620.
Biggest contracts:
$10,270 with Army for Custodial Janitorial Services. Signed on 2005-01-28. Completion date: 2006-03-31.
$10,270, same as above.Signed on 2004-03-04. Completion date: 2005-03-31.
$9,790, same as above.Signed on 2003-03-04. Completion date: 2003-03-31.
$4,895, same as above.Signed on 2002-11-26. Completion date: 2003-03-31.
YOUNG, JOHN (1219 S FAIRGROUNDS RD; small business)
-$1,915 with Air Force for Education Services. Signed on 2005-09-13. Completion date: 2005-09-13.
Top industries in this zip code by the number of employees in 2005:
Health Care and Social Assistance: General Medical and Surgical Hospitals (over 1000 employees: 1 establishment)
Mining: Crude Petroleum and Natural Gas Extraction (250-499: 1, 50-99: 4, 20-49: 4, 10-19: 12, 5-9: 28, 1-4: 128)
2004 - 2018 National Fire Incident Reporting System (NFIRS) incidents
According to the data from the years 2004 - 2018 the average number of fires per year is 244. The highest number of fires - 723 took place in 2008, and the least - 0 in 2010. The data has a decreasing trend.
When looking into fire subcategories, the most reports belonged to: Outside Fires (58.5%), and Structure Fires (25.6%).
Fire incident types reported to NFIRS in Zip Code 79701

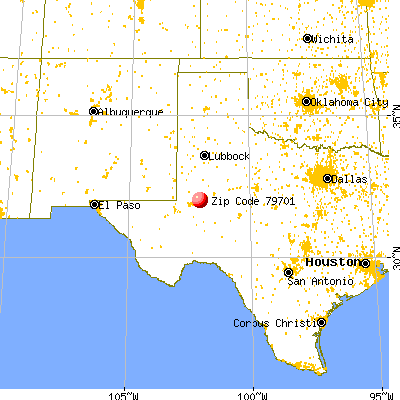


 Nearest zip codes: 79703, 79705, 79707, 79706, 79765, 79758.


 According to the data from the years 2004 - 2018 the average number of fires per year is 244. The highest number of fires - 723 took place in 2008, and the least - 0 in 2010. The data has a decreasing trend.
 When looking into fire subcategories, the most reports belonged to: Outside Fires (58.5%), and Structure Fires (25.6%).