Estimated zip code population in 2022: 22,010 Zip code population in 2010: 20,592 Zip code population in 2000: 18,582
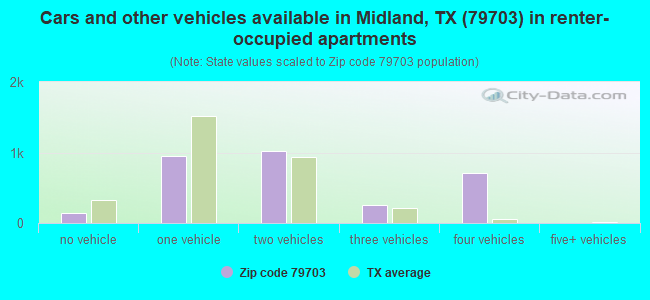
Houses and condos: 8,708 Renter-occupied apartments: 3,091
% of renters here:
36%
State:
38%
March 2022 cost of living index in zip code 79703: 84.5 (less than average, U.S. average is 100)
Land area: 6.7 sq. mi. Water area: 0.0 sq. mi.
Population density: 3,288 people per square mile
(average).
OSM Map
General Map
Google Map
MSN Map
OSM Map
General Map
Google Map
MSN Map
OSM Map
General Map
Google Map
MSN Map
OSM Map
General Map
Google Map
MSN Map
Please wait while loading the map...
Real estate property taxes paid for housing units in 2022:
This zip code:
1.1% ($2,719)
Texas:
1.5% ($4,050)
Median real estate property taxes paid for housing units with mortgages in 2022: $2,938 (1.2%) Median real estate property taxes paid for housing units with no mortgage in 2022: $2,315 (1.0%)
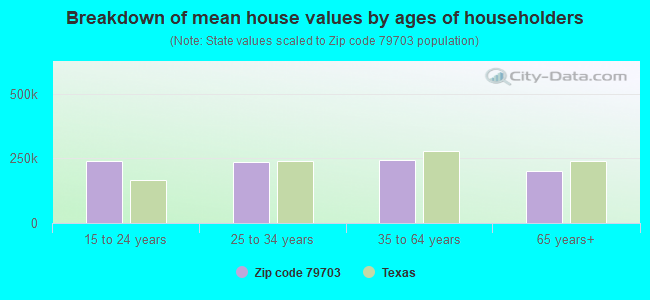
Estimated median house/condo value in 2022: $244,504
79703:
$244,504
Texas:
$275,400
According to our research of Texas and other state lists, there were 51 registered sex offenders living in 79703 zip code as of April 27, 2024. The ratio of all residents to sex offenders in zip code 79703 is 450 to 1. The ratio of registered sex offenders to all residents in this zip code is near the state average.
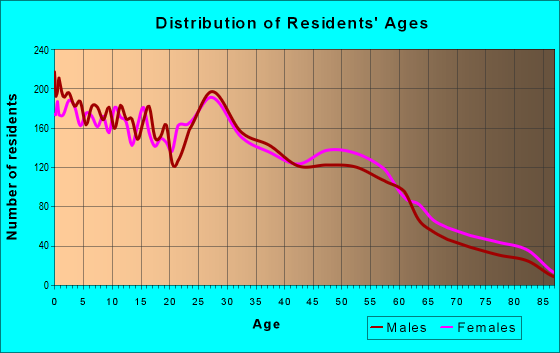
Median resident age:
This zip code:
31.4 years
Texas median age:
35.6 years
Average household size:
This zip code:
2.6 people
Texas:
2.6 people
Averages for the 2020 tax year for zip code 79703, filed in 2021:
Average Adjusted Gross Income (AGI) in 2020: $56,095 (Individual Income Tax Returns)
Here:
$56,095
State:
$77,054
Salary/wage: $52,101 (reported on 89.5% of returns)
Here:
$52,101
State:
$62,766
(% of AGI for various income ranges: 1229.3% for AGIs below $25k, 3570.3% for AGIs $25k-50k, 6531.2% for AGIs $50k-75k, 9467.1% for AGIs $75k-100k, 16018.7% for AGIs $100k-200k, 49375.0% for AGIs over 200k)
Taxable interest for individuals: $699 (reported on 14.7% of returns)
This zip code:
$699
Texas:
$2,665
(% of AGI for various income ranges: 5.4% for AGIs below $25k, 6.0% for AGIs $25k-50k, 8.9% for AGIs $50k-75k, 17.6% for AGIs $75k-100k, 27.7% for AGIs $100k-200k, 383.3% for AGIs over 200k)
Ordinary dividends: $2,879 (reported on 7.3% of returns)
Here:
$2,879
State:
$10,044
(% of AGI for various income ranges: 12.7% for AGIs below $25k, 7.0% for AGIs $25k-50k, 13.2% for AGIs $50k-75k, 24.4% for AGIs $75k-100k, 67.4% for AGIs $100k-200k, 1023.3% for AGIs over 200k)
Net capital gain/loss in AGI: +$6,690 (reported on 7.0% of returns)
Here:
+$6,690
State:
+$39,590
(% of AGI for various income ranges: 4.0% for AGIs below $25k, 4.8% for AGIs $25k-50k, 17.0% for AGIs $50k-75k, 40.4% for AGIs $75k-100k, 165.9% for AGIs $100k-200k, 3863.3% for AGIs over 200k)
Profit/loss from business: +$7,879 (reported on 16.9% of returns)
Here:
+$7,879
State:
+$10,888
(% of AGI for various income ranges: 103.0% for AGIs below $25k, 71.5% for AGIs $25k-50k, 109.3% for AGIs $50k-75k, 75.7% for AGIs $75k-100k, 387.8% for AGIs $100k-200k, 5688.3% for AGIs over 200k)
Taxable individual retirement arrangement distribution: $15,574 (reported on 4.4% of returns)
79703:
$15,574
Texas:
$24,740
(% of AGI for various income ranges: 27.4% for AGIs below $25k, 48.6% for AGIs $25k-50k, 63.2% for AGIs $50k-75k, 118.7% for AGIs $75k-100k, 348.4% for AGIs $100k-200k)
Total itemized deductions: $34,397 (reported on 3.1% of returns)
Here:
$34,397
State:
$40,428
(% of AGI for various income ranges: 73.0% for AGIs $25k-50k, 140.0% for AGIs $50k-75k, 195.2% for AGIs $75k-100k, 429.4% for AGIs $100k-200k, 1955.0% for AGIs over 200k)
Charity contributions: $10,171 (reported on 2.1% of returns)
Here:
$10,171
State:
$18,201
(% of AGI for various income ranges: 8.1% for AGIs $25k-50k, 21.3% for AGIs $50k-75k, 36.1% for AGIs $75k-100k, 153.0% for AGIs $100k-200k)
Taxes paid: $5,547 (reported on 3.1% of returns)
79703:
$5,547
State:
$7,821
(% of AGI for various income ranges: 9.5% for AGIs $25k-50k, 25.8% for AGIs $50k-75k, 34.5% for AGIs $75k-100k, 67.6% for AGIs $100k-200k, 306.7% for AGIs over 200k)
Earned income credit: $2,432 (reported on 19.2% of returns)
Here:
$2,432
State:
$2,584
(% of AGI for various income ranges: 123.5% for AGIs below $25k, 76.9% for AGIs $25k-50k, 1.9% for AGIs $50k-75k)
Percentage of individuals using paid preparers for their 2020 taxes: 93.2%
Here:
93%
State:
92%
(% for various income ranges: 92.4% for AGIs below $25k, 94.2% for AGIs $25k-50k, 93.4% for AGIs $50k-75k, 92.3% for AGIs $75k-100k, 93.6% for AGIs $100k-200k, 93.3% for AGIs over 200k)
Averages for the 2012 tax year for zip code 79703, filed in 2013:
Average Adjusted Gross Income (AGI) in 2012: $52,522 (Individual Income Tax Returns)
Here:
$52,522
State:
$65,384
Salary/wage: $49,213 (reported on 91.0% of returns)
Here:
$49,213
State:
$52,524
(% of AGI for various income ranges: 83.4% for AGIs below $25k, 89.7% for AGIs $25k-50k, 89.7% for AGIs $50k-75k, 89.9% for AGIs $75k-100k, 87.9% for AGIs $100k-200k, 49.9% for AGIs over 200k)
Taxable interest for individuals: $539 (reported on 16.6% of returns)
This zip code:
$539
Texas:
$2,372
(% of AGI for various income ranges: 0.3% for AGIs below $25k, 0.2% for AGIs $25k-50k, 0.1% for AGIs $50k-75k, 0.1% for AGIs $75k-100k, 0.3% for AGIs over 200k)
Ordinary dividends: $3,499 (reported on 7.8% of returns)
Here:
$3,499
State:
$9,721
(% of AGI for various income ranges: 0.6% for AGIs below $25k, 0.4% for AGIs $25k-50k, 0.3% for AGIs $50k-75k, 0.3% for AGIs $75k-100k, 0.4% for AGIs $100k-200k, 2.2% for AGIs over 200k)
Net capital gain/loss in AGI: +$4,335 (reported on 5.6% of returns)
Here:
+$4,335
State:
+$35,319
(% of AGI for various income ranges: 0.2% for AGIs $75k-100k, 0.3% for AGIs $100k-200k, 3.9% for AGIs over 200k)
Profit/loss from business: +$13,482 (reported on 15.2% of returns)
Here:
+$13,482
State:
+$13,732
(% of AGI for various income ranges: 8.6% for AGIs below $25k, 3.2% for AGIs $25k-50k, 2.6% for AGIs $50k-75k, 2.3% for AGIs $75k-100k, 3.5% for AGIs $100k-200k, 8.4% for AGIs over 200k)
Taxable individual retirement arrangement distribution: $12,035 (reported on 5.8% of returns)
79703:
$12,035
Texas:
$19,511
(% of AGI for various income ranges: 2.2% for AGIs below $25k, 1.0% for AGIs $25k-50k, 0.9% for AGIs $50k-75k, 1.4% for AGIs $75k-100k, 2.0% for AGIs $100k-200k)
Total itemized deductions: $18,423 (20% of AGI, reported on 16.1% of returns)
Here:
$18,423
State:
$24,724
Here:
20.4% of AGI
State:
15.9% of AGI
(% of AGI for various income ranges: 4.2% for AGIs below $25k, 5.2% for AGIs $25k-50k, 5.9% for AGIs $50k-75k, 5.6% for AGIs $75k-100k, 6.2% for AGIs $100k-200k, 5.7% for AGIs over 200k)
Charity contributions: $4,934 (reported on 10.3% of returns)
Here:
$4,934
State:
$6,808
(% of AGI for various income ranges: 0.4% for AGIs below $25k, 0.6% for AGIs $25k-50k, 0.8% for AGIs $50k-75k, 1.0% for AGIs $75k-100k, 1.3% for AGIs $100k-200k, 1.8% for AGIs over 200k)
Taxes paid: $3,666 (reported on 15.4% of returns)
79703:
$3,666
State:
$6,921
(% of AGI for various income ranges: 0.5% for AGIs below $25k, 0.9% for AGIs $25k-50k, 1.0% for AGIs $50k-75k, 1.1% for AGIs $75k-100k, 1.4% for AGIs $100k-200k, 0.9% for AGIs over 200k)
Earned income credit: $2,416 (reported on 19.1% of returns)
Here:
$2,416
State:
$2,570
(% of AGI for various income ranges: 7.8% for AGIs below $25k, 1.3% for AGIs $25k-50k)
Percentage of individuals using paid preparers for their 2012 taxes: 52.4%
Here:
52%
State:
51%
(% for various income ranges: 52.0% for AGIs below $25k, 47.4% for AGIs $25k-50k, 53.2% for AGIs $50k-75k, 53.2% for AGIs $75k-100k, 60.4% for AGIs $100k-200k, 81.8% for AGIs over 200k)
Averages for the 2004 tax year for zip code 79703, filed in 2005:
Average Adjusted Gross Income (AGI) in 2004: $31,877 (Individual Income Tax Returns)
Here:
$31,877
State:
$47,881
Salary/wage: $30,789 (reported on 88.9% of returns)
Here:
$30,789
State:
$41,947
(% of AGI for various income ranges: 95.2% for AGIs below $10k, 84.5% for AGIs $10k-25k, 89.0% for AGIs $25k-50k, 87.4% for AGIs $50k-75k, 87.4% for AGIs $75k-100k, 69.2% for AGIs over 100k)
Taxable interest for individuals: $1,089 (reported on 23.5% of returns)
This zip code:
$1,089
Texas:
$2,255
(% of AGI for various income ranges: 2.6% for AGIs below $10k, 1.3% for AGIs $10k-25k, 0.6% for AGIs $25k-50k, 0.6% for AGIs $50k-75k, 0.4% for AGIs $75k-100k, 1.2% for AGIs over 100k)
Taxable dividends: $1,667 (reported on 10.3% of returns)
Here:
$1,667
State:
$4,261
(% of AGI for various income ranges: 1.3% for AGIs below $10k, 0.4% for AGIs $10k-25k, 0.3% for AGIs $25k-50k, 0.4% for AGIs $50k-75k, 0.3% for AGIs $75k-100k, 1.9% for AGIs over 100k)
Net capital gain/loss: +$2,620 (reported on 8.3% of returns)
Here:
+$2,620
State:
+$16,110
(% of AGI for various income ranges: -1.3% for AGIs below $10k, 0.1% for AGIs $10k-25k, 0.2% for AGIs $25k-50k, 0.2% for AGIs $50k-75k, 0.3% for AGIs $75k-100k, 5.8% for AGIs over 100k)
Profit/loss from business: +$6,688 (reported on 14.6% of returns)
Here:
+$6,688
State:
+$11,013
(% of AGI for various income ranges: 1.4% for AGIs below $10k, 5.4% for AGIs $10k-25k, 2.5% for AGIs $25k-50k, 2.1% for AGIs $50k-75k, 2.6% for AGIs $75k-100k, 4.9% for AGIs over 100k)
IRA payment deduction: $2,968 (reported on 1.6% of returns)
79703:
$2,968
Texas:
$3,120
(% of AGI for various income ranges: 0.1% for AGIs $10k-25k, 0.2% for AGIs $25k-50k, 0.1% for AGIs $50k-75k, 0.2% for AGIs $75k-100k)
Self-employed pension: $5,385 (reported on 0.2% of returns)
Here:
$5,385
Texas:
$16,401
Total itemized deductions: $13,713 (24% of AGI, reported on 10.6% of returns)
Here:
$13,713
State:
$19,631
Here:
24.5% of AGI
State:
18.9% of AGI
(% of AGI for various income ranges: 3.5% for AGIs below $10k, 2.8% for AGIs $10k-25k, 4.3% for AGIs $25k-50k, 5.0% for AGIs $50k-75k, 5.3% for AGIs $75k-100k, 6.5% for AGIs over 100k)
Charity contributions deductions: $4,154 (7% of AGI, reported on 8.4% of returns)
Here:
$4,154
State:
$4,753
Here:
7.1% of AGI
State:
4.2% of AGI
(% of AGI for various income ranges: 0.4% for AGIs below $10k, 0.6% for AGIs $10k-25k, 0.7% for AGIs $25k-50k, 1.2% for AGIs $50k-75k, 1.7% for AGIs $75k-100k, 2.3% for AGIs over 100k)
Total tax: $3,741 (reported on 67.6% of returns)
79703:
$3,741
State:
$9,058
(% of AGI for various income ranges: 2.8% for AGIs below $10k, 3.6% for AGIs $10k-25k, 5.9% for AGIs $25k-50k, 8.7% for AGIs $50k-75k, 11.5% for AGIs $75k-100k, 16.7% for AGIs over 100k)
Earned income credit: $2,017 (reported on 26.4% of returns)
Here:
$2,017
State:
$2,024
Percentage of individuals using paid preparers for their 2004 taxes: 59.0%
Here:
59%
State:
57%
(% for various income ranges: 54.3% for AGIs below $10k, 64.1% for AGIs $10k-25k, 59.6% for AGIs $25k-50k, 57.1% for AGIs $50k-75k, 50.4% for AGIs $75k-100k, 56.3% for AGIs over 100k)
Household received Food Stamps/SNAP in the past 12 months: 597 Household did not receive Food Stamps/SNAP in the past 12 months: 7,856
Women who had a birth in the past 12 months: 860 (441 now married, 409 unmarried) Women who did not have a birth in the past 12 months: 4,932 (2,333 now married, 2,593 unmarried)
Housing units in zip code 79703 with a mortgage: 3,019 (137 second mortgage, 149 both second mortgage and home equity loan) Houses without a mortgage: 101
Median monthly owner costs for units with a mortgage: $1,593 Median monthly owner costs for units without a mortgage: $634
Residents with income below the poverty level in 2022:
This zip code:
4.0%
Whole state:
14.0%
Residents with income below 50% of the poverty level in 2022:
This zip code:
1.6%
Whole state:
7.4%
Median number of rooms in houses and condos:
Here:
5.7
State:
6.3
Median number of rooms in apartments:
Here:
4.1
State:
4.0
Notable locations in this zip code not listed on our city pages
Churches in zip code 79703 include: Saint Paul Church (A), Alamo Heights Church (B), Westside Church of Christ (C), Cornerstone Christian Fellowship (D), Crestview Baptist Church (E), Cuthbert Avenue Baptist Church (F), Bethel United Methodist Church (G), Church of God (H), Cuthbert and Austin Church of Christ (I). Display/hide their locations on the map
Parks in zip code 79703 include: House Park (1), Garrett Brown Park (2), Alamo Park (3), Lancaster Park (4), Doug Russell Park (5), Henderson Park (6). Display/hide their locations on the map
In group quarters: 13 (-1 institutionalized population)
Size of family households: 1,633 2-persons, 1,473 3-persons, 1,265 4-persons, 1,379 5-persons, 157 6-persons, 88 7-or-more-persons
Size of nonfamily households: 2,002 1-person, 303 2-persons, 110 3-persons
3,851 married couples with children.
1,759 single-parent households (760 men, 999 women).
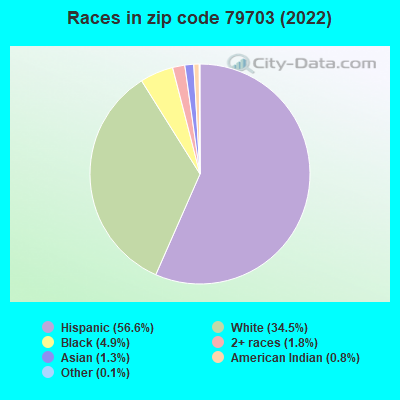
63.0% of residents of 79703 zip code speak English at home.
34.2% of residents speak Spanish at home (59% very well, 13% well, 17% not well, 12% not at all).
0.5% of residents speak other Indo-European language at home (64% very well, 36% well).
1.1% of residents speak Asian or Pacific Island language at home (31% very well, 49% well, 19% not well).
0.7% of residents speak other language at home (57% not well, 43% not at all).
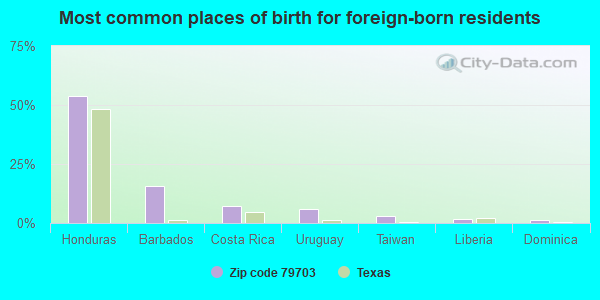
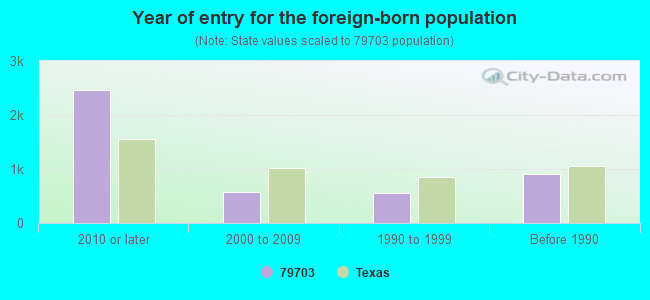
Foreign born population: 3,885 (17.7%) (34.5% of them are naturalized citizens)
Facilities with environmental interests located in this zip code:
ALAMO J H (3800 W STOREY AVE in MIDLAND, TX)
(National Center for Education Statistics) - STATE ID-165901041 Organizations: MIDLAND ISD (SCHOOL DISTRICT)
BAKER HUGHES OILFIELD OPERATIONS INC (2105 MARKET ST in MIDLAND, TX)
(Resource Conservation and Recovery Act (tracking hazardous waste)) Alternative names: BAKER HUGHES INTEQ
ABC DRY CLEANERS (3303 ANDREWS HIGHWAY in MIDLAND, TX)
(Resource Conservation and Recovery Act (tracking hazardous waste)) Alternative names: ONE HOUR MARTINIZING
Housing units lacking complete plumbing facilities: 1.4% Housing units lacking complete kitchen facilities: 0.4%
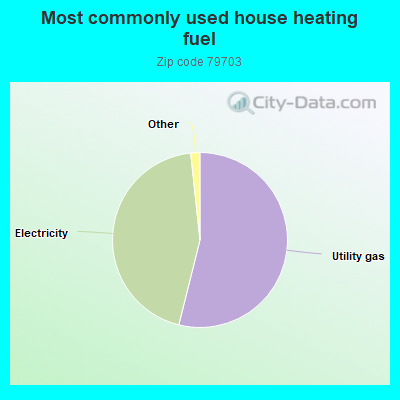
53.9%Utility gas
44.4%Electricity
0.6%Solar energy
0.5%No fuel used
Population in 1990: 23,167.
Place of birth for U.S.-born residents:
This state: 13,681
Northeast: 24
Midwest: 943
South: 795
West: 2,295
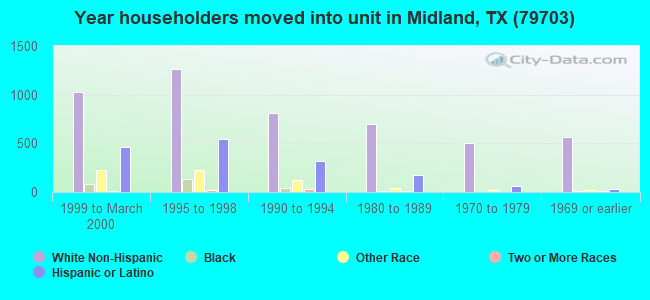
53% of the 79703 zip code residents lived in the same house 5 years ago. Out of people who lived in different houses, 63% lived in this county. Out of people who lived in different counties, 50% lived in Texas.
89% of the 79703 zip code residents lived in the same house 1 year ago. Out of people who lived in different houses, 63% moved from this county. Out of people who lived in different houses, 30% moved from different county within same state. Out of people who lived in different houses, 4% moved from different state.
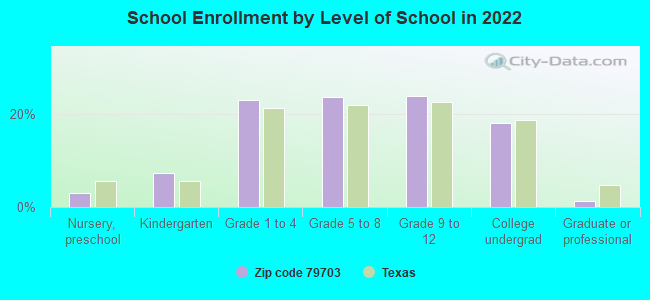
Private vs. public school enrollment:
Students in private schools in grades 1 to 8 (elementary and middle school): 987
Here:
32.9%
Texas:
8.8%
Students in private schools in grades 9 to 12 (high school): 240
Here:
16.0%
Texas:
8.0%
Students in private undergraduate colleges: 23
Here:
2.1%
Texas:
16.2%
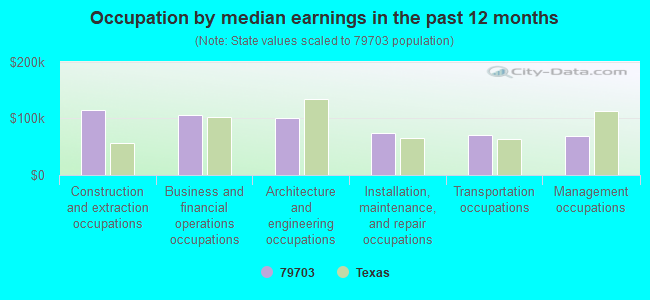
Occupation by median earnings in the past 12 months ($)
114,224Construction and extraction occupations
106,680Business and financial operations occupations
101,383Architecture and engineering occupations
74,172Installation, maintenance, and repair occupations
70,341Transportation occupations
69,288Management occupations
Companies with federal contracts located in this zip code:
SPINAL ADVANCEMENTS LP (5023 PRINCETON AVE STE 7 in MIDLAND, TX; small business) : $190,500 in 3 contractsin 2004
$69,000 with Army for Surgical Dressing Materials. Signed on 2004-05-27. Completion date: 2004-06-30.
$65,000 with Army for Medical and Surgical Instruments, Equipment, and Supplies. Signed on 2004-05-06. Completion date: 2004-05-06.
$56,500, same as above.Signed on 2004-04-08. Completion date: 2004-04-02.
TOMCAT USA, INC (2160 COMMERCE STREET in MIDLAND, TX; small business) : $37,927 in 2 contractsfrom 2003 to 2005
$27,992 with Air Force for Winches, Hoists, Cranes, and Derricks. Signed on 2003-09-16. Completion date: 2003-10-15.
$9,935 with Air Force for Gears, Pulleys, Sprockets, and Transmission Chain. Signed on 2005-08-10. Completion date: 2005-08-21.
ECO-LOGICAL ENVIRONMENTAL SERV (2200 MARKET STREET in MIDLAND, TX)
$8,130 with Army for Equipment and Materials Testing -- Service and Trade Equipment. Signed on 2004-04-12. Completion date: 2004-05-03.
Top industries in this zip code by the number of employees in 2005:
Administrative and Support and Waste Management and Remediation Services: Temporary Help Services (100-249 employees: 1 establishment, 50-99 employees: 1 establishment)
Other Services (except Public Administration): Religious Organizations (50-99: 2, 20-49: 1, 10-19: 2, 5-9: 2, 1-4: 4)
Wholesale Trade: Plastics Materials and Basic Forms and Shapes Merchant Wholesalers (100-249: 1)
Professional, Scientific, and Technical Services: Geophysical Surveying and Mapping Services (100-249: 1)
Accommodation and Food Services: Hotels (except Casino Hotels) and Motels (50-99: 1, 20-49: 1, 10-19: 2, 5-9: 2, 1-4: 3)
Other Services (except Public Administration): Commercial and Industrial Machinery and Equipment (except Automotive and Electronic) Repair and Maintenance (50-99: 1, 20-49: 2, 1-4: 1)
People in group quarters in 2010:
4 people in group homes intended for adults
People in group quarters in 2000:
12 people in homes for the mentally retarded
Fatal accident statistics in 2014:
Fatal accident count: 4
Vehicles involved in fatal accidents: 7
Fatal accidents caused by drunken drivers: 3
Fatalities: 4
Persons involved in fatal accidents: 7
Pedestrians involved in fatal accidents: 0
Fatal accident statistics in 2013:
Fatal accident count: 5
Vehicles involved in fatal accidents: 8
Fatal accidents caused by drunken drivers: 1
Fatalities: 5
Persons involved in fatal accidents: 15
Pedestrians involved in fatal accidents: 0
Home Mortgage Disclosure Act Aggregated Statistics For Year 2009 (Based on 8 full and 2 partial tracts)
A) FHA, FSA/RHS & VA Home Purchase Loans
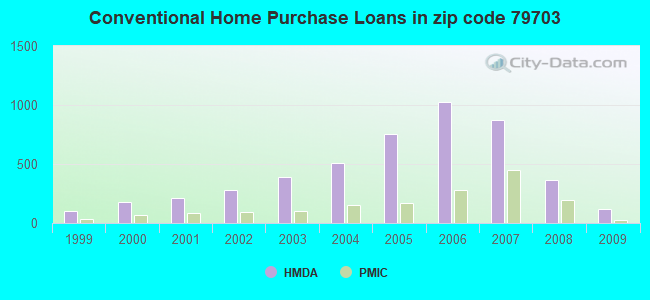
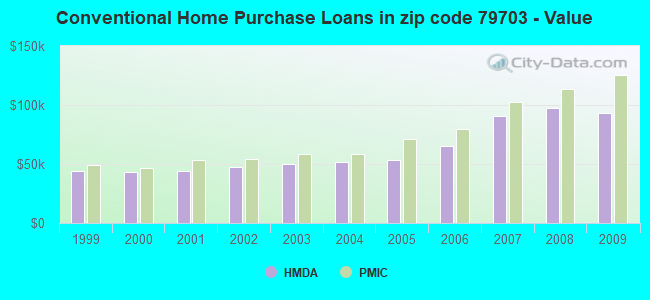
B) Conventional Home Purchase Loans
C) Refinancings
D) Home Improvement Loans
F) Non-occupant Loans on < 5 Family Dwellings (A B C & D)
G) Loans On Manufactured Home Dwelling (A B C & D)
Number
Average Value
Number
Average Value
Number
Average Value
Number
Average Value
Number
Average Value
Number
Average Value
LOANS ORIGINATED
419
$115,101
118
$93,165
394
$89,015
85
$33,783
64
$73,072
2
$21,830
APPLICATIONS APPROVED, NOT ACCEPTED
14
$106,493
2
$65,485
31
$79,197
12
$34,816
4
$35,698
4
$59,532
APPLICATIONS DENIED
32
$98,203
34
$71,138
223
$79,561
103
$39,540
16
$57,434
10
$43,072
APPLICATIONS WITHDRAWN
10
$160,157
16
$123,216
102
$89,182
28
$34,573
8
$125,476
0
$0
FILES CLOSED FOR INCOMPLETENESS
0
$0
4
$34,660
34
$77,002
0
$0
0
$0
0
$0
Aggregated Statistics For Year 2008 (Based on 8 full and 2 partial tracts)
A) FHA, FSA/RHS & VA Home Purchase Loans
B) Conventional Home Purchase Loans
C) Refinancings
D) Home Improvement Loans
F) Non-occupant Loans on < 5 Family Dwellings (A B C & D)
G) Loans On Manufactured Home Dwelling (A B C & D)
Number
Average Value
Number
Average Value
Number
Average Value
Number
Average Value
Number
Average Value
Number
Average Value
LOANS ORIGINATED
447
$119,900
361
$97,774
356
$78,953
108
$35,953
151
$74,549
17
$35,595
APPLICATIONS APPROVED, NOT ACCEPTED
18
$116,982
45
$83,107
38
$68,003
25
$45,317
18
$71,829
14
$52,134
APPLICATIONS DENIED
47
$112,291
111
$80,425
268
$76,433
228
$29,412
32
$63,025
37
$62,008
APPLICATIONS WITHDRAWN
12
$138,418
24
$107,579
112
$81,484
48
$45,530
12
$95,245
0
$0
FILES CLOSED FOR INCOMPLETENESS
6
$109,917
2
$63,610
55
$64,047
12
$43,332
0
$0
0
$0
Aggregated Statistics For Year 2007 (Based on 8 full and 2 partial tracts)
A) FHA, FSA/RHS & VA Home Purchase Loans
B) Conventional Home Purchase Loans
C) Refinancings
D) Home Improvement Loans
E) Loans on Dwellings For 5+ Families
F) Non-occupant Loans on < 5 Family Dwellings (A B C & D)
G) Loans On Manufactured Home Dwelling (A B C & D)
Number
Average Value
Number
Average Value
Number
Average Value
Number
Average Value
Number
Average Value
Number
Average Value
Number
Average Value
LOANS ORIGINATED
171
$106,151
870
$90,854
465
$73,153
157
$32,703
4
$330,612
185
$80,620
26
$42,188
APPLICATIONS APPROVED, NOT ACCEPTED
10
$69,106
112
$76,616
63
$62,540
36
$31,062
0
$0
16
$80,002
24
$57,683
APPLICATIONS DENIED
16
$90,612
209
$81,528
496
$71,963
292
$36,850
3
$4,782,367
59
$60,218
39
$45,990
APPLICATIONS WITHDRAWN
2
$120,115
55
$82,087
314
$70,313
40
$33,806
0
$0
20
$55,430
6
$81,958
FILES CLOSED FOR INCOMPLETENESS
0
$0
24
$100,020
94
$73,019
14
$41,860
0
$0
4
$96,630
0
$0
Aggregated Statistics For Year 2006 (Based on 8 full and 2 partial tracts)
A) FHA, FSA/RHS & VA Home Purchase Loans
B) Conventional Home Purchase Loans
C) Refinancings
D) Home Improvement Loans
E) Loans on Dwellings For 5+ Families
F) Non-occupant Loans on < 5 Family Dwellings (A B C & D)
G) Loans On Manufactured Home Dwelling (A B C & D)
Number
Average Value
Number
Average Value
Number
Average Value
Number
Average Value
Number
Average Value
Number
Average Value
Number
Average Value
LOANS ORIGINATED
168
$92,961
1,024
$65,255
349
$59,990
137
$29,851
4
$1,090,165
215
$54,473
9
$44,177
APPLICATIONS APPROVED, NOT ACCEPTED
8
$99,912
97
$57,424
56
$54,467
17
$22,702
0
$0
8
$51,574
9
$45,110
APPLICATIONS DENIED
14
$85,735
176
$64,230
374
$63,877
257
$26,076
0
$0
45
$52,453
11
$36,567
APPLICATIONS WITHDRAWN
10
$66,322
94
$64,019
261
$64,781
36
$37,124
0
$0
8
$54,476
0
$0
FILES CLOSED FOR INCOMPLETENESS
2
$68,160
18
$66,541
67
$80,222
4
$36,672
0
$0
4
$56,270
0
$0
Aggregated Statistics For Year 2005 (Based on 8 full and 2 partial tracts)
A) FHA, FSA/RHS & VA Home Purchase Loans
B) Conventional Home Purchase Loans
C) Refinancings
D) Home Improvement Loans
F) Non-occupant Loans on < 5 Family Dwellings (A B C & D)
G) Loans On Manufactured Home Dwelling (A B C & D)
Number
Average Value
Number
Average Value
Number
Average Value
Number
Average Value
Number
Average Value
Number
Average Value
LOANS ORIGINATED
190
$71,896
758
$53,053
352
$51,330
92
$55,809
185
$42,713
0
$0
APPLICATIONS APPROVED, NOT ACCEPTED
12
$73,529
80
$55,317
76
$45,614
9
$19,504
12
$66,827
9
$36,658
APPLICATIONS DENIED
18
$69,457
149
$52,119
456
$49,176
182
$23,118
28
$39,943
28
$35,409
APPLICATIONS WITHDRAWN
9
$56,304
75
$64,843
219
$95,782
73
$165,346
10
$62,271
0
$0
FILES CLOSED FOR INCOMPLETENESS
0
$0
26
$70,955
78
$64,774
4
$30,040
4
$65,472
0
$0
Aggregated Statistics For Year 2004 (Based on 8 full and 2 partial tracts)
A) FHA, FSA/RHS & VA Home Purchase Loans
B) Conventional Home Purchase Loans
C) Refinancings
D) Home Improvement Loans
F) Non-occupant Loans on < 5 Family Dwellings (A B C & D)
G) Loans On Manufactured Home Dwelling (A B C & D)
Number
Average Value
Number
Average Value
Number
Average Value
Number
Average Value
Number
Average Value
Number
Average Value
LOANS ORIGINATED
279
$60,354
507
$51,635
526
$47,360
77
$24,686
160
$44,704
5
$42,238
APPLICATIONS APPROVED, NOT ACCEPTED
13
$57,885
63
$45,741
94
$40,857
23
$20,786
11
$49,923
10
$39,866
APPLICATIONS DENIED
20
$58,967
137
$52,067
480
$44,864
157
$23,172
38
$30,046
31
$38,292
APPLICATIONS WITHDRAWN
12
$60,531
61
$50,518
257
$52,069
26
$37,786
15
$44,979
0
$0
FILES CLOSED FOR INCOMPLETENESS
2
$75,405
6
$47,532
58
$59,094
2
$59,495
6
$45,458
0
$0
Aggregated Statistics For Year 2003 (Based on 8 full and 2 partial tracts)
A) FHA, FSA/RHS & VA Home Purchase Loans
B) Conventional Home Purchase Loans
C) Refinancings
D) Home Improvement Loans
F) Non-occupant Loans on < 5 Family Dwellings (A B C & D)
Number
Average Value
Number
Average Value
Number
Average Value
Number
Average Value
Number
Average Value
LOANS ORIGINATED
295
$57,663
387
$50,056
875
$49,198
36
$19,554
174
$55,017
APPLICATIONS APPROVED, NOT ACCEPTED
20
$45,240
34
$46,908
118
$43,066
10
$23,488
6
$52,978
APPLICATIONS DENIED
42
$58,785
108
$46,732
584
$43,172
113
$16,262
43
$36,317
APPLICATIONS WITHDRAWN
12
$56,003
40
$42,508
235
$49,673
10
$7,235
10
$44,344
FILES CLOSED FOR INCOMPLETENESS
1
$61,040
19
$61,445
23
$41,277
2
$30,370
2
$28,775
Aggregated Statistics For Year 2002 (Based on 8 full and 2 partial tracts)
A) FHA, FSA/RHS & VA Home Purchase Loans
B) Conventional Home Purchase Loans
C) Refinancings
D) Home Improvement Loans
E) Loans on Dwellings For 5+ Families
F) Non-occupant Loans on < 5 Family Dwellings (A B C & D)
Number
Average Value
Number
Average Value
Number
Average Value
Number
Average Value
Number
Average Value
Number
Average Value
LOANS ORIGINATED
327
$55,013
276
$47,708
476
$45,322
72
$15,128
2
$2,649,600
100
$39,154
APPLICATIONS APPROVED, NOT ACCEPTED
13
$56,158
35
$47,903
97
$40,278
12
$16,642
0
$0
14
$38,016
APPLICATIONS DENIED
40
$53,822
84
$49,758
277
$35,050
106
$9,818
1
$630,080
10
$21,886
APPLICATIONS WITHDRAWN
8
$56,408
11
$74,025
162
$39,710
12
$11,154
0
$0
4
$25,782
FILES CLOSED FOR INCOMPLETENESS
8
$52,304
12
$51,120
22
$45,497
2
$19,830
0
$0
0
$0
Aggregated Statistics For Year 2001 (Based on 8 full and 2 partial tracts)
A) FHA, FSA/RHS & VA Home Purchase Loans
B) Conventional Home Purchase Loans
C) Refinancings
D) Home Improvement Loans
F) Non-occupant Loans on < 5 Family Dwellings (A B C & D)
Number
Average Value
Number
Average Value
Number
Average Value
Number
Average Value
Number
Average Value
LOANS ORIGINATED
295
$52,788
213
$43,659
299
$42,201
86
$10,625
81
$36,155
APPLICATIONS APPROVED, NOT ACCEPTED
20
$48,501
42
$42,345
89
$39,933
19
$11,748
16
$36,624
APPLICATIONS DENIED
14
$49,001
84
$41,312
225
$35,674
111
$9,071
13
$22,278
APPLICATIONS WITHDRAWN
12
$48,790
23
$44,793
186
$44,116
10
$4,101
14
$46,517
FILES CLOSED FOR INCOMPLETENESS
2
$19,830
12
$43,853
16
$49,674
2
$21,740
0
$0
Aggregated Statistics For Year 2000 (Based on 8 full and 2 partial tracts)
A) FHA, FSA/RHS & VA Home Purchase Loans
B) Conventional Home Purchase Loans
C) Refinancings
D) Home Improvement Loans
F) Non-occupant Loans on < 5 Family Dwellings (A B C & D)
Number
Average Value
Number
Average Value
Number
Average Value
Number
Average Value
Number
Average Value
LOANS ORIGINATED
273
$48,960
182
$43,300
169
$35,173
51
$7,441
45
$36,374
APPLICATIONS APPROVED, NOT ACCEPTED
6
$56,957
57
$43,735
36
$35,888
14
$12,170
3
$22,147
APPLICATIONS DENIED
31
$42,822
152
$40,050
125
$28,645
79
$8,988
22
$27,447
APPLICATIONS WITHDRAWN
4
$62,940
42
$45,678
81
$37,597
4
$4,402
12
$41,446
FILES CLOSED FOR INCOMPLETENESS
4
$43,152
6
$50,442
20
$46,271
0
$0
0
$0
Aggregated Statistics For Year 1999 (Based on 3 full and 2 partial tracts)
A) FHA, FSA/RHS & VA Home Purchase Loans
B) Conventional Home Purchase Loans
C) Refinancings
D) Home Improvement Loans
E) Loans on Dwellings For 5+ Families
F) Non-occupant Loans on < 5 Family Dwellings (A B C & D)
2004 - 2018 National Fire Incident Reporting System (NFIRS) incidents
According to the data from the years 2004 - 2018 the average number of fires per year is 37. The highest number of fires - 98 took place in 2011, and the least - 0 in 2006. The data has an increasing trend.
When looking into fire subcategories, the most reports belonged to: Outside Fires (56.5%), and Structure Fires (27.6%).
Fire incident types reported to NFIRS in Zip Code 79703


 Nearest zip codes: 79701, 79707, 79705, 79765, 79706, 79758.


 According to the data from the years 2004 - 2018 the average number of fires per year is 37. The highest number of fires - 98 took place in 2011, and the least - 0 in 2006. The data has an increasing trend.
 When looking into fire subcategories, the most reports belonged to: Outside Fires (56.5%), and Structure Fires (27.6%).