Estimated zip code population in 2022: 9,890 Zip code population in 2010: 9,066 Zip code population in 2000: 8,835
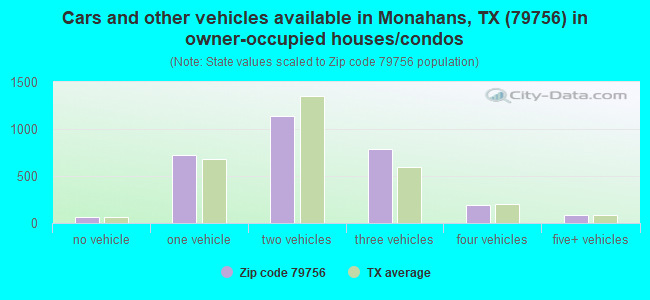
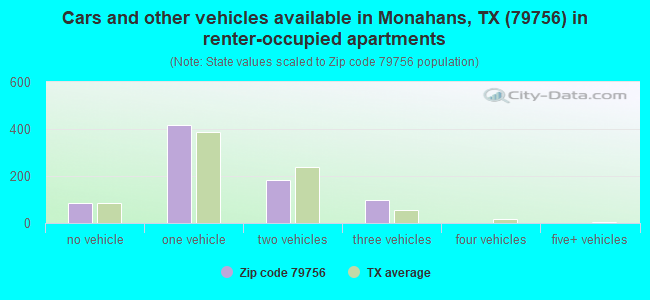
Houses and condos: 4,474 Renter-occupied apartments: 785
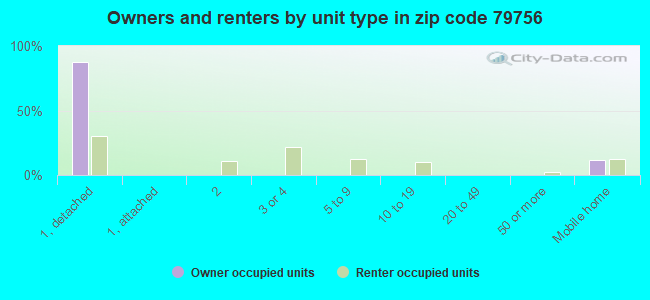
% of renters here:
21%
State:
38%
March 2022 cost of living index in zip code 79756: 78.3 (low, U.S. average is 100)
Land area: 173.3 sq. mi. Water area: 0.0 sq. mi.
Population density: 57 people per square mile
(very low).
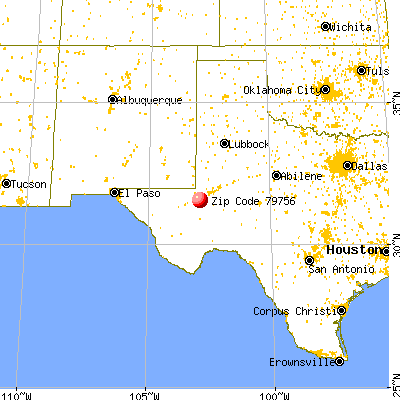
OSM Map
General Map
Google Map
MSN Map
OSM Map
General Map
Google Map
MSN Map
OSM Map
General Map
Google Map
MSN Map
OSM Map
General Map
Google Map
MSN Map
Please wait while loading the map...
Real estate property taxes paid for housing units in 2022:
This zip code:
0.4% ($623)
Texas:
1.5% ($4,050)
Median real estate property taxes paid for housing units with mortgages in 2022: $1,205 (0.6%) Median real estate property taxes paid for housing units with no mortgage in 2022: $408 (0.4%)
Averages for the 2020 tax year for zip code 79756, filed in 2021:
Average Adjusted Gross Income (AGI) in 2020: $67,918 (Individual Income Tax Returns)
Here:
$67,918
State:
$77,054
Salary/wage: $55,624 (reported on 88.2% of returns)
Here:
$55,624
State:
$62,766
(% of AGI for various income ranges: 1176.4% for AGIs below $25k, 3472.8% for AGIs $25k-50k, 6674.6% for AGIs $50k-75k, 9456.0% for AGIs $75k-100k, 17181.8% for AGIs $100k-200k, 62160.0% for AGIs over 200k)
Taxable interest for individuals: $1,055 (reported on 19.5% of returns)
This zip code:
$1,055
Texas:
$2,665
(% of AGI for various income ranges: 4.3% for AGIs below $25k, 9.2% for AGIs $25k-50k, 14.6% for AGIs $50k-75k, 24.9% for AGIs $75k-100k, 37.3% for AGIs $100k-200k, 1105.0% for AGIs over 200k)
Ordinary dividends: $4,990 (reported on 9.5% of returns)
Here:
$4,990
State:
$10,044
(% of AGI for various income ranges: 11.9% for AGIs below $25k, 15.8% for AGIs $25k-50k, 45.9% for AGIs $50k-75k, 117.1% for AGIs $75k-100k, 90.7% for AGIs $100k-200k, 1890.0% for AGIs over 200k)
Net capital gain/loss in AGI: +$15,462 (reported on 8.9% of returns)
Here:
+$15,462
State:
+$39,590
(% of AGI for various income ranges: 0.9% for AGIs below $25k, 23.5% for AGIs $25k-50k, 29.8% for AGIs $50k-75k, 107.4% for AGIs $75k-100k, 242.7% for AGIs $100k-200k, 10475.0% for AGIs over 200k)
Profit/loss from business: +$8,153 (reported on 15.5% of returns)
Here:
+$8,153
State:
+$10,888
(% of AGI for various income ranges: 74.2% for AGIs below $25k, 6.7% for AGIs $25k-50k, 52.7% for AGIs $50k-75k, 84.0% for AGIs $75k-100k, 316.6% for AGIs $100k-200k, 6765.0% for AGIs over 200k)
Taxable individual retirement arrangement distribution: $18,027 (reported on 5.0% of returns)
79756:
$18,027
Texas:
$24,740
(% of AGI for various income ranges: 28.7% for AGIs below $25k, 55.8% for AGIs $25k-50k, 109.5% for AGIs $50k-75k, 163.4% for AGIs $75k-100k, 444.3% for AGIs $100k-200k)
Total itemized deductions: $37,645 (reported on 2.5% of returns)
Here:
$37,645
State:
$40,428
(% of AGI for various income ranges: 57.3% for AGIs below $25k, 175.2% for AGIs $50k-75k, 272.5% for AGIs $100k-200k, 3370.0% for AGIs over 200k)
Charity contributions: $16,400 (reported on 2.0% of returns)
Here:
$16,400
State:
$18,201
(% of AGI for various income ranges: 50.5% for AGIs $50k-75k, 107.3% for AGIs $100k-200k, 1802.5% for AGIs over 200k)
Taxes paid: $6,482 (reported on 2.5% of returns)
79756:
$6,482
State:
$7,821
(% of AGI for various income ranges: 47.5% for AGIs $50k-75k, 43.0% for AGIs $100k-200k, 645.0% for AGIs over 200k)
Earned income credit: $2,623 (reported on 19.8% of returns)
Here:
$2,623
State:
$2,584
(% of AGI for various income ranges: 142.3% for AGIs below $25k, 81.6% for AGIs $25k-50k)
Percentage of individuals using paid preparers for their 2020 taxes: 91.6%
Here:
92%
State:
92%
(% for various income ranges: 89.6% for AGIs below $25k, 91.7% for AGIs $25k-50k, 91.7% for AGIs $50k-75k, 93.3% for AGIs $75k-100k, 92.3% for AGIs $100k-200k, 100.0% for AGIs over 200k)
Averages for the 2012 tax year for zip code 79756, filed in 2013:
Average Adjusted Gross Income (AGI) in 2012: $66,464 (Individual Income Tax Returns)
Here:
$66,464
State:
$65,384
Salary/wage: $52,488 (reported on 89.3% of returns)
Here:
$52,488
State:
$52,524
(% of AGI for various income ranges: 81.1% for AGIs below $25k, 86.2% for AGIs $25k-50k, 89.6% for AGIs $50k-75k, 87.4% for AGIs $75k-100k, 82.6% for AGIs $100k-200k, 33.8% for AGIs over 200k)
Taxable interest for individuals: $1,406 (reported on 20.1% of returns)
This zip code:
$1,406
Texas:
$2,372
(% of AGI for various income ranges: 0.6% for AGIs below $25k, 0.5% for AGIs $25k-50k, 0.2% for AGIs $50k-75k, 0.3% for AGIs $75k-100k, 0.5% for AGIs $100k-200k, 0.4% for AGIs over 200k)
Ordinary dividends: $8,355 (reported on 9.5% of returns)
Here:
$8,355
State:
$9,721
(% of AGI for various income ranges: 1.2% for AGIs below $25k, 0.5% for AGIs $25k-50k, 0.4% for AGIs $50k-75k, 0.4% for AGIs $75k-100k, 0.8% for AGIs $100k-200k, 2.6% for AGIs over 200k)
Net capital gain/loss in AGI: +$12,907 (reported on 7.1% of returns)
Here:
+$12,907
State:
+$35,319
(% of AGI for various income ranges: 0.2% for AGIs $75k-100k, 1.2% for AGIs $100k-200k, 3.7% for AGIs over 200k)
Profit/loss from business: +$17,738 (reported on 13.7% of returns)
Here:
+$17,738
State:
+$13,732
(% of AGI for various income ranges: 6.6% for AGIs below $25k, 2.0% for AGIs $25k-50k, 1.1% for AGIs $50k-75k, 2.0% for AGIs $75k-100k, 2.5% for AGIs $100k-200k, 6.8% for AGIs over 200k)
Taxable individual retirement arrangement distribution: $13,223 (reported on 7.3% of returns)
79756:
$13,223
Texas:
$19,511
(% of AGI for various income ranges: 1.9% for AGIs below $25k, 1.7% for AGIs $25k-50k, 1.5% for AGIs $50k-75k, 1.7% for AGIs $75k-100k, 2.8% for AGIs $100k-200k)
Total itemized deductions: $27,583 (16% of AGI, reported on 11.4% of returns)
Here:
$27,583
State:
$24,724
Here:
15.6% of AGI
State:
15.9% of AGI
(% of AGI for various income ranges: 2.5% for AGIs below $25k, 4.1% for AGIs $25k-50k, 3.5% for AGIs $50k-75k, 4.3% for AGIs $75k-100k, 6.3% for AGIs $100k-200k, 5.1% for AGIs over 200k)
Charity contributions: $9,084 (reported on 7.3% of returns)
Here:
$9,084
State:
$6,808
(% of AGI for various income ranges: 0.8% for AGIs $25k-50k, 0.7% for AGIs $50k-75k, 0.5% for AGIs $75k-100k, 1.2% for AGIs $100k-200k, 1.6% for AGIs over 200k)
Taxes paid: $3,739 (reported on 10.9% of returns)
79756:
$3,739
State:
$6,921
(% of AGI for various income ranges: 0.2% for AGIs below $25k, 0.4% for AGIs $25k-50k, 0.4% for AGIs $50k-75k, 0.5% for AGIs $75k-100k, 0.9% for AGIs $100k-200k, 0.7% for AGIs over 200k)
Earned income credit: $2,478 (reported on 19.7% of returns)
Here:
$2,478
State:
$2,570
(% of AGI for various income ranges: 9.0% for AGIs below $25k, 1.2% for AGIs $25k-50k)
Percentage of individuals using paid preparers for their 2012 taxes: 63.0%
Here:
63%
State:
51%
(% for various income ranges: 57.9% for AGIs below $25k, 59.6% for AGIs $25k-50k, 66.7% for AGIs $50k-75k, 68.1% for AGIs $75k-100k, 68.6% for AGIs $100k-200k, 85.7% for AGIs over 200k)
Averages for the 2004 tax year for zip code 79756, filed in 2005:
Average Adjusted Gross Income (AGI) in 2004: $35,730 (Individual Income Tax Returns)
Here:
$35,730
State:
$47,881
Salary/wage: $31,176 (reported on 85.9% of returns)
Here:
$31,176
State:
$41,947
(% of AGI for various income ranges: 95.0% for AGIs below $10k, 80.2% for AGIs $10k-25k, 84.2% for AGIs $25k-50k, 81.9% for AGIs $50k-75k, 83.7% for AGIs $75k-100k, 44.5% for AGIs over 100k)
Taxable interest for individuals: $1,964 (reported on 29.1% of returns)
This zip code:
$1,964
Texas:
$2,255
(% of AGI for various income ranges: 3.1% for AGIs below $10k, 1.7% for AGIs $10k-25k, 1.2% for AGIs $25k-50k, 1.4% for AGIs $50k-75k, 1.4% for AGIs $75k-100k, 2.1% for AGIs over 100k)
Taxable dividends: $2,298 (reported on 15.0% of returns)
Here:
$2,298
State:
$4,261
(% of AGI for various income ranges: 2.4% for AGIs below $10k, 0.7% for AGIs $10k-25k, 0.7% for AGIs $25k-50k, 0.9% for AGIs $50k-75k, 1.0% for AGIs $75k-100k, 1.4% for AGIs over 100k)
Net capital gain/loss: +$7,872 (reported on 11.3% of returns)
Here:
+$7,872
State:
+$16,110
(% of AGI for various income ranges: -1.3% for AGIs below $10k, -0.3% for AGIs $10k-25k, 0.3% for AGIs $25k-50k, 0.6% for AGIs $50k-75k, 0.3% for AGIs $75k-100k, 10.7% for AGIs over 100k)
Profit/loss from business: +$8,188 (reported on 15.7% of returns)
Here:
+$8,188
State:
+$11,013
(% of AGI for various income ranges: 2.0% for AGIs below $10k, 3.6% for AGIs $10k-25k, 1.8% for AGIs $25k-50k, 2.4% for AGIs $50k-75k, 1.8% for AGIs $75k-100k, 8.5% for AGIs over 100k)
IRA payment deduction: $3,286 (reported on 1.6% of returns)
79756:
$3,286
Texas:
$3,120
(% of AGI for various income ranges: 0.2% for AGIs $10k-25k, 0.1% for AGIs $25k-50k, 0.2% for AGIs $50k-75k, 0.4% for AGIs $75k-100k)
Total itemized deductions: $16,177 (20% of AGI, reported on 9.7% of returns)
Here:
$16,177
State:
$19,631
Here:
20.0% of AGI
State:
18.9% of AGI
(% of AGI for various income ranges: 3.8% for AGIs below $10k, 2.1% for AGIs $10k-25k, 4.4% for AGIs $25k-50k, 4.8% for AGIs $50k-75k, 6.5% for AGIs $75k-100k, 4.0% for AGIs over 100k)
Charity contributions deductions: $5,427 (6% of AGI, reported on 7.2% of returns)
Here:
$5,427
State:
$4,753
Here:
6.0% of AGI
State:
4.2% of AGI
(% of AGI for various income ranges: 0.5% for AGIs $10k-25k, 0.6% for AGIs $25k-50k, 1.0% for AGIs $50k-75k, 1.8% for AGIs $75k-100k, 1.7% for AGIs over 100k)
Total tax: $5,406 (reported on 65.3% of returns)
79756:
$5,406
State:
$9,058
(% of AGI for various income ranges: 2.4% for AGIs below $10k, 3.2% for AGIs $10k-25k, 5.6% for AGIs $25k-50k, 8.4% for AGIs $50k-75k, 11.2% for AGIs $75k-100k, 20.8% for AGIs over 100k)
Earned income credit: $1,909 (reported on 26.7% of returns)
Here:
$1,909
State:
$2,024
Percentage of individuals using paid preparers for their 2004 taxes: 71.8%
Here:
72%
State:
57%
(% for various income ranges: 66.9% for AGIs below $10k, 74.3% for AGIs $10k-25k, 76.1% for AGIs $25k-50k, 70.0% for AGIs $50k-75k, 60.9% for AGIs $75k-100k, 78.2% for AGIs over 100k)
Likely homosexual households (counted as self-reported same-sex unmarried-partner households)
Lesbian couples: 1.1% of all households
Gay men: 0.0% of all households
Household received Food Stamps/SNAP in the past 12 months: 353 Household did not receive Food Stamps/SNAP in the past 12 months: 3,407
Women who had a birth in the past 12 months: 133 (126 now married, 8 unmarried) Women who did not have a birth in the past 12 months: 2,065 (1,062 now married, 998 unmarried)
Housing units in zip code 79756 with a mortgage: 920 (6 second mortgage, 7 both second mortgage and home equity loan) Median monthly owner costs for units with a mortgage: $1,368 Median monthly owner costs for units without a mortgage: $482
Residents with income below the poverty level in 2022:
This zip code:
14.1%
Whole state:
14.0%
Residents with income below 50% of the poverty level in 2022:
This zip code:
6.8%
Whole state:
7.4%
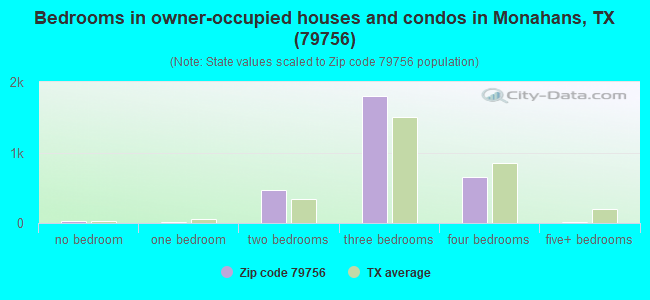
Median number of rooms in houses and condos:
Here:
6.0
State:
6.3
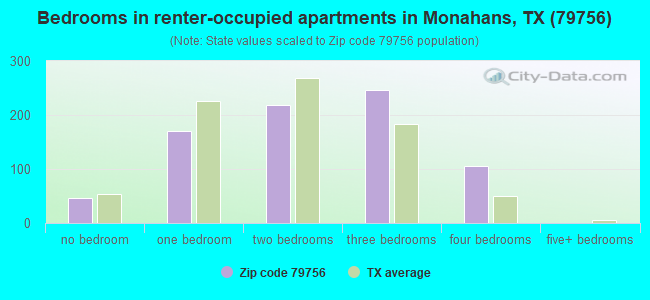
Median number of rooms in apartments:
Here:
4.2
State:
4.0
Notable locations in this zip code not listed on our city pages
In group quarters: 108 (-1 institutionalized population)
Size of family households: 1,069 2-persons, 556 3-persons, 553 4-persons, 387 5-persons, 72 6-persons, 120 7-or-more-persons
Size of nonfamily households: 890 1-person, 94 2-persons, 8 4-persons
1,684 married couples with children.
508 single-parent households (85 men, 423 women).
65.8% of residents of 79756 zip code speak English at home.
33.5% of residents speak Spanish at home (73% very well, 15% well, 9% not well, 3% not at all).
0.7% of residents speak Asian or Pacific Island language at home (29% very well, 24% well, 21% not well, 26% not at all).
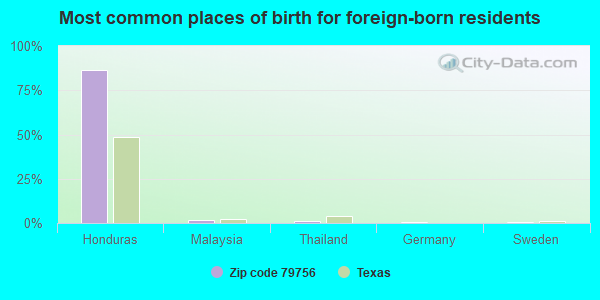
Foreign born population: 734 (7.4%) (54.4% of them are naturalized citizens)
This zip code:
7.4%
Whole state:
17.2%
86%Honduras
2%Malaysia
1%Thailand
1%Germany
0%Sweden
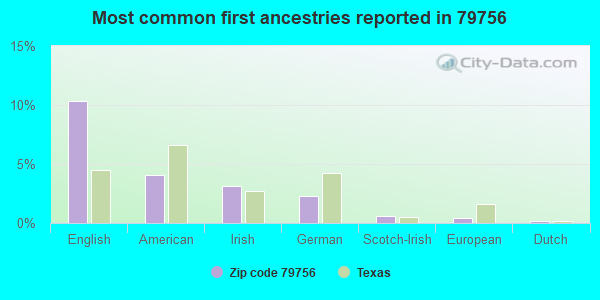
10%English
4%American
3%Irish
2%German
1%Scotch-Irish
0%European
0%Dutch
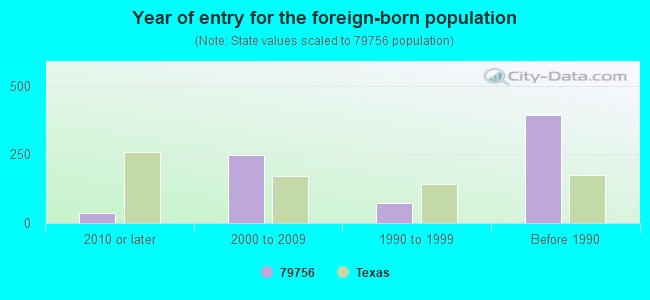
Year of entry for the foreign-born population
352010 or later
2462000 to 2009
721990 to 1999
393Before 1990
Facilities with environmental interests located in this zip code:
ASHLAND INC (4700 S LOOP ROAD 464 in MONAHANS, TX)
Conditionally Exempt Small Quantity Generators, less than 100 kg/month of hazardous waste (Resource Conservation and Recovery Act (tracking hazardous waste)) - notification TRANSPORTER (Resource Conservation and Recovery Act (tracking hazardous waste)) Alternative names: SCURLOCK PERMIAN CORP
3-B RATTLESNAKE REFINING CORP (0.5 M W INTX FM 1219 ON US 80 in MONAHANS, TX)
AIR MINOR (AIRS/AFS) Business SIC classification: PETROLEUM REFINING
AMERICAN GATHERING L.P. (NORTH EVA STREET in MONAHANS, TX)
AIR MINOR (AIRS/AFS) Business SIC classification: CRUDE PETROLEUM AND NATURAL GAS; NATURAL GAS TRANSMISSION
AMERICAN GATHERING L.P. (APPROXIMATELY 1.5 MILES NORTH in MONAHANS, TX)
CRITERIA AND HAZARDOUS AIR POLLUTANT INVENTORY (Inventory of air pollution sources) Business SIC classification: NATURAL GAS TRANSMISSION Business NAICS classification: PIPELINE TRANSPORTATION OF NATURAL GAS.
Housing units lacking complete plumbing facilities: 5.8% Housing units lacking complete kitchen facilities: 3.7%
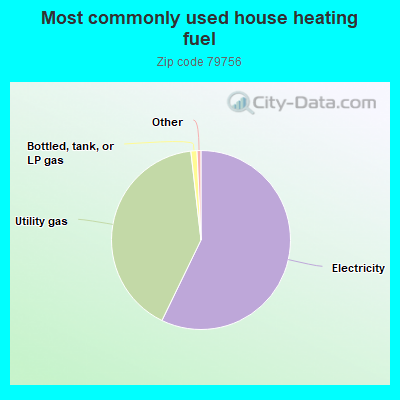
57.2%Electricity
41.0%Utility gas
1.1%Bottled, tank, or LP gas
Population in 1990: 11,296.
Place of birth for U.S.-born residents:
This state: 7,690
Northeast: 52
Midwest: 172
South: 377
West: 743
61% of the 79756 zip code residents lived in the same house 5 years ago. Out of people who lived in different houses, 58% lived in this county. Out of people who lived in different counties, 50% lived in Texas.
93% of the 79756 zip code residents lived in the same house 1 year ago. Out of people who lived in different houses, 16% moved from this county. Out of people who lived in different houses, 55% moved from different county within same state. Out of people who lived in different houses, 37% moved from different state.
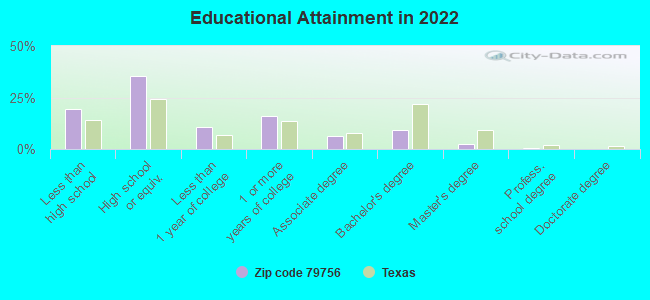
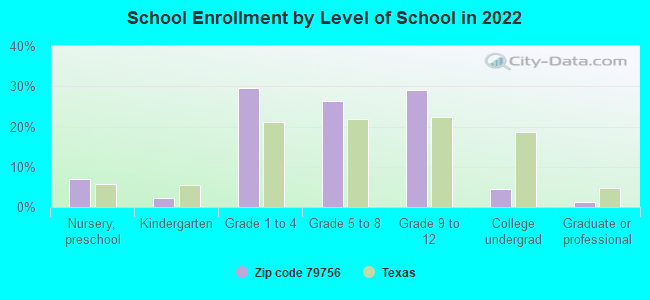
Private vs. public school enrollment:
Students in private schools in grades 1 to 8 (elementary and middle school): 61
Here:
4.7%
Texas:
8.8%
Students in private schools in grades 9 to 12 (high school): 17
Here:
2.5%
Texas:
8.0%
Students in private undergraduate colleges:
Here:
0.0%
Texas:
16.2%
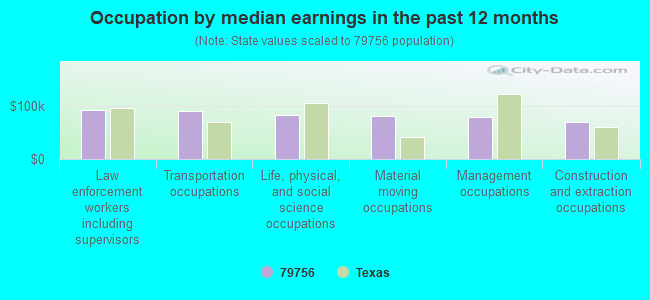
Occupation by median earnings in the past 12 months ($)
92,198Law enforcement workers including supervisors
91,002Transportation occupations
84,067Life, physical, and social science occupations
81,067Material moving occupations
80,423Management occupations
70,493Construction and extraction occupations
Companies with federal contracts located in this zip code:
BEST MADE DESIGNS, LLC (1601 W 15TH STREET in MONAHANS, TX; small business) 100 employees, $0 revenue. : $4,167,661 in 25 contractsfrom 2002 to 2006
Contracts for Individual Equipment, Miscellaneous Weapons, Armor, Personal, Medical and Surgical Instruments, Equipment, and Supplies, and moreby Army, U.S. Customs Service Signed by year:2000: $0; 2001: $0; 2002: $7,425; 2003: $256,027; 2004: $834,177; 2005: $1,636,134; 2006: $1,433,898.
Biggest contracts:
$1,453,266 with Army for Individual Equipment. Signed on 2005-02-10. Completion date: 2005-05-23.
$1,423,638 with Army for Miscellaneous Weapons. Signed on 2006-06-22. Completion date: 2007-05-31.
$745,244 with Army for Individual Equipment. Signed on 2004-09-21. Completion date: 2004-09-30.
$73,330 with Army for Armor, Personal. Signed on 2003-02-19. Completion date: 2003-02-21.
Top industries in this zip code by the number of employees in 2005:
Mining: Support Activities for Oil and Gas Operations (50-99 employees: 2 establishments, 20-49 employees: 2 establishments, 10-19 employees: 2 establishments, 5-9 employees: 5 establishments, 1-4 employees: 7 establishments)
Health Care and Social Assistance: General Medical and Surgical Hospitals (100-249: 1)
Wholesale Trade: Sporting and Recreational Goods and Supplies Merchant Wholesalers (100-249: 1)
Health Care and Social Assistance: Nursing Care Facilities (50-99: 1)
People in group quarters in 2010:
54 people in local jails and other municipal confinement facilities
54 people in nursing facilities/skilled-nursing facilities
People in group quarters in 2000:
72 people in local jails and other confinement facilities (including police lockups)
54 people in nursing homes
6 people in homes for the mentally retarded
5 people in agriculture workers' dormitories on farms
2003 - 2016 National Fire Incident Reporting System (NFIRS) incidents
According to the data from the years 2003 - 2016 the average number of fires per year is 46. The highest number of fire incidents - 82 took place in 2008, and the least - 10 in 2003. The data has a growing trend.
When looking into fire subcategories, the most reports belonged to: Outside Fires (67.7%), and Mobile Property/Vehicle Fires (17.7%).
Fire incident types reported to NFIRS in Zip Code 79756


 Nearest zip codes: 79788, 79742, 79777, 79789, 79759, 79745.


 According to the data from the years 2003 - 2016 the average number of fires per year is 46. The highest number of fire incidents - 82 took place in 2008, and the least - 10 in 2003. The data has a growing trend.
 When looking into fire subcategories, the most reports belonged to: Outside Fires (67.7%), and Mobile Property/Vehicle Fires (17.7%).