Estimated zip code population in 2022: 32,368 Zip code population in 2010: 30,488 Zip code population in 2000: 28,592
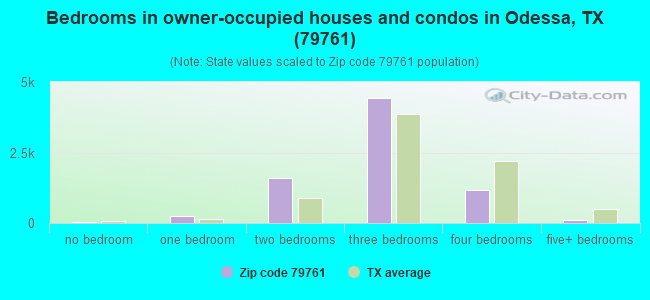
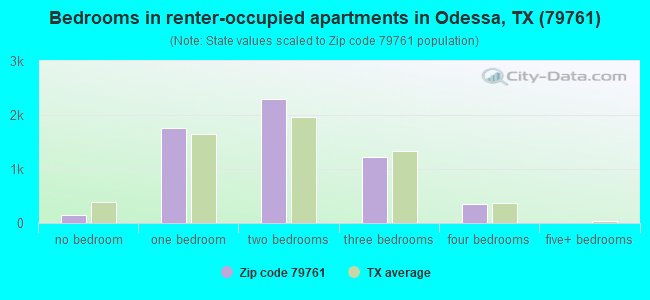
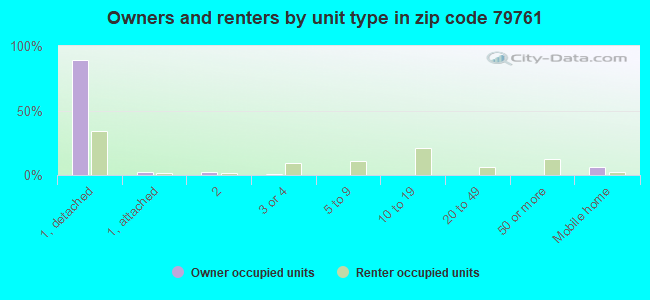
Houses and condos: 14,465 Renter-occupied apartments: 5,822
% of renters here:
43%
State:
38%
March 2022 cost of living index in zip code 79761: 81.7 (low, U.S. average is 100)
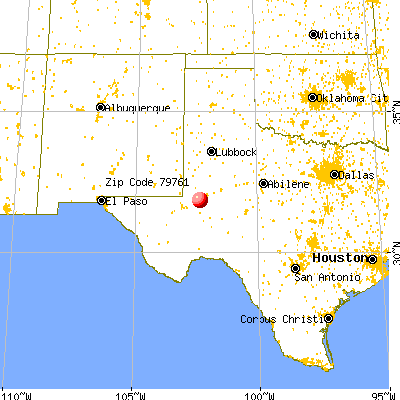
Land area: 10.2 sq. mi. Water area: 0.0 sq. mi.
Population density: 3,177 people per square mile
(average).
OSM Map
General Map
Google Map
MSN Map
OSM Map
General Map
Google Map
MSN Map
OSM Map
General Map
Google Map
MSN Map
OSM Map
General Map
Google Map
MSN Map
Please wait while loading the map...
Real estate property taxes paid for housing units in 2022:
This zip code:
1.2% ($1,928)
Texas:
1.5% ($4,050)
Median real estate property taxes paid for housing units with mortgages in 2022: $2,580 (1.3%) Median real estate property taxes paid for housing units with no mortgage in 2022: $1,414 (1.1%)
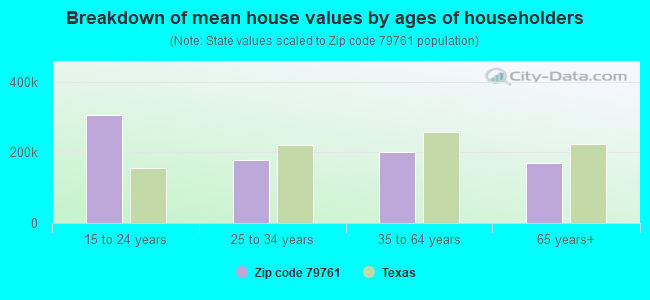
Estimated median house/condo value in 2022: $161,884
79761:
$161,884
Texas:
$275,400
According to our research of Texas and other state lists, there were 78 registered sex offenders living in 79761 zip code as of April 27, 2024. The ratio of all residents to sex offenders in zip code 79761 is 445 to 1. The ratio of registered sex offenders to all residents in this zip code is near the state average.
Median resident age:
This zip code:
29.8 years
Texas median age:
35.6 years
Average household size:
This zip code:
2.4 people
Texas:
2.6 people
Averages for the 2020 tax year for zip code 79761, filed in 2021:
Average Adjusted Gross Income (AGI) in 2020: $52,355 (Individual Income Tax Returns)
Here:
$52,355
State:
$77,054
Salary/wage: $46,477 (reported on 87.3% of returns)
Here:
$46,477
State:
$62,766
(% of AGI for various income ranges: 1166.1% for AGIs below $25k, 3465.7% for AGIs $25k-50k, 6326.1% for AGIs $50k-75k, 9419.9% for AGIs $75k-100k, 16101.2% for AGIs $100k-200k, 54695.0% for AGIs over 200k)
Taxable interest for individuals: $1,255 (reported on 15.0% of returns)
This zip code:
$1,255
Texas:
$2,665
(% of AGI for various income ranges: 5.3% for AGIs below $25k, 7.0% for AGIs $25k-50k, 11.2% for AGIs $50k-75k, 23.8% for AGIs $75k-100k, 42.5% for AGIs $100k-200k, 1580.0% for AGIs over 200k)
Ordinary dividends: $5,504 (reported on 6.5% of returns)
Here:
$5,504
State:
$10,044
(% of AGI for various income ranges: 8.0% for AGIs below $25k, 11.9% for AGIs $25k-50k, 30.2% for AGIs $50k-75k, 38.8% for AGIs $75k-100k, 150.3% for AGIs $100k-200k, 2287.5% for AGIs over 200k)
Net capital gain/loss in AGI: +$10,016 (reported on 6.2% of returns)
Here:
+$10,016
State:
+$39,590
(% of AGI for various income ranges: 4.1% for AGIs below $25k, 11.5% for AGIs $25k-50k, 22.7% for AGIs $50k-75k, 52.9% for AGIs $75k-100k, 222.7% for AGIs $100k-200k, 5973.8% for AGIs over 200k)
Profit/loss from business: +$7,414 (reported on 17.9% of returns)
Here:
+$7,414
State:
+$10,888
(% of AGI for various income ranges: 140.6% for AGIs below $25k, 89.5% for AGIs $25k-50k, 111.4% for AGIs $50k-75k, 124.5% for AGIs $75k-100k, 300.2% for AGIs $100k-200k, 4665.0% for AGIs over 200k)
Taxable individual retirement arrangement distribution: $19,460 (reported on 4.4% of returns)
79761:
$19,460
Texas:
$24,740
(% of AGI for various income ranges: 23.6% for AGIs below $25k, 35.4% for AGIs $25k-50k, 87.3% for AGIs $50k-75k, 152.5% for AGIs $75k-100k, 453.7% for AGIs $100k-200k, 3090.0% for AGIs over 200k)
Total itemized deductions: $35,824 (reported on 3.2% of returns)
Here:
$35,824
State:
$40,428
(% of AGI for various income ranges: 68.9% for AGIs $25k-50k, 173.3% for AGIs $50k-75k, 236.9% for AGIs $75k-100k, 507.3% for AGIs $100k-200k, 4172.5% for AGIs over 200k)
Charity contributions: $13,912 (reported on 2.5% of returns)
Here:
$13,912
State:
$18,201
(% of AGI for various income ranges: 9.7% for AGIs $25k-50k, 24.2% for AGIs $50k-75k, 56.9% for AGIs $75k-100k, 183.0% for AGIs $100k-200k, 2195.0% for AGIs over 200k)
Taxes paid: $6,380 (reported on 3.1% of returns)
79761:
$6,380
State:
$7,821
(% of AGI for various income ranges: 10.1% for AGIs $25k-50k, 27.7% for AGIs $50k-75k, 48.2% for AGIs $75k-100k, 101.0% for AGIs $100k-200k, 635.0% for AGIs over 200k)
Earned income credit: $2,492 (reported on 24.5% of returns)
Here:
$2,492
State:
$2,584
(% of AGI for various income ranges: 140.5% for AGIs below $25k, 88.2% for AGIs $25k-50k, 1.5% for AGIs $50k-75k)
Percentage of individuals using paid preparers for their 2020 taxes: 91.4%
Here:
91%
State:
92%
(% for various income ranges: 90.1% for AGIs below $25k, 93.2% for AGIs $25k-50k, 91.8% for AGIs $50k-75k, 91.3% for AGIs $75k-100k, 90.2% for AGIs $100k-200k, 90.9% for AGIs over 200k)
Averages for the 2012 tax year for zip code 79761, filed in 2013:
Average Adjusted Gross Income (AGI) in 2012: $52,236 (Individual Income Tax Returns)
Here:
$52,236
State:
$65,384
Salary/wage: $44,622 (reported on 89.6% of returns)
Here:
$44,622
State:
$52,524
(% of AGI for various income ranges: 83.8% for AGIs below $25k, 88.8% for AGIs $25k-50k, 87.2% for AGIs $50k-75k, 87.4% for AGIs $75k-100k, 83.0% for AGIs $100k-200k, 36.8% for AGIs over 200k)
Taxable interest for individuals: $1,579 (reported on 16.0% of returns)
This zip code:
$1,579
Texas:
$2,372
(% of AGI for various income ranges: 0.4% for AGIs below $25k, 0.2% for AGIs $25k-50k, 0.4% for AGIs $50k-75k, 0.3% for AGIs $75k-100k, 0.4% for AGIs $100k-200k, 1.0% for AGIs over 200k)
Ordinary dividends: $7,518 (reported on 7.5% of returns)
Here:
$7,518
State:
$9,721
(% of AGI for various income ranges: 1.1% for AGIs below $25k, 0.4% for AGIs $25k-50k, 0.6% for AGIs $50k-75k, 0.5% for AGIs $75k-100k, 0.6% for AGIs $100k-200k, 3.0% for AGIs over 200k)
Net capital gain/loss in AGI: +$14,670 (reported on 5.3% of returns)
Here:
+$14,670
State:
+$35,319
(% of AGI for various income ranges: 0.1% for AGIs $25k-50k, 0.2% for AGIs $50k-75k, 0.2% for AGIs $75k-100k, 0.6% for AGIs $100k-200k, 6.6% for AGIs over 200k)
Profit/loss from business: +$15,591 (reported on 14.5% of returns)
Here:
+$15,591
State:
+$13,732
(% of AGI for various income ranges: 8.3% for AGIs below $25k, 3.6% for AGIs $25k-50k, 2.4% for AGIs $50k-75k, 1.9% for AGIs $75k-100k, 3.9% for AGIs $100k-200k, 6.9% for AGIs over 200k)
Taxable individual retirement arrangement distribution: $14,809 (reported on 5.7% of returns)
79761:
$14,809
Texas:
$19,511
(% of AGI for various income ranges: 1.3% for AGIs below $25k, 1.1% for AGIs $25k-50k, 1.6% for AGIs $50k-75k, 1.4% for AGIs $75k-100k, 1.8% for AGIs $100k-200k, 2.2% for AGIs over 200k)
Self-employment retirement plans: $20,100 (reported on 0.3% of returns)
79761:
$20,100
Texas:
$23,938
Total itemized deductions: $21,814 (17% of AGI, reported on 13.5% of returns)
Here:
$21,814
State:
$24,724
Here:
16.9% of AGI
State:
15.9% of AGI
(% of AGI for various income ranges: 3.3% for AGIs below $25k, 4.3% for AGIs $25k-50k, 5.5% for AGIs $50k-75k, 6.4% for AGIs $75k-100k, 7.7% for AGIs $100k-200k, 5.4% for AGIs over 200k)
Charity contributions: $7,208 (reported on 9.0% of returns)
Here:
$7,208
State:
$6,808
(% of AGI for various income ranges: 0.4% for AGIs below $25k, 0.6% for AGIs $25k-50k, 0.8% for AGIs $50k-75k, 1.0% for AGIs $75k-100k, 1.7% for AGIs $100k-200k, 2.3% for AGIs over 200k)
Taxes paid: $4,070 (reported on 12.8% of returns)
79761:
$4,070
State:
$6,921
(% of AGI for various income ranges: 0.6% for AGIs below $25k, 0.6% for AGIs $25k-50k, 0.8% for AGIs $50k-75k, 1.1% for AGIs $75k-100k, 1.5% for AGIs $100k-200k, 1.1% for AGIs over 200k)
Earned income credit: $2,514 (reported on 26.4% of returns)
Here:
$2,514
State:
$2,570
(% of AGI for various income ranges: 10.1% for AGIs below $25k, 1.5% for AGIs $25k-50k)
Percentage of individuals using paid preparers for their 2012 taxes: 61.1%
Here:
61%
State:
51%
(% for various income ranges: 59.3% for AGIs below $25k, 59.4% for AGIs $25k-50k, 62.6% for AGIs $50k-75k, 62.5% for AGIs $75k-100k, 64.9% for AGIs $100k-200k, 88.5% for AGIs over 200k)
Averages for the 2004 tax year for zip code 79761, filed in 2005:
Average Adjusted Gross Income (AGI) in 2004: $33,234 (Individual Income Tax Returns)
Here:
$33,234
State:
$47,881
Salary/wage: $28,998 (reported on 87.3% of returns)
Here:
$28,998
State:
$41,947
(% of AGI for various income ranges: 96.8% for AGIs below $10k, 84.7% for AGIs $10k-25k, 85.6% for AGIs $25k-50k, 78.6% for AGIs $50k-75k, 76.6% for AGIs $75k-100k, 55.1% for AGIs over 100k)
Taxable interest for individuals: $2,445 (reported on 24.9% of returns)
This zip code:
$2,445
Texas:
$2,255
(% of AGI for various income ranges: 2.9% for AGIs below $10k, 1.4% for AGIs $10k-25k, 1.4% for AGIs $25k-50k, 1.7% for AGIs $50k-75k, 1.6% for AGIs $75k-100k, 2.7% for AGIs over 100k)
Taxable dividends: $3,281 (reported on 12.1% of returns)
Here:
$3,281
State:
$4,261
(% of AGI for various income ranges: 2.1% for AGIs below $10k, 0.8% for AGIs $10k-25k, 0.6% for AGIs $25k-50k, 1.0% for AGIs $50k-75k, 0.7% for AGIs $75k-100k, 2.4% for AGIs over 100k)
Net capital gain/loss: +$8,340 (reported on 10.3% of returns)
Here:
+$8,340
State:
+$16,110
(% of AGI for various income ranges: -0.5% for AGIs below $10k, -0.0% for AGIs $10k-25k, 0.3% for AGIs $25k-50k, 0.4% for AGIs $50k-75k, 1.3% for AGIs $75k-100k, 9.4% for AGIs over 100k)
Profit/loss from business: +$9,861 (reported on 14.0% of returns)
Here:
+$9,861
State:
+$11,013
(% of AGI for various income ranges: 6.1% for AGIs below $10k, 4.8% for AGIs $10k-25k, 2.1% for AGIs $25k-50k, 2.2% for AGIs $50k-75k, 3.9% for AGIs $75k-100k, 7.3% for AGIs over 100k)
IRA payment deduction: $3,253 (reported on 1.4% of returns)
79761:
$3,253
Texas:
$3,120
(% of AGI for various income ranges: 0.1% for AGIs $10k-25k, 0.1% for AGIs $25k-50k, 0.2% for AGIs $50k-75k, 0.1% for AGIs $75k-100k, 0.2% for AGIs over 100k)
Self-employed pension: $21,633 (reported on 0.3% of returns)
Here:
$21,633
Texas:
$16,401
Total itemized deductions: $16,716 (21% of AGI, reported on 12.3% of returns)
Here:
$16,716
State:
$19,631
Here:
21.4% of AGI
State:
18.9% of AGI
(% of AGI for various income ranges: 5.7% for AGIs below $10k, 2.8% for AGIs $10k-25k, 5.5% for AGIs $25k-50k, 7.5% for AGIs $50k-75k, 8.7% for AGIs $75k-100k, 7.0% for AGIs over 100k)
Charity contributions deductions: $5,417 (6% of AGI, reported on 9.6% of returns)
Here:
$5,417
State:
$4,753
Here:
6.4% of AGI
State:
4.2% of AGI
(% of AGI for various income ranges: 0.4% for AGIs below $10k, 0.6% for AGIs $10k-25k, 0.9% for AGIs $25k-50k, 1.7% for AGIs $50k-75k, 2.3% for AGIs $75k-100k, 2.7% for AGIs over 100k)
Total tax: $5,344 (reported on 62.4% of returns)
79761:
$5,344
State:
$9,058
(% of AGI for various income ranges: 2.6% for AGIs below $10k, 3.1% for AGIs $10k-25k, 5.9% for AGIs $25k-50k, 8.9% for AGIs $50k-75k, 11.5% for AGIs $75k-100k, 20.3% for AGIs over 100k)
Earned income credit: $2,016 (reported on 32.4% of returns)
Here:
$2,016
State:
$2,024
Percentage of individuals using paid preparers for their 2004 taxes: 63.8%
Here:
64%
State:
57%
(% for various income ranges: 59.4% for AGIs below $10k, 67.6% for AGIs $10k-25k, 63.0% for AGIs $25k-50k, 61.8% for AGIs $50k-75k, 61.2% for AGIs $75k-100k, 73.6% for AGIs over 100k)
Likely homosexual households (counted as self-reported same-sex unmarried-partner households)
Lesbian couples: 0.6% of all households
Gay men: 0.4% of all households
Household received Food Stamps/SNAP in the past 12 months: 1,787 Household did not receive Food Stamps/SNAP in the past 12 months: 11,699
Women who had a birth in the past 12 months: 867 (440 now married, 417 unmarried) Women who did not have a birth in the past 12 months: 6,773 (2,851 now married, 3,925 unmarried)
Housing units in zip code 79761 with a mortgage: 3,505 (210 second mortgage, 135 both second mortgage and home equity loan) Houses without a mortgage: 15
Median monthly owner costs for units with a mortgage: $1,424 Median monthly owner costs for units without a mortgage: $488
Residents with income below the poverty level in 2022:
This zip code:
12.4%
Whole state:
14.0%
Residents with income below 50% of the poverty level in 2022:
This zip code:
5.4%
Whole state:
7.4%
Median number of rooms in houses and condos:
Here:
5.6
State:
6.3
Median number of rooms in apartments:
Here:
3.9
State:
4.0
Notable locations in this zip code not listed on our city pages
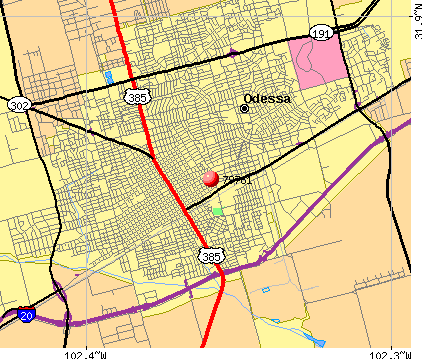
Notable locations in zip code 79761: Blackshear Staduim (A), Mesco Windmill (B), Ector County Courthouse (C), Odessa Fire Department Station 2 (D), Odessa Fire Department Central Station (E), The White-Pool House (F), The Presidential Museum (G), Odessa Fire Department Chief (H), Med - Trans Corporation (I), Carols Ambulance (J), Preferred Ambulance (K), Parker House Ranching Heritage Museum (L), White-Pool House (M). Display/hide their locations on the map
Churches in zip code 79761 include: Bethel Baptist Church (A), Beacon Baptist Church (B), First Assembly of God Church (C), Iglesia Episcopal San Miguel Church (D), Grandview Church of God (E), First Church of God (F), Washington Avenue Church of Christ (G), Tanglewood Church of Christ (H), Highland and Bunche Street Church of Christ (I). Display/hide their locations on the map
Parks in zip code 79761 include: Woodson Park (1), Jim Parker Park (2), O'Connor Park (3), South Side Community Park (4), East Side Park (5), Royalty Park (6), Crump Park (7), Central Park (8), Progressive Park (9). Display/hide their locations on the map
In group quarters: 547 (-1 institutionalized population)
Size of family households: 2,673 2-persons, 2,352 3-persons, 1,374 4-persons, 1,263 5-persons, 435 6-persons, 59 7-or-more-persons
Size of nonfamily households: 4,622 1-person, 594 2-persons, 115 3-persons
5,171 married couples with children.
2,816 single-parent households (250 men, 2,566 women).
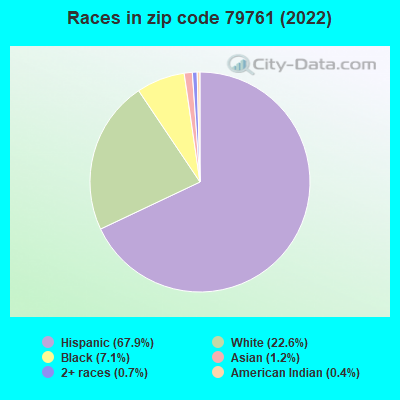
49.6% of residents of 79761 zip code speak English at home.
47.9% of residents speak Spanish at home (74% very well, 14% well, 9% not well, 4% not at all).
0.7% of residents speak other Indo-European language at home (63% very well, 28% well, 9% not well).
1.0% of residents speak Asian or Pacific Island language at home (92% very well, 8% well).
0.6% of residents speak other language at home (100% very well).
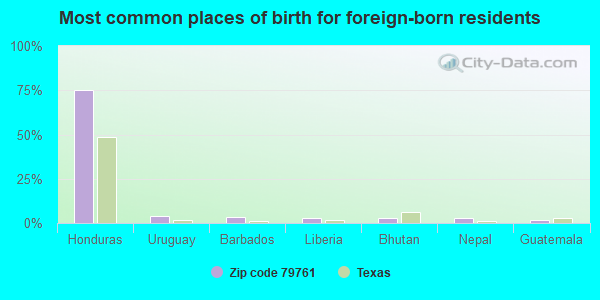
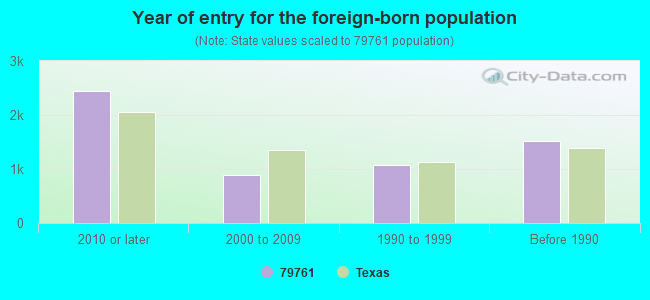
Foreign born population: 5,577 (17.2%) (33.5% of them are naturalized citizens)
Facilities with environmental interests located in this zip code:
ACE HI RENTALS INC (302 S INDUSTRIAL in ODESSA, TX)
(Resource Conservation and Recovery Act (tracking hazardous waste)) Business NAICS classification: ALL OTHER CONSUMER GOODS RENTAL.
AMERI PRIDE LINEN AND APPAREL SERVICES (1201 S JACKSON AVE in ODESSA, TX)
(Resource Conservation and Recovery Act (tracking hazardous waste)) Organizations: AMERICAN LINEN SUPPLY CO (CONTACT/OPERATOR)
Alternative names: SANITARY LINEN SVC
3-WAY AUTOMOTIVE (820 EAST 7TH STREET in ODESSA, TX)
AIR MINOR (AIRS/AFS) Business SIC classification: GENERAL AUTOMOTIVE REPAIR SHOPS
A & C AUTOMOTIVE (720 EAST 7TH STREET in ODESSA, TX)
AIR MINOR (AIRS/AFS) Business SIC classification: GENERAL AUTOMOTIVE REPAIR SHOPS
ACE TECH AUTO SERVICES (2321 KERMIT HIGHWAY in ODESSA, TX)
(Resource Conservation and Recovery Act (tracking hazardous waste))
APACHE MACHINE & MFG INC (530 RYAN AVE in ODESSA, TX)
(Resource Conservation and Recovery Act (tracking hazardous waste))
Housing units lacking complete plumbing facilities: 2.3% Housing units lacking complete kitchen facilities: 2.3%
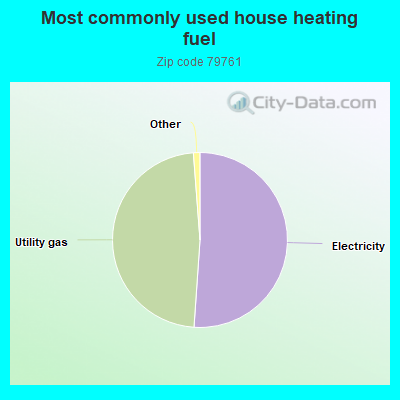
51.1%Electricity
47.7%Utility gas
Population in 1990: 30,126.
Place of birth for U.S.-born residents:
This state: 21,685
Northeast: 457
Midwest: 688
South: 919
West: 2,737
59% of the 79761 zip code residents lived in the same house 5 years ago. Out of people who lived in different houses, 72% lived in this county. Out of people who lived in different counties, 50% lived in Texas.
85% of the 79761 zip code residents lived in the same house 1 year ago. Out of people who lived in different houses, 51% moved from this county. Out of people who lived in different houses, 30% moved from different county within same state. Out of people who lived in different houses, 15% moved from different state. Out of people who lived in different houses, 3% moved from abroad.
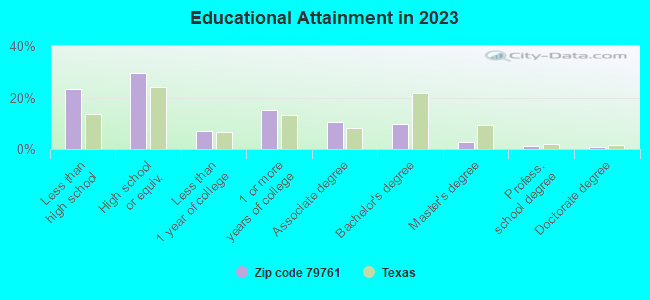
Private vs. public school enrollment:
Students in private schools in grades 1 to 8 (elementary and middle school): 109
Here:
3.1%
Texas:
8.8%
Students in private schools in grades 9 to 12 (high school): 159
Here:
7.4%
Texas:
8.0%
Students in private undergraduate colleges: 147
Here:
10.4%
Texas:
16.2%
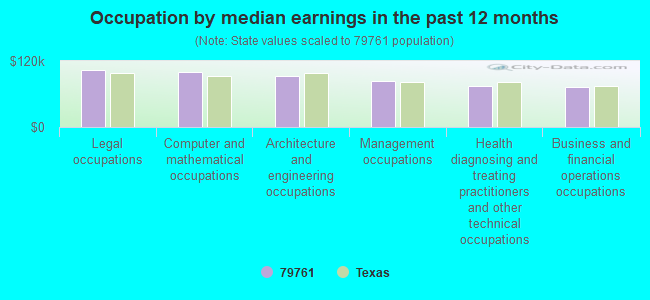
Occupation by median earnings in the past 12 months ($)
103,362Legal occupations
99,461Computer and mathematical occupations
91,929Architecture and engineering occupations
83,617Management occupations
75,241Health diagnosing and treating practitioners and other technical occupations
73,622Business and financial operations occupations
Companies with federal contracts located in this zip code (ODESSA, TX):
BLACK MOUNTAIN STORES INC (1721 N TEXAS AVE; small business)
$83,395 with Army for Water Purification Equipment. Signed on 2003-01-25. Completion date: 2003-02-03.
PATHTECH, LTD (1436 BRITTANY LN; small business) : $29,610 in 6 contractsfrom 2004 to 2005
Contracts for Radio and Television Communication Equipment, Except Airborne, ADP Input/Output and Storage Devices, Miscellaneous Communication Equipment by Geological Survey, Army, Air Force Signed by year:2000: $0; 2001: $0; 2002: $0; 2003: $0; 2004: $22,068; 2005: $7,542; 2006: $0.
Biggest contracts:
$12,595 with Geological Survey for Radio and Television Communication Equipment, Except Airborne. Signed on 2004-08-09. Completion date: 2004-09-03.
$4,998 with Army for ADP Input/Output and Storage Devices. Signed on 2004-05-13. Completion date: 2004-05-20.
$4,475 with Army for Radio and Television Communication Equipment, Except Airborne. Signed on 2004-04-22. Completion date: 2004-05-31.
$3,970 with Air Force for Miscellaneous Communication Equipment. Signed on 2005-09-22. Completion date: 2005-10-21.
CITY OF MIDLAND (9506 LA FORCE BLVD) : $15,214 in 11 contractsfrom 2001 to 2003
Contracts for Waste Treatment and Storage by Public Buildings Service Signed by year:2000: $0; 2001: $3,742; 2002: $0; 2003: $11,472; 2004: $0; 2005: $0; 2006: $0.
Biggest contracts:
$3,145 with Public Buildings Service for Waste Treatment and Storage. Signed on 2001-11-15. Completion date: 2001-11-15.
$2,425, same as above.Signed on 2003-06-15. Completion date: 2003-06-15.
$2,022, same as above.Signed on 2003-07-15. Completion date: 2003-07-15.
$1,700, same as above.Signed on 2003-08-15. Completion date: 2003-08-15.
JIMMIE M ANDERSON (2106 HAYWOOD AVE; small business) : $14,225 in 2 contractsfrom 2004 to 2005
$7,150 with Army for Custodial Janitorial Services. Signed on 2005-03-25. Completion date: 2004-04-01.
$7,075, same as above.Signed on 2004-03-16. Completion date: 2004-04-01.
H AND K ARMORED SERVICE INC (713 E 3RD; small business)
$4,400 with Defense Commissary Agency for Guard Services. Signed on 2005-04-29. Completion date: 2006-05-31.
ENGINE SERVICE & SUPPLY COMPAN (1902 ANDREWS HWY; small business)
$4,195 with Army for Inspection Gages and Precision Layout Tools. Signed on 2004-04-13. Completion date: 2004-04-16.
Top industries in this zip code by the number of employees in 2005:
Health Care and Social Assistance: Home Health Care Services (over 1000 employees: 1 establishment, 100-249 employees: 1 establishment, 50-99 employees: 2 establishments, 20-49 employees: 1 establishment, 10-19 employees: 1 establishment, 5-9 employees: 1 establishment)
Health Care and Social Assistance: Offices of Physicians (except Mental Health Specialists) (250-499: 1, 20-49: 6, 10-19: 10, 5-9: 27, 1-4: 31)
Administrative and Support and Waste Management and Remediation Services: Telemarketing Bureaus (500-999: 1, 100-249: 1, 20-49: 1)
2002 - 2018 National Fire Incident Reporting System (NFIRS) incidents
According to the data from the years 2002 - 2018 the average number of fires per year is 130. The highest number of fire incidents - 175 took place in 2006, and the least - 16 in 2002. The data has a growing trend.
When looking into fire subcategories, the most reports belonged to: Outside Fires (45.7%), and Structure Fires (36.4%).
Fire incident types reported to NFIRS in Zip Code 79761


 Nearest zip codes: 79762, 79765, 79758, 79763, 79766, 79764.


 According to the data from the years 2002 - 2018 the average number of fires per year is 130. The highest number of fire incidents - 175 took place in 2006, and the least - 16 in 2002. The data has a growing trend.
 When looking into fire subcategories, the most reports belonged to: Outside Fires (45.7%), and Structure Fires (36.4%).