Estimated zip code population in 2022: 40,714
Zip code population in 2010: 39,056
Zip code population in 2000: 36,008
Houses and condos: 17,615
Renter-occupied apartments: 6,905
% of renters here:
43%State:
38%
March 2022 cost of living index in zip code 79762: 82.7
(low, U.S. average is 100)
Land area: 31.7
sq. mi.
Water area: 0.2
sq. mi.
Population density: 1,286 people per square mile (low).
OSM Map
General Map
Google Map
MSN Map
OSM Map
General Map
Google Map
MSN Map
OSM Map
General Map
Google Map
MSN Map
OSM Map
General Map
Google Map
MSN Map
Please wait while loading the map...
Real estate property taxes paid for housing units in 2022:
This zip code:
1.2% ($2,932)Texas:
1.5% ($4,050)
Median real estate property taxes paid for housing units with mortgages in 2022: $3,327 (1.3%)
Median real estate property taxes paid for housing units with no mortgage in 2022: $2,569 (1.2%)
Profiles of local businesses
Business Search - 14 Million verified businesses
Males: 20,308 Females: 20,406
For population 25 years and over in 79762:
High school or higher: 86.7%Bachelor's degree or higher: 21.5%Graduate or professional degree: 6.2%Unemployed: 4.8%Mean travel time to work (commute): 24.0 minutes
For population 15 years and over in 79762:
Never married: 33.8%Now married: 48.4%Separated: 1.0%Widowed: 4.9%Divorced: 11.8%
Zip code 79762 compared to state average:
Black race population percentage below state average. Length of stay since moving in significantly above state average. Percentage of population with a bachelor's degree or higher below state average. 21,489 52.8% Hispanic or Latino 15,047 37.0% White 2,496 6.1% Black 812 2.0% Two or more races 656 1.6% Asian 170 0.4% American Indian 42 0.1% Some other race
Data:
Median household income ($)
Median household income (% change since 2000)
Household income diversity
Ratio of average income to average house value (%)
Ratio of average income to average rent
Median household income ($) - White
Median household income ($) - Black or African American
Median household income ($) - Asian
Median household income ($) - Hispanic or Latino
Median household income ($) - American Indian and Alaska Native
Median household income ($) - Multirace
Median household income ($) - Other Race
Median household income for houses/condos with a mortgage ($)
Median household income for apartments without a mortgage ($)
Races - White alone (%)
Races - White alone (% change since 2000)
Races - Black alone (%)
Races - Black alone (% change since 2000)
Races - American Indian alone (%)
Races - American Indian alone (% change since 2000)
Races - Asian alone (%)
Races - Asian alone (% change since 2000)
Races - Hispanic (%)
Races - Hispanic (% change since 2000)
Races - Native Hawaiian and Other Pacific Islander alone (%)
Races - Native Hawaiian and Other Pacific Islander alone (% change since 2000)
Races - Two or more races (%)
Races - Two or more races (% change since 2000)
Races - Other race alone (%)
Races - Other race alone (% change since 2000)
Racial diversity
Unemployment (%)
Unemployment (% change since 2000)
Unemployment (%) - White
Unemployment (%) - Black or African American
Unemployment (%) - Asian
Unemployment (%) - Hispanic or Latino
Unemployment (%) - American Indian and Alaska Native
Unemployment (%) - Multirace
Unemployment (%) - Other Race
Population density (people per square mile)
Population - Males (%)
Population - Females (%)
Population - Males (%) - White
Population - Males (%) - Black or African American
Population - Males (%) - Asian
Population - Males (%) - Hispanic or Latino
Population - Males (%) - American Indian and Alaska Native
Population - Males (%) - Multirace
Population - Males (%) - Other Race
Population - Females (%) - White
Population - Females (%) - Black or African American
Population - Females (%) - Asian
Population - Females (%) - Hispanic or Latino
Population - Females (%) - American Indian and Alaska Native
Population - Females (%) - Multirace
Population - Females (%) - Other Race
Coronavirus confirmed cases (Apr 27, 2024)
Deaths caused by coronavirus (Apr 27, 2024)
Coronavirus confirmed cases (per 100k population) (Apr 27, 2024)
Deaths caused by coronavirus (per 100k population) (Apr 27, 2024)
Daily increase in number of cases (Apr 27, 2024)
Weekly increase in number of cases (Apr 27, 2024)
Cases doubled (in days) (Apr 27, 2024)
Hospitalized patients (Apr 18, 2022)
Negative test results (Apr 18, 2022)
Total test results (Apr 18, 2022)
COVID Vaccine doses distributed (per 100k population) (Sep 19, 2023)
COVID Vaccine doses administered (per 100k population) (Sep 19, 2023)
COVID Vaccine doses distributed (Sep 19, 2023)
COVID Vaccine doses administered (Sep 19, 2023)
Likely homosexual households (%)
Likely homosexual households (% change since 2000)
Likely homosexual households - Lesbian couples (%)
Likely homosexual households - Lesbian couples (% change since 2000)
Likely homosexual households - Gay men (%)
Likely homosexual households - Gay men (% change since 2000)
Cost of living index
Median gross rent ($)
Median contract rent ($)
Median monthly housing costs ($)
Median house or condo value ($)
Median house or condo value ($ change since 2000)
Mean house or condo value by units in structure - 1, detached ($)
Mean house or condo value by units in structure - 1, attached ($)
Mean house or condo value by units in structure - 2 ($)
Mean house or condo value by units in structure by units in structure - 3 or 4 ($)
Mean house or condo value by units in structure - 5 or more ($)
Mean house or condo value by units in structure - Boat, RV, van, etc. ($)
Mean house or condo value by units in structure - Mobile home ($)
Median house or condo value ($) - White
Median house or condo value ($) - Black or African American
Median house or condo value ($) - Asian
Median house or condo value ($) - Hispanic or Latino
Median house or condo value ($) - American Indian and Alaska Native
Median house or condo value ($) - Multirace
Median house or condo value ($) - Other Race
Median resident age
Resident age diversity
Median resident age - Males
Median resident age - Females
Median resident age - White
Median resident age - Black or African American
Median resident age - Asian
Median resident age - Hispanic or Latino
Median resident age - American Indian and Alaska Native
Median resident age - Multirace
Median resident age - Other Race
Median resident age - Males - White
Median resident age - Males - Black or African American
Median resident age - Males - Asian
Median resident age - Males - Hispanic or Latino
Median resident age - Males - American Indian and Alaska Native
Median resident age - Males - Multirace
Median resident age - Males - Other Race
Median resident age - Females - White
Median resident age - Females - Black or African American
Median resident age - Females - Asian
Median resident age - Females - Hispanic or Latino
Median resident age - Females - American Indian and Alaska Native
Median resident age - Females - Multirace
Median resident age - Females - Other Race
Commute - mean travel time to work (minutes)
Travel time to work - Less than 5 minutes (%)
Travel time to work - Less than 5 minutes (% change since 2000)
Travel time to work - 5 to 9 minutes (%)
Travel time to work - 5 to 9 minutes (% change since 2000)
Travel time to work - 10 to 19 minutes (%)
Travel time to work - 10 to 19 minutes (% change since 2000)
Travel time to work - 20 to 29 minutes (%)
Travel time to work - 20 to 29 minutes (% change since 2000)
Travel time to work - 30 to 39 minutes (%)
Travel time to work - 30 to 39 minutes (% change since 2000)
Travel time to work - 40 to 59 minutes (%)
Travel time to work - 40 to 59 minutes (% change since 2000)
Travel time to work - 60 to 89 minutes (%)
Travel time to work - 60 to 89 minutes (% change since 2000)
Travel time to work - 90 or more minutes (%)
Travel time to work - 90 or more minutes (% change since 2000)
Marital status - Never married (%)
Marital status - Now married (%)
Marital status - Separated (%)
Marital status - Widowed (%)
Marital status - Divorced (%)
Median family income ($)
Median family income (% change since 2000)
Median non-family income ($)
Median non-family income (% change since 2000)
Median per capita income ($)
Median per capita income (% change since 2000)
Median family income ($) - White
Median family income ($) - Black or African American
Median family income ($) - Asian
Median family income ($) - Hispanic or Latino
Median family income ($) - American Indian and Alaska Native
Median family income ($) - Multirace
Median family income ($) - Other Race
Median year house/condo built
Median year apartment built
Year house built - Built 2005 or later (%)
Year house built - Built 2000 to 2004 (%)
Year house built - Built 1990 to 1999 (%)
Year house built - Built 1980 to 1989 (%)
Year house built - Built 1970 to 1979 (%)
Year house built - Built 1960 to 1969 (%)
Year house built - Built 1950 to 1959 (%)
Year house built - Built 1940 to 1949 (%)
Year house built - Built 1939 or earlier (%)
Average household size
Household density (households per square mile)
Average household size - White
Average household size - Black or African American
Average household size - Asian
Average household size - Hispanic or Latino
Average household size - American Indian and Alaska Native
Average household size - Multirace
Average household size - Other Race
Occupied housing units (%)
Vacant housing units (%)
Owner occupied housing units (%)
Renter occupied housing units (%)
Vacancy status - For rent (%)
Vacancy status - For sale only (%)
Vacancy status - Rented or sold, not occupied (%)
Vacancy status - For seasonal, recreational, or occasional use (%)
Vacancy status - For migrant workers (%)
Vacancy status - Other vacant (%)
Residents with income below the poverty level (%)
Residents with income below 50% of the poverty level (%)
Children below poverty level (%)
Poor families by family type - Married-couple family (%)
Poor families by family type - Male, no wife present (%)
Poor families by family type - Female, no husband present (%)
Poverty status for native-born residents (%)
Poverty status for foreign-born residents (%)
Poverty among high school graduates not in families (%)
Poverty among people who did not graduate high school not in families (%)
Residents with income below the poverty level (%) - White
Residents with income below the poverty level (%) - Black or African American
Residents with income below the poverty level (%) - Asian
Residents with income below the poverty level (%) - Hispanic or Latino
Residents with income below the poverty level (%) - American Indian and Alaska Native
Residents with income below the poverty level (%) - Multirace
Residents with income below the poverty level (%) - Other Race
Air pollution - Air Quality Index (AQI)
Air pollution - CO
Air pollution - NO2
Air pollution - SO2
Air pollution - Ozone
Air pollution - PM10
Air pollution - PM25
Air pollution - Pb
Crime - Murders per 100,000 population
Crime - Rapes per 100,000 population
Crime - Robberies per 100,000 population
Crime - Assaults per 100,000 population
Crime - Burglaries per 100,000 population
Crime - Thefts per 100,000 population
Crime - Auto thefts per 100,000 population
Crime - Arson per 100,000 population
Crime - City-data.com crime index
Crime - Violent crime index
Crime - Property crime index
Crime - Murders per 100,000 population (5 year average)
Crime - Rapes per 100,000 population (5 year average)
Crime - Robberies per 100,000 population (5 year average)
Crime - Assaults per 100,000 population (5 year average)
Crime - Burglaries per 100,000 population (5 year average)
Crime - Thefts per 100,000 population (5 year average)
Crime - Auto thefts per 100,000 population (5 year average)
Crime - Arson per 100,000 population (5 year average)
Crime - City-data.com crime index (5 year average)
Crime - Violent crime index (5 year average)
Crime - Property crime index (5 year average)
1996 Presidential Elections Results (%) - Democratic Party (Clinton)
1996 Presidential Elections Results (%) - Republican Party (Dole)
1996 Presidential Elections Results (%) - Other
2000 Presidential Elections Results (%) - Democratic Party (Gore)
2000 Presidential Elections Results (%) - Republican Party (Bush)
2000 Presidential Elections Results (%) - Other
2004 Presidential Elections Results (%) - Democratic Party (Kerry)
2004 Presidential Elections Results (%) - Republican Party (Bush)
2004 Presidential Elections Results (%) - Other
2008 Presidential Elections Results (%) - Democratic Party (Obama)
2008 Presidential Elections Results (%) - Republican Party (McCain)
2008 Presidential Elections Results (%) - Other
2012 Presidential Elections Results (%) - Democratic Party (Obama)
2012 Presidential Elections Results (%) - Republican Party (Romney)
2012 Presidential Elections Results (%) - Other
2016 Presidential Elections Results (%) - Democratic Party (Clinton)
2016 Presidential Elections Results (%) - Republican Party (Trump)
2016 Presidential Elections Results (%) - Other
2020 Presidential Elections Results (%) - Democratic Party (Biden)
2020 Presidential Elections Results (%) - Republican Party (Trump)
2020 Presidential Elections Results (%) - Other
Ancestries Reported - Arab (%)
Ancestries Reported - Czech (%)
Ancestries Reported - Danish (%)
Ancestries Reported - Dutch (%)
Ancestries Reported - English (%)
Ancestries Reported - French (%)
Ancestries Reported - French Canadian (%)
Ancestries Reported - German (%)
Ancestries Reported - Greek (%)
Ancestries Reported - Hungarian (%)
Ancestries Reported - Irish (%)
Ancestries Reported - Italian (%)
Ancestries Reported - Lithuanian (%)
Ancestries Reported - Norwegian (%)
Ancestries Reported - Polish (%)
Ancestries Reported - Portuguese (%)
Ancestries Reported - Russian (%)
Ancestries Reported - Scotch-Irish (%)
Ancestries Reported - Scottish (%)
Ancestries Reported - Slovak (%)
Ancestries Reported - Subsaharan African (%)
Ancestries Reported - Swedish (%)
Ancestries Reported - Swiss (%)
Ancestries Reported - Ukrainian (%)
Ancestries Reported - United States (%)
Ancestries Reported - Welsh (%)
Ancestries Reported - West Indian (%)
Ancestries Reported - Other (%)
Educational Attainment - No schooling completed (%)
Educational Attainment - Less than high school (%)
Educational Attainment - High school or equivalent (%)
Educational Attainment - Less than 1 year of college (%)
Educational Attainment - 1 or more years of college (%)
Educational Attainment - Associate degree (%)
Educational Attainment - Bachelor's degree (%)
Educational Attainment - Master's degree (%)
Educational Attainment - Professional school degree (%)
Educational Attainment - Doctorate degree (%)
School Enrollment - Nursery, preschool (%)
School Enrollment - Kindergarten (%)
School Enrollment - Grade 1 to 4 (%)
School Enrollment - Grade 5 to 8 (%)
School Enrollment - Grade 9 to 12 (%)
School Enrollment - College undergrad (%)
School Enrollment - Graduate or professional (%)
School Enrollment - Not enrolled in school (%)
School enrollment - Public schools (%)
School enrollment - Private schools (%)
School enrollment - Not enrolled (%)
Median number of rooms in houses and condos
Median number of rooms in apartments
Housing units lacking complete plumbing facilities (%)
Housing units lacking complete kitchen facilities (%)
Density of houses
Urban houses (%)
Rural houses (%)
Households with people 60 years and over (%)
Households with people 65 years and over (%)
Households with people 75 years and over (%)
Households with one or more nonrelatives (%)
Households with no nonrelatives (%)
Population in households (%)
Family households (%)
Nonfamily households (%)
Population in families (%)
Family households with own children (%)
Median number of bedrooms in owner occupied houses
Mean number of bedrooms in owner occupied houses
Median number of bedrooms in renter occupied houses
Mean number of bedrooms in renter occupied houses
Median number of vehichles in owner occupied houses
Mean number of vehichles in owner occupied houses
Median number of vehichles in renter occupied houses
Mean number of vehichles in renter occupied houses
Mortgage status - with mortgage (%)
Mortgage status - with second mortgage (%)
Mortgage status - with home equity loan (%)
Mortgage status - with both second mortgage and home equity loan (%)
Mortgage status - without a mortgage (%)
Average family size
Average family size - White
Average family size - Black or African American
Average family size - Asian
Average family size - Hispanic or Latino
Average family size - American Indian and Alaska Native
Average family size - Multirace
Average family size - Other Race
Geographical mobility - Same house 1 year ago (%)
Geographical mobility - Moved within same county (%)
Geographical mobility - Moved from different county within same state (%)
Geographical mobility - Moved from different state (%)
Geographical mobility - Moved from abroad (%)
Place of birth - Born in state of residence (%)
Place of birth - Born in other state (%)
Place of birth - Native, outside of US (%)
Place of birth - Foreign born (%)
Housing units in structures - 1, detached (%)
Housing units in structures - 1, attached (%)
Housing units in structures - 2 (%)
Housing units in structures - 3 or 4 (%)
Housing units in structures - 5 to 9 (%)
Housing units in structures - 10 to 19 (%)
Housing units in structures - 20 to 49 (%)
Housing units in structures - 50 or more (%)
Housing units in structures - Mobile home (%)
Housing units in structures - Boat, RV, van, etc. (%)
House/condo owner moved in on average (years ago)
Renter moved in on average (years ago)
Year householder moved into unit - Moved in 1999 to March 2000 (%)
Year householder moved into unit - Moved in 1995 to 1998 (%)
Year householder moved into unit - Moved in 1990 to 1994 (%)
Year householder moved into unit - Moved in 1980 to 1989 (%)
Year householder moved into unit - Moved in 1970 to 1979 (%)
Year householder moved into unit - Moved in 1969 or earlier (%)
Means of transportation to work - Drove car alone (%)
Means of transportation to work - Carpooled (%)
Means of transportation to work - Public transportation (%)
Means of transportation to work - Bus or trolley bus (%)
Means of transportation to work - Streetcar or trolley car (%)
Means of transportation to work - Subway or elevated (%)
Means of transportation to work - Railroad (%)
Means of transportation to work - Ferryboat (%)
Means of transportation to work - Taxicab (%)
Means of transportation to work - Motorcycle (%)
Means of transportation to work - Bicycle (%)
Means of transportation to work - Walked (%)
Means of transportation to work - Other means (%)
Working at home (%)
Industry diversity
Most Common Industries - Agriculture, forestry, fishing and hunting, and mining (%)
Most Common Industries - Agriculture, forestry, fishing and hunting (%)
Most Common Industries - Mining, quarrying, and oil and gas extraction (%)
Most Common Industries - Construction (%)
Most Common Industries - Manufacturing (%)
Most Common Industries - Wholesale trade (%)
Most Common Industries - Retail trade (%)
Most Common Industries - Transportation and warehousing, and utilities (%)
Most Common Industries - Transportation and warehousing (%)
Most Common Industries - Utilities (%)
Most Common Industries - Information (%)
Most Common Industries - Finance and insurance, and real estate and rental and leasing (%)
Most Common Industries - Finance and insurance (%)
Most Common Industries - Real estate and rental and leasing (%)
Most Common Industries - Professional, scientific, and management, and administrative and waste management services (%)
Most Common Industries - Professional, scientific, and technical services (%)
Most Common Industries - Management of companies and enterprises (%)
Most Common Industries - Administrative and support and waste management services (%)
Most Common Industries - Educational services, and health care and social assistance (%)
Most Common Industries - Educational services (%)
Most Common Industries - Health care and social assistance (%)
Most Common Industries - Arts, entertainment, and recreation, and accommodation and food services (%)
Most Common Industries - Arts, entertainment, and recreation (%)
Most Common Industries - Accommodation and food services (%)
Most Common Industries - Other services, except public administration (%)
Most Common Industries - Public administration (%)
Occupation diversity
Most Common Occupations - Management, business, science, and arts occupations (%)
Most Common Occupations - Management, business, and financial occupations (%)
Most Common Occupations - Management occupations (%)
Most Common Occupations - Business and financial operations occupations (%)
Most Common Occupations - Computer, engineering, and science occupations (%)
Most Common Occupations - Computer and mathematical occupations (%)
Most Common Occupations - Architecture and engineering occupations (%)
Most Common Occupations - Life, physical, and social science occupations (%)
Most Common Occupations - Education, legal, community service, arts, and media occupations (%)
Most Common Occupations - Community and social service occupations (%)
Most Common Occupations - Legal occupations (%)
Most Common Occupations - Education, training, and library occupations (%)
Most Common Occupations - Arts, design, entertainment, sports, and media occupations (%)
Most Common Occupations - Healthcare practitioners and technical occupations (%)
Most Common Occupations - Health diagnosing and treating practitioners and other technical occupations (%)
Most Common Occupations - Health technologists and technicians (%)
Most Common Occupations - Service occupations (%)
Most Common Occupations - Healthcare support occupations (%)
Most Common Occupations - Protective service occupations (%)
Most Common Occupations - Fire fighting and prevention, and other protective service workers including supervisors (%)
Most Common Occupations - Law enforcement workers including supervisors (%)
Most Common Occupations - Food preparation and serving related occupations (%)
Most Common Occupations - Building and grounds cleaning and maintenance occupations (%)
Most Common Occupations - Personal care and service occupations (%)
Most Common Occupations - Sales and office occupations (%)
Most Common Occupations - Sales and related occupations (%)
Most Common Occupations - Office and administrative support occupations (%)
Most Common Occupations - Natural resources, construction, and maintenance occupations (%)
Most Common Occupations - Farming, fishing, and forestry occupations (%)
Most Common Occupations - Construction and extraction occupations (%)
Most Common Occupations - Installation, maintenance, and repair occupations (%)
Most Common Occupations - Production, transportation, and material moving occupations (%)
Most Common Occupations - Production occupations (%)
Most Common Occupations - Transportation occupations (%)
Most Common Occupations - Material moving occupations (%)
People in Group quarters - Institutionalized population (%)
People in Group quarters - Correctional institutions (%)
People in Group quarters - Federal prisons and detention centers (%)
People in Group quarters - Halfway houses (%)
People in Group quarters - Local jails and other confinement facilities (including police lockups) (%)
People in Group quarters - Military disciplinary barracks (%)
People in Group quarters - State prisons (%)
People in Group quarters - Other types of correctional institutions (%)
People in Group quarters - Nursing homes (%)
People in Group quarters - Hospitals/wards, hospices, and schools for the handicapped (%)
People in Group quarters - Hospitals/wards and hospices for chronically ill (%)
People in Group quarters - Hospices or homes for chronically ill (%)
People in Group quarters - Military hospitals or wards for chronically ill (%)
People in Group quarters - Other hospitals or wards for chronically ill (%)
People in Group quarters - Hospitals or wards for drug/alcohol abuse (%)
People in Group quarters - Mental (Psychiatric) hospitals or wards (%)
People in Group quarters - Schools, hospitals, or wards for the mentally retarded (%)
People in Group quarters - Schools, hospitals, or wards for the physically handicapped (%)
People in Group quarters - Institutions for the deaf (%)
People in Group quarters - Institutions for the blind (%)
People in Group quarters - Orthopedic wards and institutions for the physically handicapped (%)
People in Group quarters - Wards in general hospitals for patients who have no usual home elsewhere (%)
People in Group quarters - Wards in military hospitals for patients who have no usual home elsewhere (%)
People in Group quarters - Juvenile institutions (%)
People in Group quarters - Long-term care (%)
People in Group quarters - Homes for abused, dependent, and neglected children (%)
People in Group quarters - Residential treatment centers for emotionally disturbed children (%)
People in Group quarters - Training schools for juvenile delinquents (%)
People in Group quarters - Short-term care, detention or diagnostic centers for delinquent children (%)
People in Group quarters - Type of juvenile institution unknown (%)
People in Group quarters - Noninstitutionalized population (%)
People in Group quarters - College dormitories (includes college quarters off campus) (%)
People in Group quarters - Military quarters (%)
People in Group quarters - On base (%)
People in Group quarters - Barracks, unaccompanied personnel housing (UPH), (Enlisted/Officer), ;and similar group living quarters for military personnel (%)
People in Group quarters - Transient quarters for temporary residents (%)
People in Group quarters - Military ships (%)
People in Group quarters - Group homes (%)
People in Group quarters - Homes or halfway houses for drug/alcohol abuse (%)
People in Group quarters - Homes for the mentally ill (%)
People in Group quarters - Homes for the mentally retarded (%)
People in Group quarters - Homes for the physically handicapped (%)
People in Group quarters - Other group homes (%)
People in Group quarters - Religious group quarters (%)
People in Group quarters - Dormitories (%)
People in Group quarters - Agriculture workers' dormitories on farms (%)
People in Group quarters - Job Corps and vocational training facilities (%)
People in Group quarters - Other workers' dormitories (%)
People in Group quarters - Crews of maritime vessels (%)
People in Group quarters - Other nonhousehold living situations (%)
People in Group quarters - Other noninstitutional group quarters (%)
Residents speaking English at home (%)
Residents speaking English at home - Born in the United States (%)
Residents speaking English at home - Native, born elsewhere (%)
Residents speaking English at home - Foreign born (%)
Residents speaking Spanish at home (%)
Residents speaking Spanish at home - Born in the United States (%)
Residents speaking Spanish at home - Native, born elsewhere (%)
Residents speaking Spanish at home - Foreign born (%)
Residents speaking other language at home (%)
Residents speaking other language at home - Born in the United States (%)
Residents speaking other language at home - Native, born elsewhere (%)
Residents speaking other language at home - Foreign born (%)
Class of Workers - Employee of private company (%)
Class of Workers - Self-employed in own incorporated business (%)
Class of Workers - Private not-for-profit wage and salary workers (%)
Class of Workers - Local government workers (%)
Class of Workers - State government workers (%)
Class of Workers - Federal government workers (%)
Class of Workers - Self-employed workers in own not incorporated business and Unpaid family workers (%)
House heating fuel used in houses and condos - Utility gas (%)
House heating fuel used in houses and condos - Bottled, tank, or LP gas (%)
House heating fuel used in houses and condos - Electricity (%)
House heating fuel used in houses and condos - Fuel oil, kerosene, etc. (%)
House heating fuel used in houses and condos - Coal or coke (%)
House heating fuel used in houses and condos - Wood (%)
House heating fuel used in houses and condos - Solar energy (%)
House heating fuel used in houses and condos - Other fuel (%)
House heating fuel used in houses and condos - No fuel used (%)
House heating fuel used in apartments - Utility gas (%)
House heating fuel used in apartments - Bottled, tank, or LP gas (%)
House heating fuel used in apartments - Electricity (%)
House heating fuel used in apartments - Fuel oil, kerosene, etc. (%)
House heating fuel used in apartments - Coal or coke (%)
House heating fuel used in apartments - Wood (%)
House heating fuel used in apartments - Solar energy (%)
House heating fuel used in apartments - Other fuel (%)
House heating fuel used in apartments - No fuel used (%)
Armed forces status - In Armed Forces (%)
Armed forces status - Civilian (%)
Armed forces status - Civilian - Veteran (%)
Armed forces status - Civilian - Nonveteran (%)
Fatal accidents locations in years 2005-2021
Fatal accidents locations in 2005
Fatal accidents locations in 2006
Fatal accidents locations in 2007
Fatal accidents locations in 2008
Fatal accidents locations in 2009
Fatal accidents locations in 2010
Fatal accidents locations in 2011
Fatal accidents locations in 2012
Fatal accidents locations in 2013
Fatal accidents locations in 2014
Fatal accidents locations in 2015
Fatal accidents locations in 2016
Fatal accidents locations in 2017
Fatal accidents locations in 2018
Fatal accidents locations in 2019
Fatal accidents locations in 2020
Fatal accidents locations in 2021
Alcohol use - People drinking some alcohol every month (%)
Alcohol use - People not drinking at all (%)
Alcohol use - Average days/month drinking alcohol
Alcohol use - Average drinks/week
Alcohol use - Average days/year people drink much
Audiometry - Average condition of hearing (%)
Audiometry - People that can hear a whisper from across a quiet room (%)
Audiometry - People that can hear normal voice from across a quiet room (%)
Audiometry - Ears ringing, roaring, buzzing (%)
Audiometry - Had a job exposure to loud noise (%)
Audiometry - Had off-work exposure to loud noise (%)
Blood Pressure & Cholesterol - Has high blood pressure (%)
Blood Pressure & Cholesterol - Checking blood pressure at home (%)
Blood Pressure & Cholesterol - Frequently checking blood cholesterol (%)
Blood Pressure & Cholesterol - Has high cholesterol level (%)
Consumer Behavior - Money monthly spent on food at supermarket/grocery store
Consumer Behavior - Money monthly spent on food at other stores
Consumer Behavior - Money monthly spent on eating out
Consumer Behavior - Money monthly spent on carryout/delivered foods
Consumer Behavior - Income spent on food at supermarket/grocery store (%)
Consumer Behavior - Income spent on food at other stores (%)
Consumer Behavior - Income spent on eating out (%)
Consumer Behavior - Income spent on carryout/delivered foods (%)
Current Health Status - General health condition (%)
Current Health Status - Blood donors (%)
Current Health Status - Has blood ever tested for HIV virus (%)
Current Health Status - Left-handed people (%)
Dermatology - People using sunscreen (%)
Diabetes - Diabetics (%)
Diabetes - Had a blood test for high blood sugar (%)
Diabetes - People taking insulin (%)
Diet Behavior & Nutrition - Diet health (%)
Diet Behavior & Nutrition - Milk product consumption (# of products/month)
Diet Behavior & Nutrition - Meals not home prepared (#/week)
Diet Behavior & Nutrition - Meals from fast food or pizza place (#/week)
Diet Behavior & Nutrition - Ready-to-eat foods (#/month)
Diet Behavior & Nutrition - Frozen meals/pizza (#/month)
Drug Use - People that ever used marijuana or hashish (%)
Drug Use - Ever used hard drugs (%)
Drug Use - Ever used any form of cocaine (%)
Drug Use - Ever used heroin (%)
Drug Use - Ever used methamphetamine (%)
Health Insurance - People covered by health insurance (%)
Kidney Conditions-Urology - Avg. # of times urinating at night
Medical Conditions - People with asthma (%)
Medical Conditions - People with anemia (%)
Medical Conditions - People with psoriasis (%)
Medical Conditions - People with overweight (%)
Medical Conditions - Elderly people having difficulties in thinking or remembering (%)
Medical Conditions - People who ever received blood transfusion (%)
Medical Conditions - People having trouble seeing even with glass/contacts (%)
Medical Conditions - People with arthritis (%)
Medical Conditions - People with gout (%)
Medical Conditions - People with congestive heart failure (%)
Medical Conditions - People with coronary heart disease (%)
Medical Conditions - People with angina pectoris (%)
Medical Conditions - People who ever had heart attack (%)
Medical Conditions - People who ever had stroke (%)
Medical Conditions - People with emphysema (%)
Medical Conditions - People with thyroid problem (%)
Medical Conditions - People with chronic bronchitis (%)
Medical Conditions - People with any liver condition (%)
Medical Conditions - People who ever had cancer or malignancy (%)
Mental Health - People who have little interest in doing things (%)
Mental Health - People feeling down, depressed, or hopeless (%)
Mental Health - People who have trouble sleeping or sleeping too much (%)
Mental Health - People feeling tired or having little energy (%)
Mental Health - People with poor appetite or overeating (%)
Mental Health - People feeling bad about themself (%)
Mental Health - People who have trouble concentrating on things (%)
Mental Health - People moving or speaking slowly or too fast (%)
Mental Health - People having thoughts they would be better off dead (%)
Oral Health - Average years since last visit a dentist
Oral Health - People embarrassed because of mouth (%)
Oral Health - People with gum disease (%)
Oral Health - General health of teeth and gums (%)
Oral Health - Average days a week using dental floss/device
Oral Health - Average days a week using mouthwash for dental problem
Oral Health - Average number of teeth
Pesticide Use - Households using pesticides to control insects (%)
Pesticide Use - Households using pesticides to kill weeds (%)
Physical Activity - People doing vigorous-intensity work activities (%)
Physical Activity - People doing moderate-intensity work activities (%)
Physical Activity - People walking or bicycling (%)
Physical Activity - People doing vigorous-intensity recreational activities (%)
Physical Activity - People doing moderate-intensity recreational activities (%)
Physical Activity - Average hours a day doing sedentary activities
Physical Activity - Average hours a day watching TV or videos
Physical Activity - Average hours a day using computer
Physical Functioning - People having limitations keeping them from working (%)
Physical Functioning - People limited in amount of work they can do (%)
Physical Functioning - People that need special equipment to walk (%)
Physical Functioning - People experiencing confusion/memory problems (%)
Physical Functioning - People requiring special healthcare equipment (%)
Prescription Medications - Average number of prescription medicines taking
Preventive Aspirin Use - Adults 40+ taking low-dose aspirin (%)
Reproductive Health - Vaginal deliveries (%)
Reproductive Health - Cesarean deliveries (%)
Reproductive Health - Deliveries resulted in a live birth (%)
Reproductive Health - Pregnancies resulted in a delivery (%)
Reproductive Health - Women breastfeeding newborns (%)
Reproductive Health - Women that had a hysterectomy (%)
Reproductive Health - Women that had both ovaries removed (%)
Reproductive Health - Women that have ever taken birth control pills (%)
Reproductive Health - Women taking birth control pills (%)
Reproductive Health - Women that have ever used Depo-Provera or injectables (%)
Reproductive Health - Women that have ever used female hormones (%)
Sexual Behavior - People 18+ that ever had sex (vaginal, anal, or oral) (%)
Sexual Behavior - Males 18+ that ever had vaginal sex with a woman (%)
Sexual Behavior - Males 18+ that ever performed oral sex on a woman (%)
Sexual Behavior - Males 18+ that ever had anal sex with a woman (%)
Sexual Behavior - Males 18+ that ever had any sex with a man (%)
Sexual Behavior - Females 18+ that ever had vaginal sex with a man (%)
Sexual Behavior - Females 18+ that ever performed oral sex on a man (%)
Sexual Behavior - Females 18+ that ever had anal sex with a man (%)
Sexual Behavior - Females 18+ that ever had any kind of sex with a woman (%)
Sexual Behavior - Average age people first had sex
Sexual Behavior - Average number of female sex partners in lifetime (males 18+)
Sexual Behavior - Average number of female vaginal sex partners in lifetime (males 18+)
Sexual Behavior - Average age people first performed oral sex on a woman (18+)
Sexual Behavior - Average number of woman performed oral sex on in lifetime (18+)
Sexual Behavior - Average number of male sex partners in lifetime (males 18+)
Sexual Behavior - Average number of male anal sex partners in lifetime (males 18+)
Sexual Behavior - Average age people first performed oral sex on a man (18+)
Sexual Behavior - Average number of male oral sex partners in lifetime (18+)
Sexual Behavior - People using protection when performing oral sex (%)
Sexual Behavior - Average number of times people have vaginal or anal sex a year
Sexual Behavior - People having sex without condom (%)
Sexual Behavior - Average number of male sex partners in lifetime (females 18+)
Sexual Behavior - Average number of male vaginal sex partners in lifetime (females 18+)
Sexual Behavior - Average number of female sex partners in lifetime (females 18+)
Sexual Behavior - Circumcised males 18+ (%)
Sleep Disorders - Average hours sleeping at night
Sleep Disorders - People that has trouble sleeping (%)
Smoking-Cigarette Use - People smoking cigarettes (%)
Taste & Smell - People 40+ having problems with smell (%)
Taste & Smell - People 40+ having problems with taste (%)
Taste & Smell - People 40+ that ever had wisdom teeth removed (%)
Taste & Smell - People 40+ that ever had tonsils teeth removed (%)
Taste & Smell - People 40+ that ever had a loss of consciousness because of a head injury (%)
Taste & Smell - People 40+ that ever had a broken nose or other serious injury to face or skull (%)
Taste & Smell - People 40+ that ever had two or more sinus infections (%)
Weight - Average height (inches)
Weight - Average weight (pounds)
Weight - Average BMI
Weight - People that are obese (%)
Weight - People that ever were obese (%)
Weight - People trying to lose weight (%)
Urban population: 40,095
Rural population: 618
Estimated median house/condo value in 2022: $241,149
79762:
$241,149Texas:
$275,400
According to our research of Texas and other state lists, there were 71 registered sex offenders living in 79762 zip code as of April 27, 2024 . The ratio of all residents to sex offenders in zip code 79762 is 626 to 1.The ratio of registered sex offenders to all residents in this zip code is lower than the state average.
Median resident age: This zip code:
31.8 yearsTexas median age:
35.6 years
Average household size: This zip code:
2.5 peopleTexas:
2.6 people
Averages for the 2020 tax year for zip code 79762, filed in 2021:
Average Adjusted Gross Income (AGI) in 2020: $68,987 (Individual Income Tax Returns) Here:
$68,987State:
$77,054
Salary/wage: $57,210 (reported on 86.9% of returns )Here:
$57,210State:
$62,766
(% of AGI for various income ranges: 1153.0% for AGIs below $25k , 3524.3% for AGIs $25k-50k , 6360.5% for AGIs $50k-75k , 9677.7% for AGIs $75k-100k , 16294.9% for AGIs $100k-200k , 67166.3% for AGIs over 200k ) Taxable interest for individuals: $2,163 (reported on 19.1% of returns )This zip code:
$2,163Texas:
$2,665
(% of AGI for various income ranges: 7.9% for AGIs below $25k , 9.5% for AGIs $25k-50k , 19.4% for AGIs $50k-75k , 27.4% for AGIs $75k-100k , 62.2% for AGIs $100k-200k , 2468.4% for AGIs over 200k ) Ordinary dividends: $8,621 (reported on 9.9% of returns )(% of AGI for various income ranges: 10.7% for AGIs below $25k , 15.7% for AGIs $25k-50k , 36.3% for AGIs $50k-75k , 67.7% for AGIs $75k-100k , 135.2% for AGIs $100k-200k , 5216.3% for AGIs over 200k ) Net capital gain/loss in AGI: +$22,671 (reported on 9.9% of returns )Here:
+$22,671State:
+$39,590
(% of AGI for various income ranges: 7.4% for AGIs below $25k , 11.9% for AGIs $25k-50k , 40.8% for AGIs $50k-75k , 81.8% for AGIs $75k-100k , 245.6% for AGIs $100k-200k , 17137.4% for AGIs over 200k ) Profit/loss from business: +$9,206 (reported on 18.4% of returns )Here:
+$9,206State:
+$10,888
(% of AGI for various income ranges: 132.6% for AGIs below $25k , 94.0% for AGIs $25k-50k , 108.3% for AGIs $50k-75k , 239.4% for AGIs $75k-100k , 405.4% for AGIs $100k-200k , 4248.9% for AGIs over 200k ) Taxable individual retirement arrangement distribution: $21,644 (reported on 5.8% of returns )79762:
$21,644Texas:
$24,740
(% of AGI for various income ranges: 29.4% for AGIs below $25k , 48.7% for AGIs $25k-50k , 88.2% for AGIs $50k-75k , 232.7% for AGIs $75k-100k , 399.0% for AGIs $100k-200k , 3578.4% for AGIs over 200k ) Self-employed (Keogh) retirement plans: $21,567 (reported on 0.2% of returns )79762:
$21,567Texas:
$29,298
(% of AGI for various income ranges: 37.2% for AGIs $100k-200k ) Total itemized deductions: $39,954 (reported on 5.2% of returns )Here:
$39,954State:
$40,428
(% of AGI for various income ranges: 30.8% for AGIs below $25k , 96.4% for AGIs $25k-50k , 179.9% for AGIs $50k-75k , 323.3% for AGIs $75k-100k , 475.8% for AGIs $100k-200k , 7808.9% for AGIs over 200k ) Charity contributions: $23,449 (reported on 3.9% of returns )Here:
$23,449State:
$18,201
(% of AGI for various income ranges: 3.1% for AGIs below $25k , 17.2% for AGIs $25k-50k , 37.3% for AGIs $50k-75k , 81.8% for AGIs $75k-100k , 166.6% for AGIs $100k-200k , 5396.8% for AGIs over 200k ) Taxes paid: $6,735 (reported on 5.0% of returns )(% of AGI for various income ranges: 4.8% for AGIs below $25k , 15.6% for AGIs $25k-50k , 36.6% for AGIs $50k-75k , 65.1% for AGIs $75k-100k , 96.1% for AGIs $100k-200k , 896.3% for AGIs over 200k ) Earned income credit: $2,369 (reported on 18.2% of returns )(% of AGI for various income ranges: 118.2% for AGIs below $25k , 72.5% for AGIs $25k-50k , 1.6% for AGIs $50k-75k ) Percentage of individuals using paid preparers for their 2020 taxes: 92.7%(% for various income ranges: 91.1% for AGIs below $25k , 93.7% for AGIs $25k-50k , 93.2% for AGIs $50k-75k , 93.5% for AGIs $75k-100k , 93.8% for AGIs $100k-200k , 88.3% for AGIs over 200k )
Averages for the 2012 tax year for zip code 79762, filed in 2013:
Average Adjusted Gross Income (AGI) in 2012: $72,753 (Individual Income Tax Returns) Here:
$72,753State:
$65,384
Salary/wage: $56,451 (reported on 89.4% of returns )Here:
$56,451State:
$52,524
(% of AGI for various income ranges: 82.5% for AGIs below $25k , 87.9% for AGIs $25k-50k , 86.9% for AGIs $50k-75k , 85.8% for AGIs $75k-100k , 83.4% for AGIs $100k-200k , 38.5% for AGIs over 200k ) Taxable interest for individuals: $2,303 (reported on 22.2% of returns )This zip code:
$2,303Texas:
$2,372
(% of AGI for various income ranges: 0.8% for AGIs below $25k , 0.3% for AGIs $25k-50k , 0.4% for AGIs $50k-75k , 0.4% for AGIs $75k-100k , 0.4% for AGIs $100k-200k , 1.3% for AGIs over 200k ) Ordinary dividends: $19,465 (reported on 11.2% of returns )(% of AGI for various income ranges: 1.3% for AGIs below $25k , 0.6% for AGIs $25k-50k , 0.4% for AGIs $50k-75k , 0.6% for AGIs $75k-100k , 0.6% for AGIs $100k-200k , 7.6% for AGIs over 200k ) Net capital gain/loss in AGI: +$60,266 (reported on 8.7% of returns )Here:
+$60,266State:
+$35,319
(% of AGI for various income ranges: 0.2% for AGIs $25k-50k , 0.3% for AGIs $50k-75k , 0.4% for AGIs $75k-100k , 0.6% for AGIs $100k-200k , 20.4% for AGIs over 200k ) Profit/loss from business: +$19,383 (reported on 15.2% of returns )Here:
+$19,383State:
+$13,732
(% of AGI for various income ranges: 7.2% for AGIs below $25k , 3.0% for AGIs $25k-50k , 2.3% for AGIs $50k-75k , 2.2% for AGIs $75k-100k , 3.9% for AGIs $100k-200k , 5.3% for AGIs over 200k ) Taxable individual retirement arrangement distribution: $15,683 (reported on 7.1% of returns )79762:
$15,683Texas:
$19,511
(% of AGI for various income ranges: 1.9% for AGIs below $25k , 1.5% for AGIs $25k-50k , 1.5% for AGIs $50k-75k , 2.2% for AGIs $75k-100k , 2.2% for AGIs $100k-200k , 0.8% for AGIs over 200k ) Self-employment retirement plans: $24,260 (reported on 0.3% of returns )79762:
$24,260Texas:
$23,938
Total itemized deductions: $23,474 (13% of AGI, reported on 19.1% of returns )Here:
$23,474State:
$24,724
Here:
13.2% of AGIState:
15.9% of AGI
(% of AGI for various income ranges: 4.2% for AGIs below $25k , 5.3% for AGIs $25k-50k , 5.8% for AGIs $50k-75k , 6.4% for AGIs $75k-100k , 7.6% for AGIs $100k-200k , 5.9% for AGIs over 200k ) Charity contributions: $10,374 (reported on 13.2% of returns )(% of AGI for various income ranges: 0.5% for AGIs below $25k , 0.6% for AGIs $25k-50k , 0.9% for AGIs $50k-75k , 1.3% for AGIs $75k-100k , 1.8% for AGIs $100k-200k , 3.2% for AGIs over 200k ) Taxes paid: $4,702 (reported on 18.4% of returns )(% of AGI for various income ranges: 0.6% for AGIs below $25k , 0.9% for AGIs $25k-50k , 1.1% for AGIs $50k-75k , 1.3% for AGIs $75k-100k , 1.8% for AGIs $100k-200k , 1.0% for AGIs over 200k ) Earned income credit: $2,328 (reported on 18.1% of returns )(% of AGI for various income ranges: 7.7% for AGIs below $25k , 1.1% for AGIs $25k-50k ) Percentage of individuals using paid preparers for their 2012 taxes: 56.1%(% for various income ranges: 52.5% for AGIs below $25k , 51.9% for AGIs $25k-50k , 58.5% for AGIs $50k-75k , 58.0% for AGIs $75k-100k , 61.4% for AGIs $100k-200k , 82.4% for AGIs over 200k )
Averages for the 2004 tax year for zip code 79762, filed in 2005:
Average Adjusted Gross Income (AGI) in 2004: $41,547 (Individual Income Tax Returns) Here:
$41,547State:
$47,881
Salary/wage: $36,924 (reported on 87.0% of returns )Here:
$36,924State:
$41,947
(% of AGI for various income ranges: 161.0% for AGIs below $10k , 83.3% for AGIs $10k-25k , 85.0% for AGIs $25k-50k , 82.3% for AGIs $50k-75k , 80.8% for AGIs $75k-100k , 62.0% for AGIs over 100k ) Taxable interest for individuals: $1,966 (reported on 31.6% of returns )This zip code:
$1,966Texas:
$2,255
(% of AGI for various income ranges: 5.8% for AGIs below $10k , 1.8% for AGIs $10k-25k , 1.2% for AGIs $25k-50k , 1.2% for AGIs $50k-75k , 1.1% for AGIs $75k-100k , 1.7% for AGIs over 100k ) Taxable dividends: $4,180 (reported on 16.0% of returns )(% of AGI for various income ranges: 3.1% for AGIs below $10k , 1.1% for AGIs $10k-25k , 0.7% for AGIs $25k-50k , 0.8% for AGIs $50k-75k , 0.8% for AGIs $75k-100k , 3.2% for AGIs over 100k ) Net capital gain/loss: +$9,968 (reported on 13.5% of returns )Here:
+$9,968State:
+$16,110
(% of AGI for various income ranges: -1.7% for AGIs below $10k , 0.0% for AGIs $10k-25k , 0.3% for AGIs $25k-50k , 1.1% for AGIs $50k-75k , 0.7% for AGIs $75k-100k , 9.0% for AGIs over 100k ) Profit/loss from business: +$10,305 (reported on 15.2% of returns )Here:
+$10,305State:
+$11,013
(% of AGI for various income ranges: 11.4% for AGIs below $10k , 4.0% for AGIs $10k-25k , 2.4% for AGIs $25k-50k , 2.7% for AGIs $50k-75k , 3.2% for AGIs $75k-100k , 5.2% for AGIs over 100k ) IRA payment deduction: $3,607 (reported on 1.9% of returns )(% of AGI for various income ranges: 0.1% for AGIs $10k-25k , 0.2% for AGIs $25k-50k , 0.2% for AGIs $50k-75k , 0.2% for AGIs $75k-100k , 0.1% for AGIs over 100k ) Self-employed pension: $13,406 (reported on 0.4% of returns )Here:
$13,406Texas:
$16,401
Total itemized deductions: $17,424 (19% of AGI, reported on 16.4% of returns )Here:
$17,424State:
$19,631
Here:
19.3% of AGIState:
18.9% of AGI
(% of AGI for various income ranges: 9.2% for AGIs below $10k , 3.9% for AGIs $10k-25k , 5.4% for AGIs $25k-50k , 7.5% for AGIs $50k-75k , 8.3% for AGIs $75k-100k , 7.8% for AGIs over 100k ) Charity contributions deductions: $5,959 (6% of AGI, reported on 13.4% of returns )Here:
6.1% of AGIState:
4.2% of AGI
(% of AGI for various income ranges: 1.0% for AGIs below $10k , 0.7% for AGIs $10k-25k , 1.0% for AGIs $25k-50k , 1.6% for AGIs $50k-75k , 2.0% for AGIs $75k-100k , 3.2% for AGIs over 100k ) Total tax: $6,933 (reported on 70.6% of returns )(% of AGI for various income ranges: 4.3% for AGIs below $10k , 3.7% for AGIs $10k-25k , 6.7% for AGIs $25k-50k , 9.0% for AGIs $50k-75k , 11.4% for AGIs $75k-100k , 20.2% for AGIs over 100k ) Earned income credit: $1,908 (reported on 22.2% of returns )Percentage of individuals using paid preparers for their 2004 taxes: 58.3%(% for various income ranges: 53.4% for AGIs below $10k , 60.8% for AGIs $10k-25k , 57.4% for AGIs $25k-50k , 57.5% for AGIs $50k-75k , 56.3% for AGIs $75k-100k , 71.2% for AGIs over 100k )
Estimated median household income in 2022: This zip code:
$75,782Texas:
$72,284
Nearest zip codes: 79758 ,
79761 ,
79765 ,
79763 ,
79764 ,
79707 .
Odessa Zip Code Map
Percentage of family households: This zip code:
54.3%Texas:
50.5%
Percentage of households with unmarried partners: This zip code:
6.4%Texas:
48.7%
Likely homosexual households (counted as self-reported same-sex unmarried-partner households)
Lesbian couples: 0.2% of all households Gay men: 0.3% of all households
Household received Food Stamps/SNAP in the past 12 months: 1,500Household did not receive Food Stamps/SNAP in the past 12 months: 14,609
Women who had a birth in the past 12 months: 647 (327 now married , 312 unmarried) Women who did not have a birth in the past 12 months: 9,996 (4,140 now married , 5,863 unmarried)
Housing units in zip code 79762 with a mortgage: 4,945 (163
second mortgage , 80
both second mortgage and home equity loan )
Houses without a mortgage: 144
Median monthly owner costs for units with a mortgage: $1,686
Median monthly owner costs for units without a mortgage: $609
Residents with income below the poverty level in 2022:
This zip code:
15.7%Whole state:
14.0%
Residents with income below 50% of the poverty level in 2022:
This zip code:
6.6%Whole state:
7.4%
Median number of rooms in houses and condos: Median number of rooms in apartments: Notable locations in this zip code not listed on our city pages
Click to draw/clear zip code borders Notable locations in zip code 79762: (A) , University of Texas Permian Basin Main Gymnasium (B) , Odessa Fire Department Station 3 (C) , Odessa Fire Department Station 6 (D) . Display/hide their locations on the map
Shopping Centers: (1) , Sherwood Shopping Center (2) , Town and Country Shopping Center (3) . Display/hide their locations on the map
Churches in zip code 79762 include: (A) , Saint Lukes Church (B) , Bethel Assembly of God Church (C) , Life Challenge United Pentecostal Church (D) , The Church of Jesus Christ of Latter Day Saints (E) , Wesley Evangelical Methodist Church (F) , Saint Lukes United Methodist Church (G) , Saint Barnabas Episcopal Church (H) , First Church of the Nazarene (I) . Display/hide their locations on the map
Cemetery: (1) . Display/hide its location on the map
Parks in zip code 79762 include: (1) , Optimist Park (2) , Murry Fly Park (3) , Sherwood Park (4) , Casa Bella Park (5) , Polyantha Park (6) , Bellaire Park (7) , University of Texas Permian Basin Falcon Softball Field (8) . Display/hide their locations on the map
Year house built (houses)
89 2020 or later1,311 2010 to 20191,133 2000 to 20092,102 1990 to 19992,816 1980 to 19892,815 1970 to 19792,125 1960 to 19693,806 1950 to 1959343 1940 to 194911 1939 or earlier
Zip code 79762 household income distribution in 2022 1,136 Less than $10,000606 $10,000 to $14,999290 $15,000 to $19,999368 $20,000 to $24,999417 $25,000 to $29,999599 $30,000 to $34,9991,010 $35,000 to $39,999548 $40,000 to $44,999394 $45,000 to $49,999878 $50,000 to $59,9991,773 $60,000 to $74,9992,343 $75,000 to $99,9992,086 $100,000 to $124,999919 $125,000 to $149,9991,725 $150,000 to $199,9991,092 $200,000 or moreEstimate of home value of owner-occupied houses/condos in 2022 in zip code 79762 55 Less than $10,00046 $10,000 to $14,99984 $15,000 to $19,99928 $20,000 to $24,99915 $25,000 to $29,9999 $30,000 to $34,99945 $40,000 to $49,99975 $50,000 to $59,99951 $60,000 to $69,99967 $70,000 to $79,99995 $80,000 to $89,999117 $90,000 to $99,999625 $100,000 to $124,999450 $125,000 to $149,999814 $150,000 to $174,999898 $175,000 to $199,9991,699 $200,000 to $249,9991,120 $250,000 to $299,9991,218 $300,000 to $399,999540 $400,000 to $499,999330 $500,000 to $749,999129 $750,000 to $999,99942 $1,000,000 to $1,499,99912 $1,500,000 to $1,999,999Rent paid by renters in 2022 in zip code 79762 43 $100 to $14925 $150 to $1996 $250 to $29971 $350 to $39918 $400 to $4493 $450 to $499113 $500 to $54923 $550 to $599111 $600 to $64986 $650 to $699221 $700 to $749341 $750 to $799458 $800 to $899573 $900 to $9992,575 $1,000 to $1,249895 $1,250 to $1,499841 $1,500 to $1,999130 $2,000 to $2,49945 $2,500 to $2,99915 $3,500 or more233 No cash rent
Median gross rent in 2022: $1,363.
Median price asked for vacant for-sale houses and condos in 2022: $319,657.
Estimated median house (or condo) value in 2022 for: White Non-Hispanic householders: $269,039Black or African American householders: $175,068American Indian or Alaska Native householders: $275,475Asian householders: $321,817Some other race householders: $166,916Two or more races householders: $186,225Hispanic or Latino householders: $171,635Estimated median house or condo value in 2022: $241,149
79762:
$241,149Texas:
$275,400
Lower value quartile - upper value quartile: $176,338 - $320,423
Mean price in 2022: Detached houses: $273,386Here:
$273,386State:
$369,058
Townhouses or other attached units: $208,481Here:
$208,481State:
$327,631
In 2-unit structures: $210,250Here:
$210,250State:
$374,947
In 5-or-more-unit structures: $172,648Here:
$172,648State:
$413,944
Mobile homes: $121,852Here:
$121,852State:
$124,413
Housing units in structures:
One, detached: 10,335One, attached: 552Two: 3003 or 4: 8655 to 9: 1,76110 to 19: 1,61320 to 49: 38550 or more: 1,143Mobile homes: 607Unemployment : 4.8%
Means of transportation to work in zip code 79762 77.4% 15,847 Drove a car alone11.8% 2,407 Carpooled0.2% 51 Bus or trolley bus0.4% 74 Taxi0.0% 7 Motorcycle0.2% 35 Bicycle1.8% 362 Walked0.3% 54 Other means5.6% 1,139 Worked at homeTravel time to work (commute) in zip code 79762 395 Less than 5 minutes1,954 5 to 9 minutes3,809 10 to 14 minutes4,026 15 to 19 minutes3,740 20 to 24 minutes463 25 to 29 minutes1,852 30 to 34 minutes85 35 to 39 minutes308 40 to 44 minutes685 45 to 59 minutes634 60 to 89 minutes886 90 or more minutes
Percentage of zip code residents living and working in this county: 73.5%
Household type by relationship:
Households: 40,714
Male householders: 7,399 (2,054 living alone ), Female householders: 8,744 (2,110 living alone )7,338 spouses (7,166 opposite-sex spouses ), 2,078 unmarried partners , (1,793 opposite-sex unmarried partners ), 13,008 children (11,680 natural , 429 adopted , 903 stepchildren ), 729 grandchildren , 464 brothers or sisters , 102 parents , 10 foster children , 496 other relatives , 515 non-relatives In group quarters: 148 (-1 institutionalized population )
Size of family households: 3,935 2-persons , 2,779 3-persons , 2,012 4-persons , 1,151 5-persons , 420 6-persons , 232 7-or-more-persons
Size of nonfamily households: 4,164 1-person , 1,331 2-persons , 131 3-persons
6,905 married couples with children. single-parent households (474 men , 2,945 women ).
65.9% of residents of 79762 zip code speak English at home. of residents speak Spanish at home (74% very well, 16% well, 7% not well, 3% not at all ).of residents speak other Indo-European language at home (85% very well, 15% well ).of residents speak Asian or Pacific Island language at home (70% very well, 24% well, 5% not well ).of residents speak other language at home (100% very well ).
Foreign born population: 4,522 (11.1%)
(42.8%
of them are naturalized citizens )
This zip code:
11.1%Whole state:
17.2%
52% Honduras 20% Barbados 4% Malaysia 3% Syria 3% Democratic Republic of Congo (Zaire) 2% Iran 2% Costa Rica 7% American 6% English 3% German 3% Irish 1% European 1% Scottish 1% Italian
Year of entry for the foreign-born population
2,449 2010 or later 678 2000 to 2009 754 1990 to 1999 1,147 Before 1990
There are
123 Medical Specialists in Zip Code 79762 .
Facilities with environmental interests located in this zip code:
ART CLEANERS INC (4607 OAKWOOD & 1813 W COUNTY ROAD in ODESSA, TX)
(Resource Conservation and Recovery Act (tracking hazardous waste)) Alternative names: ART ONE HOUR CLEANERS
Housing units lacking complete plumbing facilities: 1.4%
Housing units lacking complete kitchen facilities: 1.9%
60.0% Electricity 39.3% Utility gas 0.6% Bottled, tank, or LP gas
Population in 1990: 34,327. Population change in the 1990s: +1,681 (+4.9%).
Place of birth for U.S.-born residents:
This state: 27,557Northeast: 444Midwest: 1,532South: 2,080West: 4,217
53% of the 79762 zip code residents lived in the same house 5 years ago.
Out of people who lived in different houses, 68% lived in this county.
Out of people who lived in different counties, 50% lived in Texas.
87% of the 79762 zip code residents lived in the same house 1 year ago.
Out of people who lived in different houses, 35% moved from this county.
Out of people who lived in different houses, 35% moved from different county within same state.
Out of people who lived in different houses, 26% moved from different state.
Out of people who lived in different houses, 8% moved from abroad.
Private vs. public school enrollment:
Students in private schools in grades 1 to 8 (elementary and middle school): 319
Students in private schools in grades 9 to 12 (high school): 92
Students in private undergraduate colleges: 275
Occupation by median earnings in the past 12 months ($)
130,953 Architecture and engineering occupations 85,578 Management occupations 73,130 Health diagnosing and treating practitioners and other technical occupations 67,401 Law enforcement workers including supervisors 61,731 Installation, maintenance, and repair occupations 61,384 Legal occupations
Companies with federal contracts located in this zip code:
REGISTER, RON (310 S LARK AVE in ODESSA, TX; small business) in 3 contracts from 2005 to 2006
$4,995 with Air Force for Maintenance, Repair and Rebuilding of Equipment -- Construction, Mining, Excavating, and Highway Maintenance Equipment. Signed on 2005-09-26. Completion date: 2005-11-07.
, same as above. Signed on 2006-01-04. Completion date: 2006-06-27.
, same as above. Signed on 2005-11-04. Completion date: 2006-04-23.
Top industries in this zip code by the number of employees in 2005:
Accommodation and Food Services: Full-Service Restaurants (100-249 employees: 2 establishments, 50-99 employees: 8 establishments, 20-49 employees: 4 establishments, 10-19 employees: 6 establishments, 1-4 employees: 5 establishments)Accommodation and Food Services: Limited-Service Restaurants (50-99: 3, 20-49: 16, 10-19: 12, 5-9: 3, 1-4: 4)Construction: Oil and Gas Pipeline and Related Structures Construction (250-499: 2, 50-99: 1, 1-4: 1)Administrative and Support and Waste Management and Remediation Services: Temporary Help Services (100-249: 2, 50-99: 1, 20-49: 3, 5-9: 1)Accommodation and Food Services: Drinking Places (Alcoholic Beverages) (50-99: 1, 20-49: 3, 10-19: 2, 5-9: 2, 1-4: 1)Information: Wired Telecommunications Carriers (100-249: 1, 20-49: 1, 5-9: 2)Accommodation and Food Services: Hotels (except Casino Hotels) and Motels (50-99: 2, 20-49: 1, 10-19: 1, 1-4: 1)
People in group quarters in 2010:
495 people in college/university student housing
99 people in nursing facilities/skilled-nursing facilities
4 people in group homes intended for adults
People in group quarters in 2000:
93 people in nursing homes
74 people in college dormitories (includes college quarters off campus)
17 people in homes for the mentally retarded
Fatal accident statistics in 2014:
Fatal accident count: 13Vehicles involved in fatal accidents: 21Fatal accidents caused by drunken drivers: 4Fatalities: 13Persons involved in fatal accidents: 33Pedestrians involved in fatal accidents: 3
Fatal accident statistics in 2013:
Fatal accident count: 12Vehicles involved in fatal accidents: 21Fatal accidents caused by drunken drivers: 5Fatalities: 14Persons involved in fatal accidents: 53Pedestrians involved in fatal accidents: 4
Home Mortgage Disclosure Act Aggregated Statistics For Year 2009(Based on 14 full and 2 partial tracts) A) FHA, FSA/RHS & VA B) Conventional C) Refinancings D) Home Improvement Loans E) Loans on Dwellings For 5+ Families F) Non-occupant Loans on G) Loans On Manufactured Number Average Value Number Average Value Number Average Value Number Average Value Number Average Value Number Average Value Number Average Value
LOANS ORIGINATED 409 $125,500 203 $125,276 616 $122,501 92 $46,580 4 $1,428,412 87 $95,103 8 $47,740 APPLICATIONS APPROVED, NOT ACCEPTED 20 $95,954 12 $109,147 64 $100,230 11 $51,551 2 $1,678,490 6 $95,890 6 $51,090 APPLICATIONS DENIED 35 $104,229 61 $99,220 314 $118,276 151 $29,527 0 $0 24 $52,102 16 $57,184 APPLICATIONS WITHDRAWN 29 $123,199 8 $108,108 112 $105,215 26 $73,179 0 $0 14 $74,412 3 $44,967 FILES CLOSED FOR INCOMPLETENESS 8 $79,396 2 $39,950 45 $102,642 13 $43,318 0 $0 2 $99,570 0 $0
Aggregated Statistics For Year 2008(Based on 14 full and 2 partial tracts) A) FHA, FSA/RHS & VA B) Conventional C) Refinancings D) Home Improvement Loans E) Loans on Dwellings For 5+ Families F) Non-occupant Loans on G) Loans On Manufactured Number Average Value Number Average Value Number Average Value Number Average Value Number Average Value Number Average Value Number Average Value
LOANS ORIGINATED 428 $119,916 455 $113,358 454 $102,786 161 $42,900 0 $0 133 $105,412 36 $60,846 APPLICATIONS APPROVED, NOT ACCEPTED 20 $120,280 56 $88,098 55 $87,253 25 $34,350 0 $0 10 $89,480 32 $51,287 APPLICATIONS DENIED 67 $107,661 114 $79,695 310 $85,000 271 $37,973 2 $1,248,875 21 $50,592 58 $58,558 APPLICATIONS WITHDRAWN 29 $128,150 42 $115,609 124 $95,497 42 $49,906 0 $0 7 $43,336 1 $41,000 FILES CLOSED FOR INCOMPLETENESS 13 $122,718 18 $152,789 49 $79,809 13 $58,398 0 $0 2 $49,955 0 $0
Aggregated Statistics For Year 2007(Based on 14 full and 2 partial tracts) A) FHA, FSA/RHS & VA B) Conventional C) Refinancings D) Home Improvement Loans E) Loans on Dwellings For 5+ Families F) Non-occupant Loans on G) Loans On Manufactured Number Average Value Number Average Value Number Average Value Number Average Value Number Average Value Number Average Value Number Average Value
LOANS ORIGINATED 124 $114,201 953 $103,372 445 $84,805 183 $41,373 3 $6,700,527 150 $66,805 33 $54,344 APPLICATIONS APPROVED, NOT ACCEPTED 6 $124,520 125 $97,281 69 $100,713 18 $37,527 0 $0 12 $47,244 32 $60,387 APPLICATIONS DENIED 20 $81,627 259 $84,004 462 $76,765 305 $32,888 6 $4,934,555 45 $45,498 95 $53,743 APPLICATIONS WITHDRAWN 17 $116,794 70 $87,119 193 $86,846 50 $52,592 0 $0 24 $52,788 10 $50,497 FILES CLOSED FOR INCOMPLETENESS 0 $0 29 $105,386 63 $102,822 17 $28,679 0 $0 6 $67,947 0 $0
Aggregated Statistics For Year 2006(Based on 14 full and 2 partial tracts) A) FHA, FSA/RHS & VA B) Conventional C) Refinancings D) Home Improvement Loans E) Loans on Dwellings For 5+ Families F) Non-occupant Loans on G) Loans On Manufactured Number Average Value Number Average Value Number Average Value Number Average Value Number Average Value Number Average Value Number Average Value
LOANS ORIGINATED 133 $88,722 1,152 $79,691 421 $74,278 120 $35,798 1 $5,229,000 205 $62,191 16 $39,357 APPLICATIONS APPROVED, NOT ACCEPTED 9 $52,519 113 $60,049 62 $69,089 25 $32,130 0 $0 11 $86,918 19 $51,775 APPLICATIONS DENIED 16 $68,562 290 $61,640 432 $61,563 262 $28,733 0 $0 34 $41,131 73 $38,233 APPLICATIONS WITHDRAWN 4 $51,350 96 $71,454 268 $83,309 41 $42,273 4 $3,830,285 7 $74,660 1 $17,000 FILES CLOSED FOR INCOMPLETENESS 0 $0 14 $129,124 74 $82,999 6 $49,315 0 $0 2 $64,940 0 $0
Aggregated Statistics For Year 2005(Based on 14 full and 2 partial tracts) A) FHA, FSA/RHS & VA B) Conventional C) Refinancings D) Home Improvement Loans E) Loans on Dwellings For 5+ Families F) Non-occupant Loans on G) Loans On Manufactured Number Average Value Number Average Value Number Average Value Number Average Value Number Average Value Number Average Value Number Average Value
LOANS ORIGINATED 187 $81,904 1,027 $66,092 441 $68,688 121 $41,060 9 $318,772 205 $49,083 13 $49,716 APPLICATIONS APPROVED, NOT ACCEPTED 3 $89,300 79 $56,052 71 $63,366 29 $36,134 0 $0 16 $45,035 14 $51,522 APPLICATIONS DENIED 9 $67,048 242 $97,078 538 $60,437 211 $29,000 0 $0 42 $37,105 111 $38,252 APPLICATIONS WITHDRAWN 17 $86,094 126 $96,380 300 $81,276 73 $182,571 2 $298,710 38 $144,405 15 $31,482 FILES CLOSED FOR INCOMPLETENESS 3 $59,960 29 $81,479 109 $91,710 6 $5,977 0 $0 2 $59,740 0 $0
Aggregated Statistics For Year 2004(Based on 14 full and 2 partial tracts) A) FHA, FSA/RHS & VA B) Conventional C) Refinancings D) Home Improvement Loans E) Loans on Dwellings For 5+ Families F) Non-occupant Loans on G) Loans On Manufactured Number Average Value Number Average Value Number Average Value Number Average Value Number Average Value Number Average Value Number Average Value
LOANS ORIGINATED 247 $69,707 719 $68,627 582 $60,359 110 $30,875 4 $1,158,112 168 $49,840 25 $34,935 APPLICATIONS APPROVED, NOT ACCEPTED 7 $54,666 70 $70,785 82 $63,180 13 $18,016 0 $0 11 $34,544 32 $34,566 APPLICATIONS DENIED 31 $70,127 215 $55,785 521 $51,679 189 $25,205 0 $0 25 $51,092 107 $38,440 APPLICATIONS WITHDRAWN 14 $79,749 75 $57,870 310 $68,132 32 $35,270 0 $0 19 $48,596 1 $54,000 FILES CLOSED FOR INCOMPLETENESS 7 $59,816 14 $99,382 69 $78,018 5 $44,240 0 $0 0 $0 0 $0
Aggregated Statistics For Year 2003(Based on 14 full and 2 partial tracts) A) FHA, FSA/RHS & VA B) Conventional C) Refinancings D) Home Improvement Loans E) Loans on Dwellings For 5+ Families F) Non-occupant Loans on Number Average Value Number Average Value Number Average Value Number Average Value Number Average Value Number Average Value
LOANS ORIGINATED 237 $71,514 599 $67,824 1,149 $65,126 101 $21,974 8 $427,151 152 $44,798 APPLICATIONS APPROVED, NOT ACCEPTED 19 $61,133 39 $63,467 103 $65,932 9 $18,027 0 $0 15 $25,657 APPLICATIONS DENIED 22 $55,960 183 $46,703 560 $56,542 89 $18,721 0 $0 33 $38,337 APPLICATIONS WITHDRAWN 18 $58,309 38 $85,623 363 $66,251 11 $15,118 0 $0 1 $50,000 FILES CLOSED FOR INCOMPLETENESS 8 $49,440 9 $190,981 44 $86,206 3 $88,960 0 $0 2 $68,705
Aggregated Statistics For Year 2002(Based on 14 full and 2 partial tracts) A) FHA, FSA/RHS & VA B) Conventional C) Refinancings D) Home Improvement Loans E) Loans on Dwellings For 5+ Families F) Non-occupant Loans on Number Average Value Number Average Value Number Average Value Number Average Value Number Average Value Number Average Value
LOANS ORIGINATED 348 $61,598 460 $68,507 655 $68,020 76 $19,198 3 $2,815,447 104 $36,358 APPLICATIONS APPROVED, NOT ACCEPTED 18 $48,403 48 $54,496 128 $49,983 19 $24,809 0 $0 15 $35,429 APPLICATIONS DENIED 35 $49,044 168 $46,428 293 $49,226 94 $17,945 0 $0 24 $44,942 APPLICATIONS WITHDRAWN 16 $92,468 37 $68,248 172 $54,843 3 $17,160 0 $0 9 $54,654 FILES CLOSED FOR INCOMPLETENESS 14 $66,130 14 $58,060 50 $61,491 0 $0 0 $0 6 $31,155
Aggregated Statistics For Year 2001(Based on 14 full and 2 partial tracts) A) FHA, FSA/RHS & VA B) Conventional C) Refinancings D) Home Improvement Loans E) Loans on Dwellings For 5+ Families F) Non-occupant Loans on Number Average Value Number Average Value Number Average Value Number Average Value Number Average Value Number Average Value
LOANS ORIGINATED 348 $57,991 453 $66,889 433 $51,293 106 $13,761 1 $3,280,000 83 $35,868 APPLICATIONS APPROVED, NOT ACCEPTED 12 $50,922 82 $44,405 78 $49,293 17 $20,371 0 $0 7 $36,193 APPLICATIONS DENIED 15 $57,965 257 $40,635 200 $37,684 82 $10,316 2 $82,091,790 18 $29,001 APPLICATIONS WITHDRAWN 26 $60,388 35 $54,051 176 $42,864 22 $12,579 0 $0 13 $32,679 FILES CLOSED FOR INCOMPLETENESS 14 $58,275 3 $200,317 38 $60,533 0 $0 0 $0 0 $0
Aggregated Statistics For Year 2000(Based on 14 full and 2 partial tracts) A) FHA, FSA/RHS & VA B) Conventional C) Refinancings D) Home Improvement Loans E) Loans on Dwellings For 5+ Families F) Non-occupant Loans on Number Average Value Number Average Value Number Average Value Number Average Value Number Average Value Number Average Value
LOANS ORIGINATED 295 $58,232 328 $63,170 197 $44,058 93 $16,075 3 $609,637 30 $27,439 APPLICATIONS APPROVED, NOT ACCEPTED 19 $44,758 75 $51,308 40 $39,673 20 $16,692 0 $0 9 $38,669 APPLICATIONS DENIED 39 $50,531 239 $38,631 143 $39,795 60 $21,582 2 $3,099,690 24 $46,142 APPLICATIONS WITHDRAWN 20 $62,022 51 $65,802 98 $47,421 8 $14,150 0 $0 0 $0 FILES CLOSED FOR INCOMPLETENESS 10 $54,079 10 $53,331 31 $42,441 0 $0 0 $0 0 $0
Aggregated Statistics For Year 1999(Based on 8 full and 1 partial tracts) A) FHA, FSA/RHS & VA B) Conventional C) Refinancings D) Home Improvement Loans E) Loans on Dwellings For 5+ Families F) Non-occupant Loans on Number Average Value Number Average Value Number Average Value Number Average Value Number Average Value Number Average Value
LOANS ORIGINATED 168 $57,606 192 $55,620 223 $54,315 101 $23,509 1 $158,000 37 $39,802 APPLICATIONS APPROVED, NOT ACCEPTED 5 $55,498 54 $53,616 47 $45,427 17 $17,384 0 $0 8 $30,688 APPLICATIONS DENIED 20 $50,120 274 $40,376 94 $43,453 80 $13,000 1 $2,000,000 23 $39,377 APPLICATIONS WITHDRAWN 12 $44,272 23 $46,528 82 $42,970 9 $8,728 1 $1,377,000 4 $26,900 FILES CLOSED FOR INCOMPLETENESS 2 $39,195 8 $146,345 21 $52,849 1 $15,000 0 $0 2 $33,790
Private Mortgage Insurance Companies Aggregated Statistics For Year 2009(Based on 14 full tracts) A) Conventional B) Refinancings Number Average Value Number Average Value
LOANS ORIGINATED 36 $123,346 14 $148,891 APPLICATIONS APPROVED, NOT ACCEPTED 14 $172,311 8 $125,695 APPLICATIONS DENIED 6 $103,073 4 $111,242 APPLICATIONS WITHDRAWN 4 $146,740 0 $0 FILES CLOSED FOR INCOMPLETENESS 2 $68,910 0 $0
Aggregated Statistics For Year 2008(Based on 14 full and 2 partial tracts) A) Conventional B) Refinancings C) Non-occupant Loans on Number Average Value Number Average Value Number Average Value
LOANS ORIGINATED 184 $124,955 16 $157,679 12 $97,317 APPLICATIONS APPROVED, NOT ACCEPTED 28 $120,234 1 $134,000 2 $80,545 APPLICATIONS DENIED 17 $74,679 0 $0 5 $87,314 APPLICATIONS WITHDRAWN 4 $145,772 0 $0 0 $0 FILES CLOSED FOR INCOMPLETENESS 8 $68,844 0 $0 0 $0
Aggregated Statistics For Year 2007(Based on 14 full and 2 partial tracts) A) Conventional B) Refinancings C) Non-occupant Loans on Number Average Value Number Average Value Number Average Value
LOANS ORIGINATED 424 $110,136 8 $86,604 16 $108,402 APPLICATIONS APPROVED, NOT ACCEPTED 65 $103,367 2 $76,930 4 $65,302 APPLICATIONS DENIED 9 $173,097 2 $53,950 4 $103,992 APPLICATIONS WITHDRAWN 18 $122,409 0 $0 0 $0 FILES CLOSED FOR INCOMPLETENESS 0 $0 1 $136,000 0 $0
Aggregated Statistics For Year 2006(Based on 14 full and 2 partial tracts) A) Conventional B) Refinancings C) Non-occupant Loans on Number Average Value Number Average Value Number Average Value
LOANS ORIGINATED 287 $91,165 14 $69,347 31 $62,664 APPLICATIONS APPROVED, NOT ACCEPTED 34 $82,487 12 $86,051 3 $62,663 APPLICATIONS DENIED 0 $0 0 $0 0 $0 APPLICATIONS WITHDRAWN 14 $97,904 0 $0 0 $0 FILES CLOSED FOR INCOMPLETENESS 1 $58,000 0 $0 1 $58,000
Aggregated Statistics For Year 2005(Based on 12 full and 2 partial tracts) A) Conventional B) Refinancings C) Non-occupant Loans on Number Average Value Number Average Value Number Average Value
LOANS ORIGINATED 266 $80,844 17 $73,101 39 $64,058 APPLICATIONS APPROVED, NOT ACCEPTED 13 $93,875 2 $107,500 0 $0 APPLICATIONS DENIED 0 $0 0 $0 0 $0 APPLICATIONS WITHDRAWN 12 $87,147 0 $0 3 $95,660 FILES CLOSED FOR INCOMPLETENESS 0 $0 0 $0 0 $0
Aggregated Statistics For Year 2004(Based on 14 full and 2 partial tracts) A) Conventional B) Refinancings C) Non-occupant Loans on Number Average Value Number Average Value Number Average Value
LOANS ORIGINATED 182 $79,222 42 $78,423 29 $59,276 APPLICATIONS APPROVED, NOT ACCEPTED 19 $72,996 3 $99,930 1 $30,000 APPLICATIONS DENIED 2 $49,785 2 $49,785 0 $0 APPLICATIONS WITHDRAWN 7 $83,600 4 $109,818 2 $71,690 FILES CLOSED FOR INCOMPLETENESS 3 $82,090 0 $0 0 $0
Aggregated Statistics For Year 2003(Based on 14 full and 2 partial tracts) A) Conventional B) Refinancings C) Non-occupant Loans on Number Average Value Number Average Value Number Average Value
LOANS ORIGINATED 141 $76,240 130 $84,300 18 $48,952 APPLICATIONS APPROVED, NOT ACCEPTED 29 $74,779 29 $79,286 11 $38,954 APPLICATIONS DENIED 2 $117,500 0 $0 0 $0 APPLICATIONS WITHDRAWN 9 $108,741 5 $110,980 0 $0 FILES CLOSED FOR INCOMPLETENESS 0 $0 0 $0 0 $0
Aggregated Statistics For Year 2002(Based on 14 full and 2 partial tracts) A) Conventional B) Refinancings C) Non-occupant Loans on Number Average Value Number Average Value Number Average Value
LOANS ORIGINATED 145 $77,025 63 $86,859 11 $38,389 APPLICATIONS APPROVED, NOT ACCEPTED 10 $58,853 7 $66,033 0 $0 APPLICATIONS DENIED 0 $0 0 $0 0 $0 APPLICATIONS WITHDRAWN 3 $88,067 2 $88,990 0 $0 FILES CLOSED FOR INCOMPLETENESS 2 $78,560 0 $0 0 $0
Aggregated Statistics For Year 2001(Based on 12 full tracts) A) Conventional B) Refinancings C) Non-occupant Loans on Number Average Value Number Average Value Number Average Value
LOANS ORIGINATED 106 $80,767 19 $82,959 10 $37,108 APPLICATIONS APPROVED, NOT ACCEPTED 18 $56,737 4 $73,492 2 $46,960 APPLICATIONS DENIED 2 $149,985 0 $0 0 $0 APPLICATIONS WITHDRAWN 0 $0 0 $0 0 $0 FILES CLOSED FOR INCOMPLETENESS 0 $0 0 $0 0 $0
Aggregated Statistics For Year 2000(Based on 14 full and 2 partial tracts) A) Conventional B) Refinancings C) Non-occupant Loans on Number Average Value Number Average Value Number Average Value
LOANS ORIGINATED 82 $71,364 6 $92,713 2 $31,970 APPLICATIONS APPROVED, NOT ACCEPTED 8 $70,099 1 $33,000 1 $33,000 APPLICATIONS DENIED 2 $62,645 2 $130,985 0 $0 APPLICATIONS WITHDRAWN 0 $0 0 $0 0 $0 FILES CLOSED FOR INCOMPLETENESS 0 $0 0 $0 0 $0
Aggregated Statistics For Year 1999(Based on 7 full and 1 partial tracts) A) Conventional B) Refinancings C) Non-occupant Loans on Number Average Value Number Average Value Number Average Value
LOANS ORIGINATED 55 $72,412 14 $70,616 5 $36,378 APPLICATIONS APPROVED, NOT ACCEPTED 1 $63,730 4 $50,948 0 $0 APPLICATIONS DENIED 0 $0 0 $0 0 $0 APPLICATIONS WITHDRAWN 1 $60,790 0 $0 0 $0 FILES CLOSED FOR INCOMPLETENESS 1 $74,000 1 $63,730 1 $63,730
2002 - 2018 National Fire Incident Reporting System (NFIRS) incidents See full 2006 National Fire Incident Reporting System statistics for zip code 79762, Texas
Most common first names in zip code 79762 among deceased individuals Name Count Lived (average)
James 170 71.4 years William 143 70.8 years Mary 137 77.4 years John 126 74.1 years Robert 97 68.6 years Charles 95 70.5 years Dorothy 72 74.0 years George 56 73.6 years Thomas 47 69.4 years Jack 46 70.9 years
Most common last names in zip code 79762 among deceased individuals Last name Count Lived (average)
Smith 94 71.6 years Jones 59 75.5 years Johnson 53 77.1 years Brown 51 76.4 years Davis 44 76.7 years Miller 42 71.5 years Williams 37 75.4 years Wilson 36 74.1 years Moore 29 74.8 years White 29 72.5 years
Businesses in zip code 79762
Name Count Name Count
7-Eleven 12 MasterBrand Cabinets 2 AT&T 1 Maurices 1 Academy Sports + Outdoors 1 Mazda 1 Ace Hardware 1 McDonald's 2 Advance Auto Parts 1 New Balance 2 Albertsons 1 Nike 2 Arby's 1 Nissan 1 AutoZone 1 Office Depot 1 Bath & Body Works 1 Pac Sun 1 Blockbuster 1 Payless 2 Burger King 1 Penske 1 Chevrolet 1 PetSmart 1 Chick-Fil-A 1 Pizza Hut 2 Church's Chicken 1 RadioShack 1 Cinnabon 1 Red Lobster 1 Discount Tire 1 Rue21 1 Domino's Pizza 1 SONIC Drive-In 3 Express 1 Sam's Club 1 FedEx 5 Sears 2 Finish Line 1 Spencer Gifts 1 Foot Locker 1 Sprint Nextel 1 GNC 1 Staples 1 GameStop 2 Starbucks 1 H&R Block 2 Subway 5 Hilton 1 T-Mobile 2 Hobby Lobby 1 Taco Bell 1 Holiday Inn 2 Target 1 Home Depot 1 Toyota 1 Honda 1 Toys"R"Us 1 IHOP 1 U-Haul 4 JCPenney 1 UPS 8 Jack In The Box 1 Vans 1 Jones New York 2 Verizon Wireless 1 Journeys 1 Walgreens 1 La-Z-Boy 1 Walmart 1 Lane Furniture 3 Wendy's 1 Long John Silver's 1 World Gym 1 Lowe's 1 YMCA 1 Marriott 2

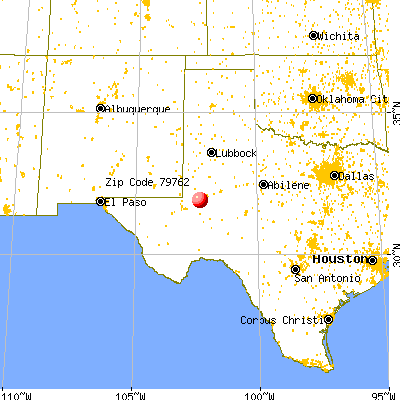


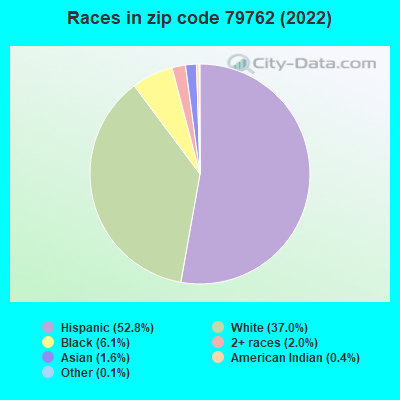


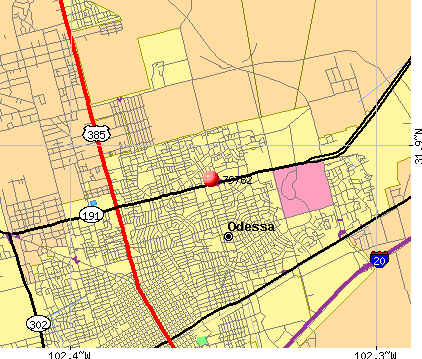 Nearest zip codes: 79758, 79761, 79765, 79763, 79764, 79707.
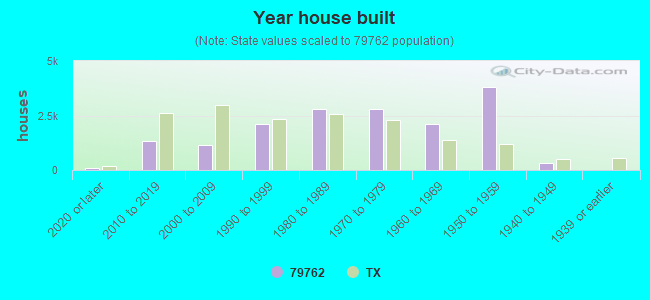

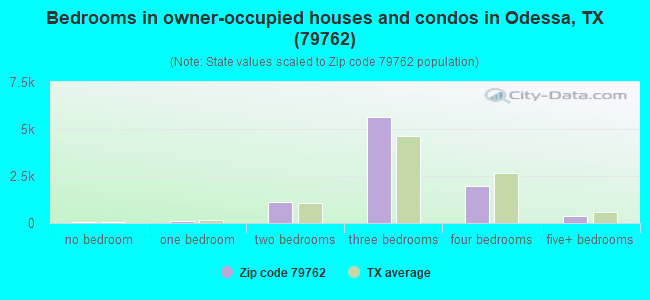
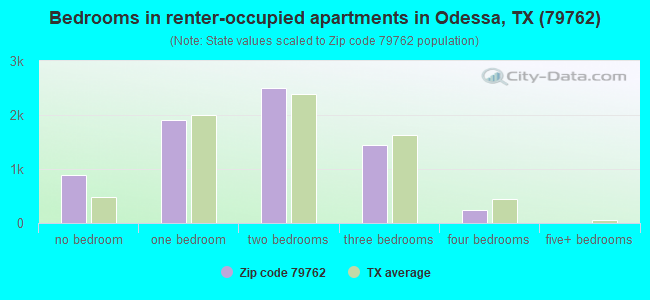
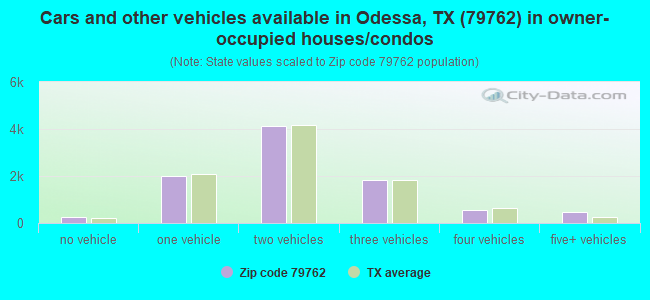
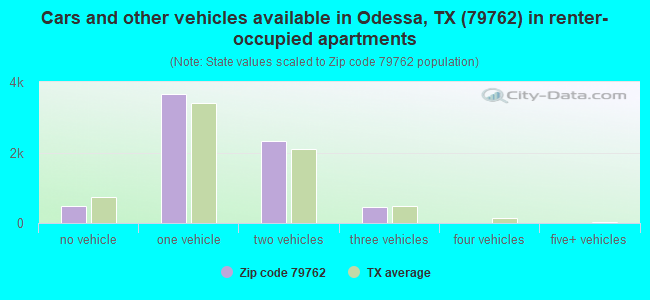


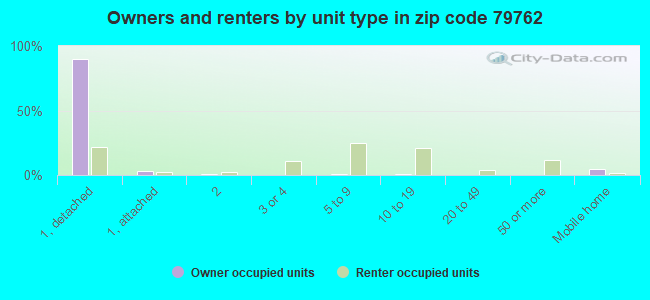
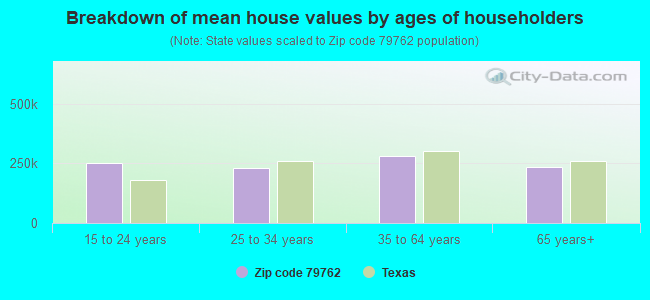


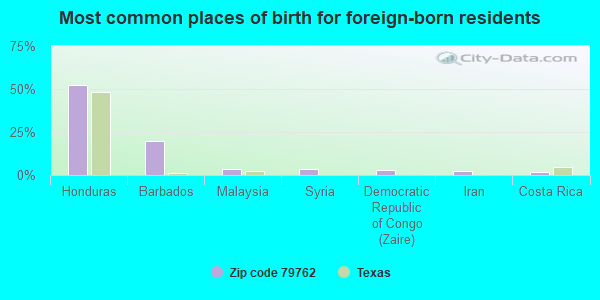
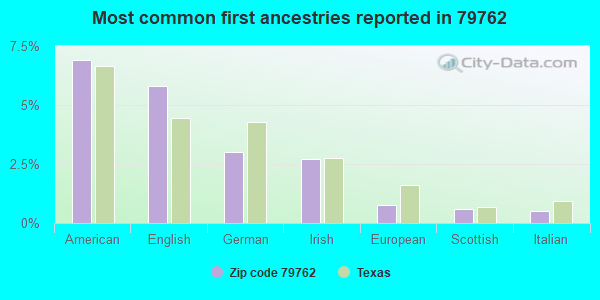
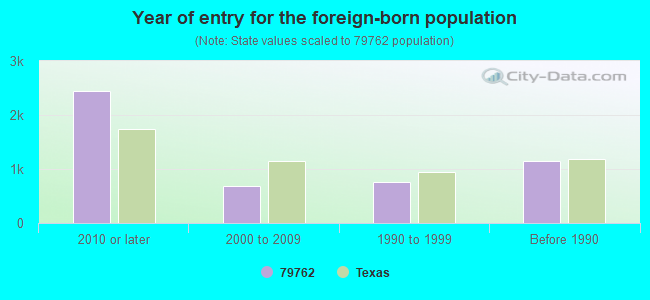


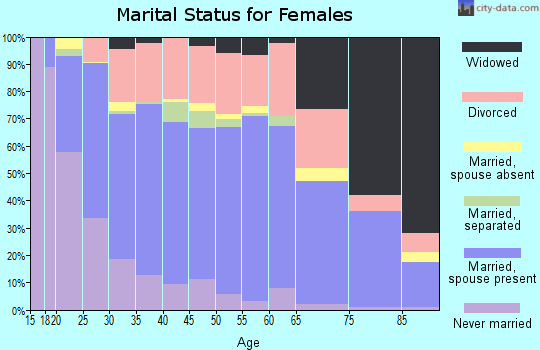
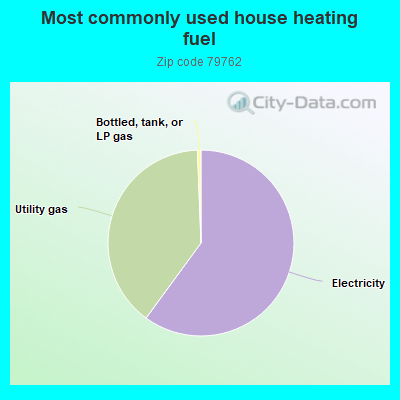
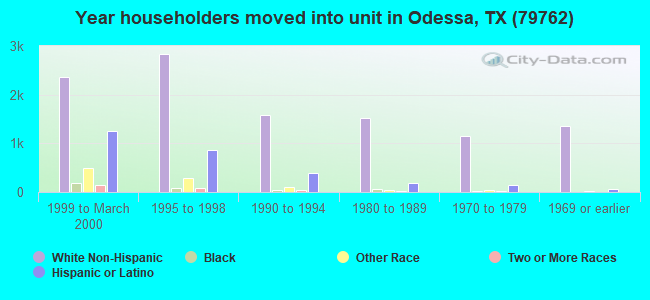
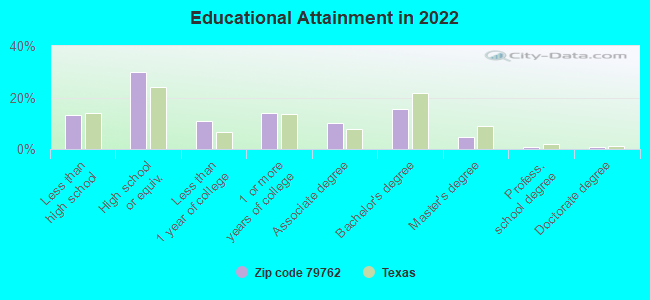
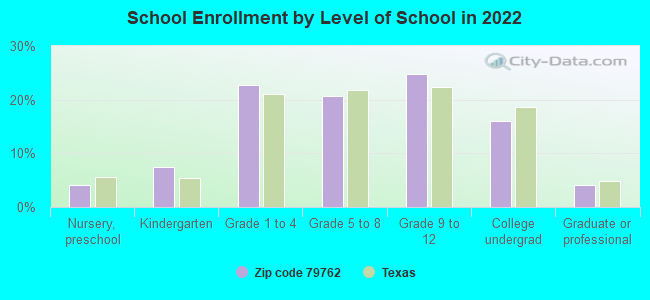
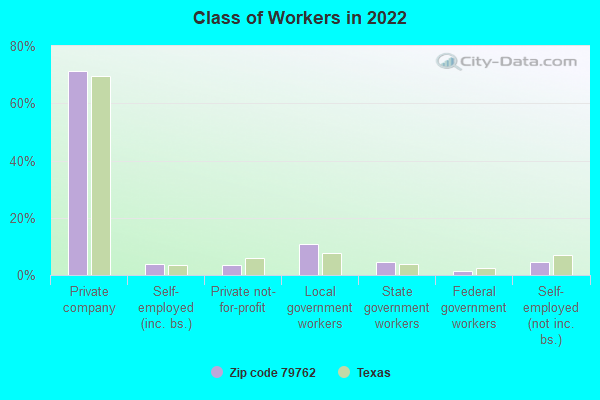
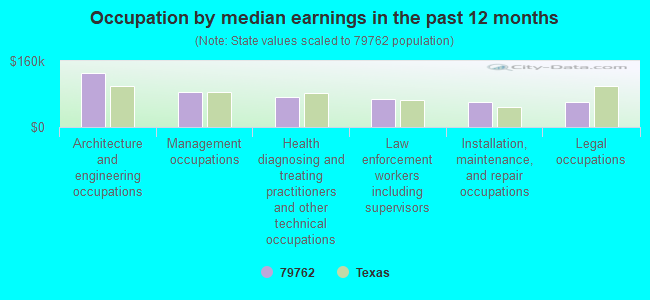
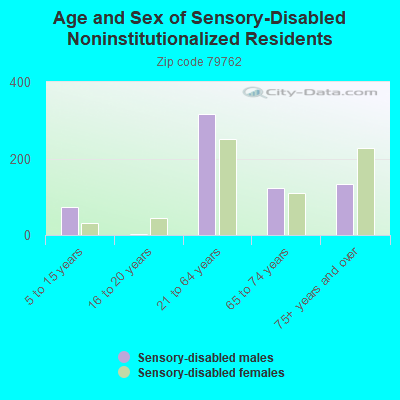
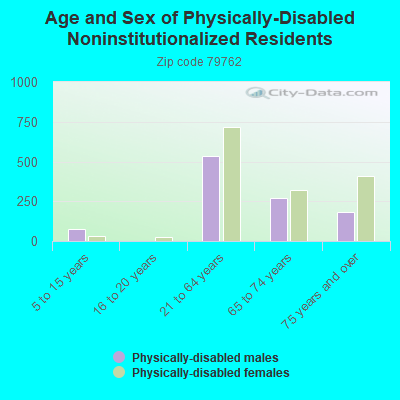
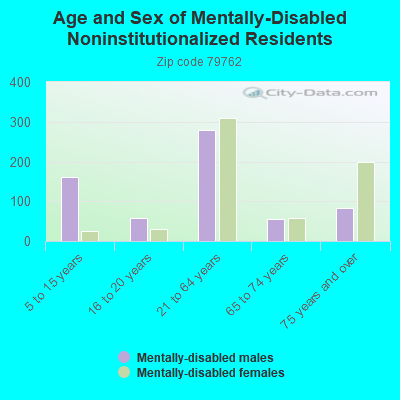
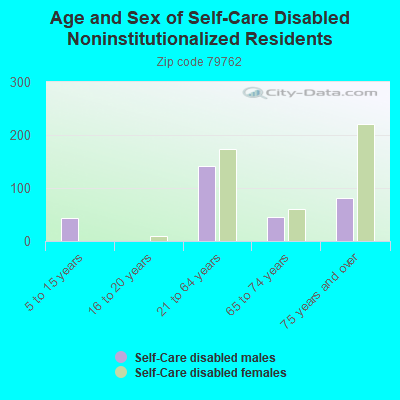
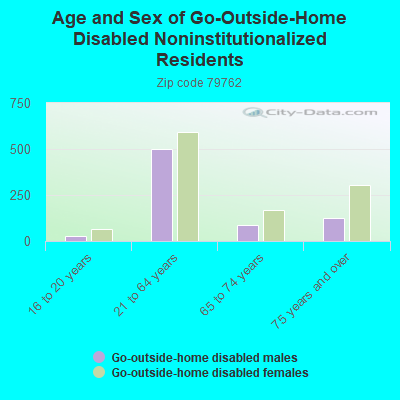
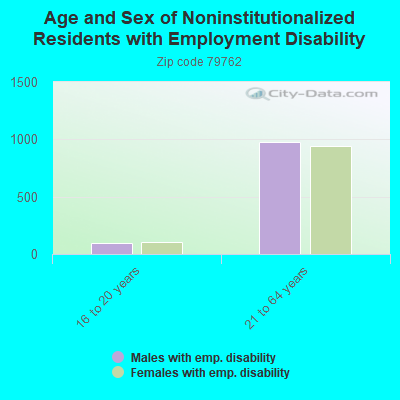
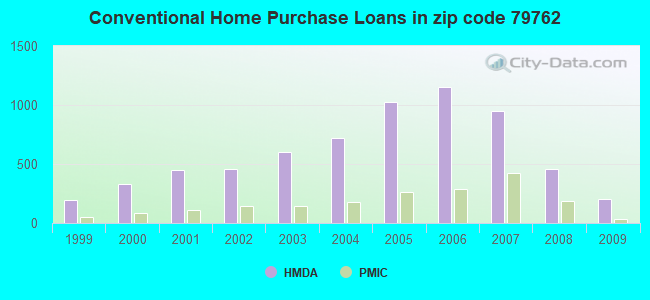
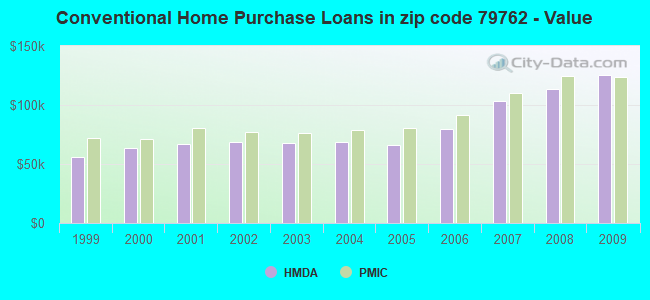
 According to the data from the years 2002 - 2018 the average number of fires per year is 146. The highest number of fire incidents - 236 took place in 2006, and the least - 28 in 2002. The data has a growing trend.
 When looking into fire subcategories, the most reports belonged to: Outside Fires (48.5%), and Structure Fires (34.5%).