Averages for the 2020 tax year for zip code 80612, filed in 2021:
Average Adjusted Gross Income (AGI) in 2020: $80,941 (Individual Income Tax Returns)
Here:
$80,941
State:
$89,260
Salary/wage: $74,508 (reported on 89.7% of returns)
Here:
$74,508
State:
$70,330
(% of AGI for various income ranges: 1684.0% for AGIs below $25k, 5055.0% for AGIs $25k-50k, 6232.5% for AGIs $50k-75k, 16305.0% for AGIs $75k-100k, 21508.0% for AGIs $100k-200k)
Taxable interest for individuals: $440 (reported on 34.5% of returns)
This zip code:
$440
Colorado:
$2,176
(% of AGI for various income ranges: 6.0% for AGIs below $25k, 15.0% for AGIs $50k-75k, 70.0% for AGIs $100k-200k)
Ordinary dividends: $900 (reported on 13.8% of returns)
Here:
$900
State:
$8,820
(% of AGI for various income ranges: 180.0% for AGIs $75k-100k)
Net capital gain/loss in AGI: +$2,700 (reported on 13.8% of returns)
Here:
+$2,700
State:
+$37,276
(% of AGI for various income ranges: 540.0% for AGIs $75k-100k)
Profit/loss from business: +$6,517 (reported on 20.7% of returns)
Here:
+$6,517
State:
+$15,295
(% of AGI for various income ranges: 645.0% for AGIs $25k-50k, 665.0% for AGIs $75k-100k)
Total itemized deductions: $30,267 (reported on 10.3% of returns)
Here:
$30,267
State:
$35,141
(% of AGI for various income ranges: 1816.0% for AGIs $100k-200k)
Taxes paid: $8,533 (reported on 10.3% of returns)
80612:
$8,533
State:
$7,710
(% of AGI for various income ranges: 512.0% for AGIs $100k-200k)
Earned income credit: $1,650 (reported on 6.9% of returns)
Here:
$1,650
State:
$2,053
(% of AGI for various income ranges: 66.0% for AGIs below $25k)
Percentage of individuals using paid preparers for their 2020 taxes: 96.6%
Here:
97%
State:
93%
(% for various income ranges: 100.0% for AGIs below $25k, 100.0% for AGIs $25k-50k, 100.0% for AGIs $50k-75k, 75.0% for AGIs $75k-100k, 100.0% for AGIs $100k-200k)
Averages for the 2012 tax year for zip code 80612, filed in 2013:
Average Adjusted Gross Income (AGI) in 2012: $56,435 (Individual Income Tax Returns)
Here:
$56,435
State:
$69,103
Salary/wage: $51,971 (reported on 85.0% of returns)
Here:
$51,971
State:
$54,794
(% of AGI for various income ranges: 79.8% for AGIs below $25k, 78.8% for AGIs $25k-50k, 84.2% for AGIs $50k-75k, 82.7% for AGIs $75k-100k, 71.7% for AGIs $100k-200k)
Taxable interest for individuals: $217 (reported on 30.0% of returns)
This zip code:
$217
Colorado:
$1,971
Ordinary dividends: $333 (reported on 15.0% of returns)
Here:
$333
State:
$7,140
Net capital gain/loss in AGI: +$600 (reported on 15.0% of returns)
Here:
+$600
State:
+$23,009
Profit/loss from business: +$7,225 (reported on 20.0% of returns)
Here:
+$7,225
State:
+$13,514
Total itemized deductions: $18,050 (24% of AGI, reported on 50.0% of returns)
Here:
$18,050
State:
$24,621
Here:
24.4% of AGI
State:
18.5% of AGI
(% of AGI for various income ranges: 49.3% for AGIs below $25k, 32.8% for AGIs $50k-75k, 14.1% for AGIs $100k-200k)
Charity contributions: $1,583 (reported on 30.0% of returns)
Here:
$1,583
State:
$4,449
Taxes paid: $4,567 (reported on 45.0% of returns)
80612:
$4,567
State:
$7,641
(% of AGI for various income ranges: 7.3% for AGIs below $25k, 7.3% for AGIs $50k-75k, 4.1% for AGIs $100k-200k)
Earned income credit: $1,667 (reported on 15.0% of returns)
Here:
$1,667
State:
$2,095
(% of AGI for various income ranges: 6.4% for AGIs below $25k)
Percentage of individuals using paid preparers for their 2012 taxes: 55.0%
Here:
55%
State:
49%
(% for various income ranges: 50.0% for AGIs below $25k, 60.0% for AGIs $25k-50k, 50.0% for AGIs $50k-75k, 150.0% for AGIs $75k-100k)
Averages for the 2004 tax year for zip code 80612, filed in 2005:
Average Adjusted Gross Income (AGI) in 2004: $47,801 (Individual Income Tax Returns)
Here:
$47,801
State:
$55,014
Salary/wage: $43,610 (reported on 81.9% of returns)
Here:
$43,610
State:
$46,010
(% of AGI for various income ranges: 61.0% for AGIs $10k-25k, 95.3% for AGIs $25k-50k, 86.8% for AGIs $50k-75k, 83.9% for AGIs $75k-100k, 45.6% for AGIs over 100k)
Taxable interest for individuals: $475 (reported on 35.5% of returns)
This zip code:
$475
Colorado:
$2,127
(% of AGI for various income ranges: 0.4% for AGIs $10k-25k, 0.2% for AGIs $25k-50k, 0.4% for AGIs $50k-75k, 0.6% for AGIs over 100k)
Taxable dividends: $500 (reported on 15.7% of returns)
Here:
$500
State:
$3,782
Net capital gain/loss: +$15,192 (reported on 15.7% of returns)
Here:
+$15,192
State:
+$17,882
Profit/loss from business: +$4,000 (reported on 15.7% of returns)
Here:
+$4,000
State:
+$11,247
Total itemized deductions: $19,197 (31% of AGI, reported on 42.8% of returns)
Here:
$19,197
State:
$20,560
Here:
30.6% of AGI
State:
21.4% of AGI
(% of AGI for various income ranges: 24.9% for AGIs $25k-50k, 19.7% for AGIs $50k-75k, 21.7% for AGIs $75k-100k, 10.8% for AGIs over 100k)
Charity contributions deductions: $1,000 (2% of AGI, reported on 28.9% of returns)
Here:
$1,000
State:
$3,518
Here:
1.5% of AGI
State:
3.4% of AGI
Total tax: $5,170 (reported on 81.3% of returns)
80612:
$5,170
State:
$9,173
(% of AGI for various income ranges: 5.4% for AGIs $10k-25k, 4.9% for AGIs $25k-50k, 8.8% for AGIs $50k-75k, 9.5% for AGIs $75k-100k, 13.2% for AGIs over 100k)
Earned income credit: $2,125 (reported on 9.6% of returns)
Here:
$2,125
State:
$1,595
Percentage of individuals using paid preparers for their 2004 taxes: 64.5%
Here:
64%
State:
55%
(% for various income ranges: 88.4% for AGIs $10k-25k, 64.8% for AGIs $25k-50k, 85.2% for AGIs $50k-75k, 73.3% for AGIs over 100k)
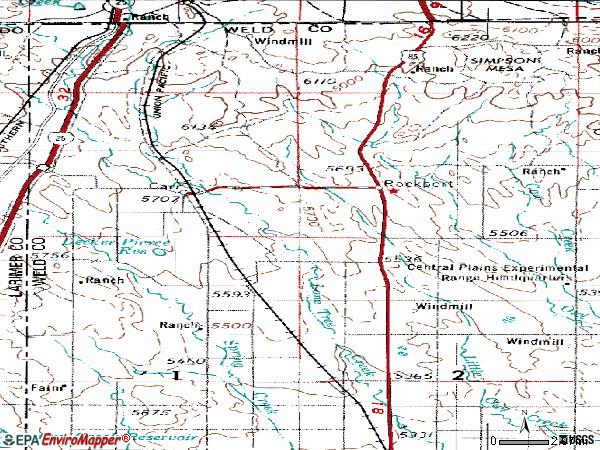
Notable locations in zip code 80612: Eastman Windmill (A), Baxter Camp (B), Collins Windmill (C), Stephens Windmill (D), Shaklee Windmill (E), Beacon Camp (F), Buffalo Windmill (G), Happy Hollow Windmill (H), Schnoor Windmill (I), Ponnequin Camp (J), Railroad Windmill (K), Davis Windmill (L), Meadow Springs Ranch (M), Lone Tree Windmill (N), Pawnee National Grasslands Research Center (O), Bulger Windmill (P), Eagle Windmill (Q). Display/hide their locations on the map
Reservoirs: Indian Creek Reservoir (A), Retention Reservoir B-4 (B), Giffon Number 1 Reservoir (C), Giffon Number 2 Reservoir (D), Decker - Pierce Reservoir (E). Display/hide their locations on the map
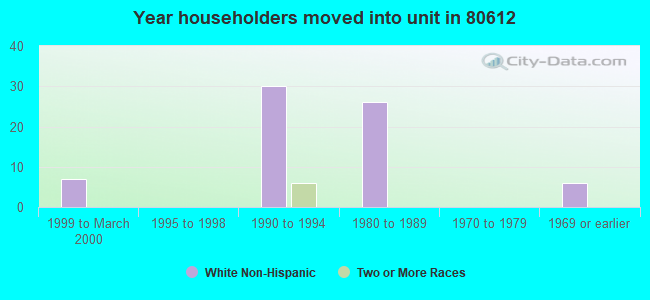
Size of family households: 97 2-persons, 16 4-persons
Size of nonfamily households: 11 1-person, 20 2-persons
33 married couples with children.
0 single-parent households ().
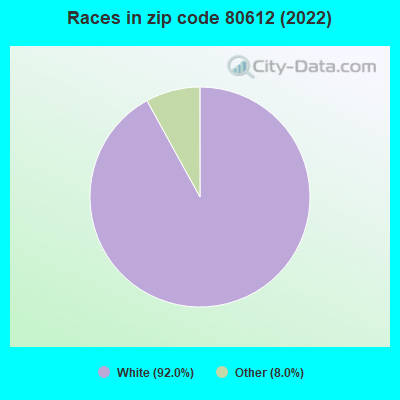
101.3% of residents of 80612 zip code speak English at home.
Foreign born population: 0 (0.0%)
:
0.0%
Whole state:
9.5%
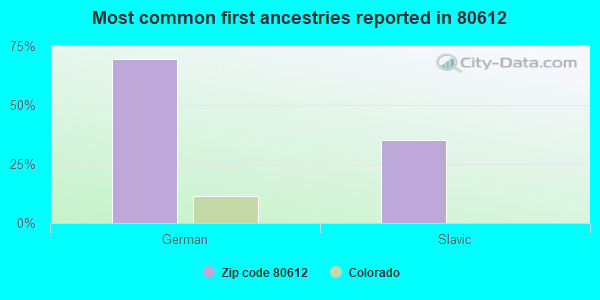
70%German
35%Slavic
Facilities with environmental interests located in this zip code:
ANDESITE ROCK CO (61000 COUNTY ROAD 21 in CARR, CO)
AIR MINOR (AIRS/AFS) AIR SYNTHETIC MINOR (AIRS/AFS) CRITERIA AND HAZARDOUS AIR POLLUTANT INVENTORY (Inventory of air pollution sources) Business SIC classification: CRUSHED AND BROKEN STONE; CONSTRUCTION SAND AND GRAVEL Alternative names: ANDESITE ROCK CO - CARR GRAVEL RESOURCE
CHEYENNE PLAINS AMINE PLANT (65657 HIGHWAY 85 in CARR, CO)
National Pollutant Discharge Elimination System NON-MAJOR (Tracking pollutant discharge elimination systems) - permit Business SIC classification: NATURAL GAS TRANSMISSION Organizations: PLAINS GAS PIPELINE CO, LLC (CONTACT/OWNER)
Alternative names: CHEYENNE PLAINS GAS PIPELINE
Housing units lacking complete plumbing facilities: 18.1%
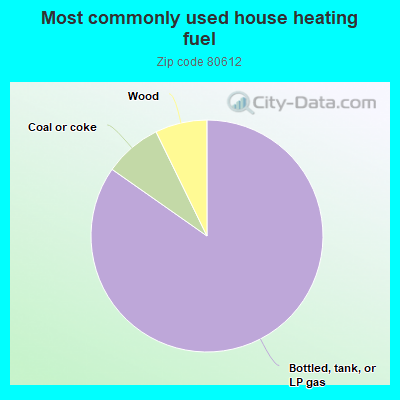
85.6%Bottled, tank, or LP gas
8.1%Coal or coke
7.3%Wood
Population in 1990: 94. Population change in the 1990s: +101 (+107.4%).
Place of birth for U.S.-born residents:
This state: 224
Northeast: 11
Midwest: 35
West: 40
74% of the 80612 zip code residents lived in the same house 5 years ago. Out of people who lived in different houses, 44% lived in this county. Out of people who lived in different counties, 50% lived in Colorado.
97% of the 80612 zip code residents lived in the same house 1 year ago. Out of people who lived in different houses, 125% moved from this county.
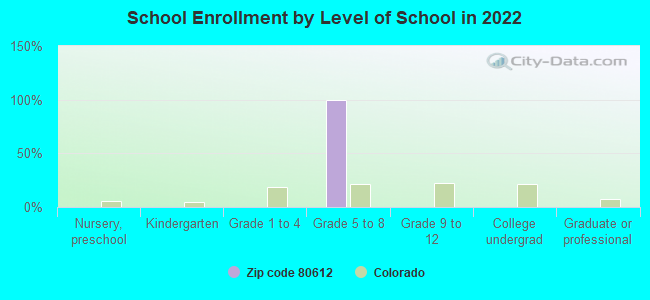
Private vs. public school enrollment:
Students in private schools in grades 1 to 8 (elementary and middle school):
Here:
0.0%
Colorado:
11.4%
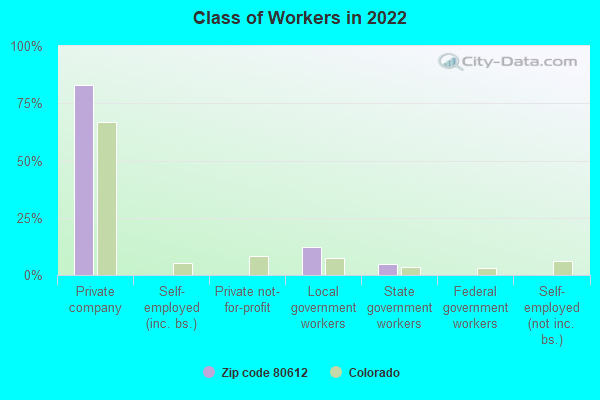
Top industries in this zip code by the number of employees in 2005:
Utilities: Natural Gas Distribution (10-19 employees: 1 establishment)
Construction: Plumbing, Heating, and Air-Conditioning Contractors (5-9: 1)
Accommodation and Food Services: Full-Service Restaurants (1-4: 1)
Construction: Painting and Wall Covering Contractors (1-4: 1)
Construction: Site Preparation Contractors (1-4: 1)
Construction: New Single-Family Housing Construction (except Operative Builders) (1-4: 1)
Fatal accident statistics in 2014:
Fatal accident count: 1
Vehicles involved in fatal accidents: 1
Fatal accidents caused by drunken drivers: 0
Fatalities: 1
Persons involved in fatal accidents: 1
Pedestrians involved in fatal accidents: 0
Fatal accident statistics in 2013:
Fatal accident count: 1
Vehicles involved in fatal accidents: 1
Fatal accidents caused by drunken drivers: 0
Fatalities: 3
Persons involved in fatal accidents: 5
Pedestrians involved in fatal accidents: 0
Home Mortgage Disclosure Act Aggregated Statistics For Year 2009 (Based on 2 partial tracts)
A) FHA, FSA/RHS & VA Home Purchase Loans
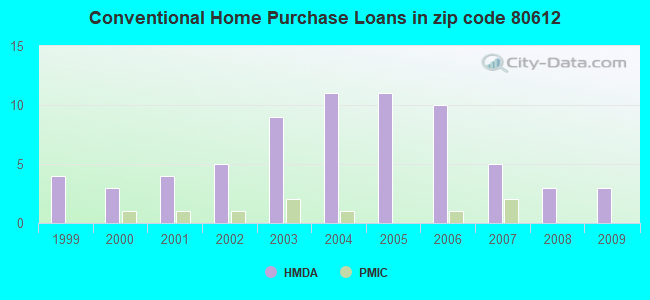
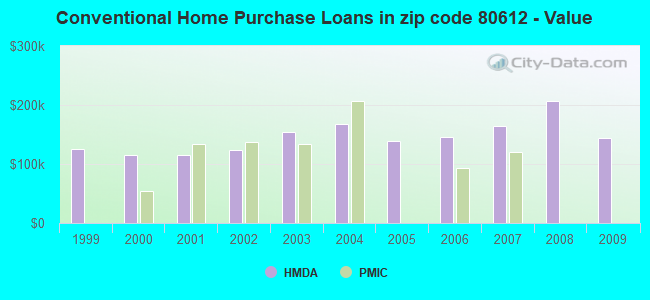
B) Conventional Home Purchase Loans
C) Refinancings
D) Home Improvement Loans
F) Non-occupant Loans on < 5 Family Dwellings (A B C & D)
G) Loans On Manufactured Home Dwelling (A B C & D)
Number
Average Value
Number
Average Value
Number
Average Value
Number
Average Value
Number
Average Value
Number
Average Value
LOANS ORIGINATED
2
$188,035
3
$144,197
10
$206,465
1
$62,190
1
$128,380
2
$170,215
APPLICATIONS APPROVED, NOT ACCEPTED
0
$0
1
$43,420
2
$194,875
0
$0
1
$97,110
1
$79,890
APPLICATIONS DENIED
0
$0
1
$134,760
6
$228,683
1
$18,760
0
$0
1
$151,980
APPLICATIONS WITHDRAWN
0
$0
0
$0
5
$222,454
0
$0
0
$0
1
$85,550
FILES CLOSED FOR INCOMPLETENESS
0
$0
0
$0
1
$199,770
0
$0
0
$0
0
$0
Aggregated Statistics For Year 2008 (Based on 2 partial tracts)
A) FHA, FSA/RHS & VA Home Purchase Loans
B) Conventional Home Purchase Loans
C) Refinancings
D) Home Improvement Loans
F) Non-occupant Loans on < 5 Family Dwellings (A B C & D)
G) Loans On Manufactured Home Dwelling (A B C & D)
Number
Average Value
Number
Average Value
Number
Average Value
Number
Average Value
Number
Average Value
Number
Average Value
LOANS ORIGINATED
2
$185,200
3
$207,090
7
$203,079
0
$0
1
$86,610
3
$146,633
APPLICATIONS APPROVED, NOT ACCEPTED
0
$0
0
$0
2
$154,995
0
$0
0
$0
0
$0
APPLICATIONS DENIED
2
$126,380
1
$151,280
8
$198,092
2
$31,685
0
$0
2
$144,430
APPLICATIONS WITHDRAWN
0
$0
1
$85,430
2
$158,355
0
$0
0
$0
1
$55,460
FILES CLOSED FOR INCOMPLETENESS
0
$0
0
$0
0
$0
0
$0
0
$0
0
$0
Aggregated Statistics For Year 2007 (Based on 2 partial tracts)
A) FHA, FSA/RHS & VA Home Purchase Loans
B) Conventional Home Purchase Loans
C) Refinancings
D) Home Improvement Loans
F) Non-occupant Loans on < 5 Family Dwellings (A B C & D)
G) Loans On Manufactured Home Dwelling (A B C & D)
Number
Average Value
Number
Average Value
Number
Average Value
Number
Average Value
Number
Average Value
Number
Average Value
LOANS ORIGINATED
2
$163,015
5
$164,280
11
$177,697
2
$54,810
1
$112,220
4
$146,998
APPLICATIONS APPROVED, NOT ACCEPTED
0
$0
1
$120,120
2
$162,665
1
$42,130
0
$0
0
$0
APPLICATIONS DENIED
0
$0
2
$272,165
19
$172,758
4
$88,708
1
$141,360
2
$157,590
APPLICATIONS WITHDRAWN
0
$0
1
$152,690
3
$197,217
1
$115,990
0
$0
1
$120,950
FILES CLOSED FOR INCOMPLETENESS
0
$0
1
$85,790
1
$261,490
0
$0
0
$0
0
$0
Aggregated Statistics For Year 2006 (Based on 2 partial tracts)
A) FHA, FSA/RHS & VA Home Purchase Loans
B) Conventional Home Purchase Loans
C) Refinancings
D) Home Improvement Loans
F) Non-occupant Loans on < 5 Family Dwellings (A B C & D)
G) Loans On Manufactured Home Dwelling (A B C & D)
Number
Average Value
Number
Average Value
Number
Average Value
Number
Average Value
Number
Average Value
Number
Average Value
LOANS ORIGINATED
1
$223,140
10
$145,140
15
$166,333
2
$52,980
2
$104,550
5
$138,934
APPLICATIONS APPROVED, NOT ACCEPTED
0
$0
2
$121,245
4
$180,540
0
$0
0
$0
0
$0
APPLICATIONS DENIED
0
$0
5
$211,622
20
$154,380
3
$53,337
1
$186,910
3
$127,203
APPLICATIONS WITHDRAWN
0
$0
2
$157,060
7
$172,583
0
$0
0
$0
1
$175,110
FILES CLOSED FOR INCOMPLETENESS
0
$0
0
$0
2
$189,860
0
$0
0
$0
0
$0
Aggregated Statistics For Year 2005 (Based on 2 partial tracts)
A) FHA, FSA/RHS & VA Home Purchase Loans
B) Conventional Home Purchase Loans
C) Refinancings
D) Home Improvement Loans
F) Non-occupant Loans on < 5 Family Dwellings (A B C & D)
G) Loans On Manufactured Home Dwelling (A B C & D)
Number
Average Value
Number
Average Value
Number
Average Value
Number
Average Value
Number
Average Value
Number
Average Value
LOANS ORIGINATED
1
$155,410
11
$138,521
18
$168,963
3
$86,377
2
$93,690
4
$131,895
APPLICATIONS APPROVED, NOT ACCEPTED
0
$0
1
$139,360
5
$165,672
0
$0
1
$45,900
1
$100,540
APPLICATIONS DENIED
0
$0
7
$146,960
22
$165,629
3
$82,520
2
$98,355
2
$176,290
APPLICATIONS WITHDRAWN
0
$0
3
$127,753
12
$163,184
1
$56,050
1
$73,750
2
$140,480
FILES CLOSED FOR INCOMPLETENESS
0
$0
0
$0
3
$190,060
0
$0
0
$0
0
$0
Aggregated Statistics For Year 2004 (Based on 2 partial tracts)
A) FHA, FSA/RHS & VA Home Purchase Loans
B) Conventional Home Purchase Loans
C) Refinancings
D) Home Improvement Loans
F) Non-occupant Loans on < 5 Family Dwellings (A B C & D)
G) Loans On Manufactured Home Dwelling (A B C & D)
Number
Average Value
Number
Average Value
Number
Average Value
Number
Average Value
Number
Average Value
Number
Average Value
LOANS ORIGINATED
1
$216,650
11
$167,925
23
$167,514
2
$35,520
1
$172,750
4
$168,592
APPLICATIONS APPROVED, NOT ACCEPTED
0
$0
2
$146,850
6
$161,168
0
$0
0
$0
1
$129,920
APPLICATIONS DENIED
1
$111,980
4
$152,780
21
$161,216
3
$70,800
0
$0
4
$151,570
APPLICATIONS WITHDRAWN
0
$0
1
$186,560
11
$165,082
0
$0
0
$0
1
$160,360
FILES CLOSED FOR INCOMPLETENESS
0
$0
0
$0
3
$160,087
0
$0
0
$0
0
$0
Aggregated Statistics For Year 2003 (Based on 2 partial tracts)
A) FHA, FSA/RHS & VA Home Purchase Loans
B) Conventional Home Purchase Loans
C) Refinancings
D) Home Improvement Loans
F) Non-occupant Loans on < 5 Family Dwellings (A B C & D)
Number
Average Value
Number
Average Value
Number
Average Value
Number
Average Value
Number
Average Value
LOANS ORIGINATED
2
$144,255
9
$154,541
34
$161,507
3
$39,687
1
$136,640
APPLICATIONS APPROVED, NOT ACCEPTED
0
$0
2
$190,215
5
$182,994
0
$0
1
$115,990
APPLICATIONS DENIED
0
$0
4
$134,048
21
$169,532
2
$24,190
1
$191,040
APPLICATIONS WITHDRAWN
0
$0
1
$185,500
7
$153,670
0
$0
1
$78,000
FILES CLOSED FOR INCOMPLETENESS
0
$0
0
$0
1
$236,470
0
$0
0
$0
Aggregated Statistics For Year 2002 (Based on 2 partial tracts)
A) FHA, FSA/RHS & VA Home Purchase Loans
B) Conventional Home Purchase Loans
C) Refinancings
D) Home Improvement Loans
F) Non-occupant Loans on < 5 Family Dwellings (A B C & D)
Number
Average Value
Number
Average Value
Number
Average Value
Number
Average Value
Number
Average Value
LOANS ORIGINATED
1
$138,300
5
$124,088
18
$155,747
2
$40,945
1
$148,440
APPLICATIONS APPROVED, NOT ACCEPTED
0
$0
2
$134,225
3
$137,943
0
$0
0
$0
APPLICATIONS DENIED
0
$0
3
$92,747
10
$142,520
1
$12,860
0
$0
APPLICATIONS WITHDRAWN
0
$0
1
$142,660
5
$151,252
0
$0
0
$0
FILES CLOSED FOR INCOMPLETENESS
0
$0
0
$0
1
$196,120
0
$0
0
$0
Aggregated Statistics For Year 2001 (Based on 2 partial tracts)
A) FHA, FSA/RHS & VA Home Purchase Loans
B) Conventional Home Purchase Loans
C) Refinancings
D) Home Improvement Loans
F) Non-occupant Loans on < 5 Family Dwellings (A B C & D)
Number
Average Value
Number
Average Value
Number
Average Value
Number
Average Value
Number
Average Value
LOANS ORIGINATED
1
$94,280
4
$114,548
12
$132,229
2
$12,745
1
$64,550
APPLICATIONS APPROVED, NOT ACCEPTED
0
$0
1
$31,620
2
$124,370
0
$0
0
$0
APPLICATIONS DENIED
0
$0
2
$123,725
5
$127,510
1
$12,860
0
$0
APPLICATIONS WITHDRAWN
0
$0
1
$84,020
3
$134,560
0
$0
0
$0
FILES CLOSED FOR INCOMPLETENESS
0
$0
0
$0
0
$0
0
$0
0
$0
Aggregated Statistics For Year 2000 (Based on 2 partial tracts)
B) Conventional Home Purchase Loans
C) Refinancings
D) Home Improvement Loans
Number
Average Value
Number
Average Value
Number
Average Value
LOANS ORIGINATED
3
$114,970
3
$149,270
2
$25,785
APPLICATIONS APPROVED, NOT ACCEPTED
1
$74,580
1
$191,990
1
$10,970
APPLICATIONS DENIED
2
$89,855
4
$79,828
1
$28,910
APPLICATIONS WITHDRAWN
0
$0
2
$133,810
0
$0
FILES CLOSED FOR INCOMPLETENESS
0
$0
1
$63,130
0
$0
Aggregated Statistics For Year 1999 (Based on 1 partial tract)
A) FHA, FSA/RHS & VA Home Purchase Loans
B) Conventional Home Purchase Loans
C) Refinancings
D) Home Improvement Loans
F) Non-occupant Loans on < 5 Family Dwellings (A B C & D)
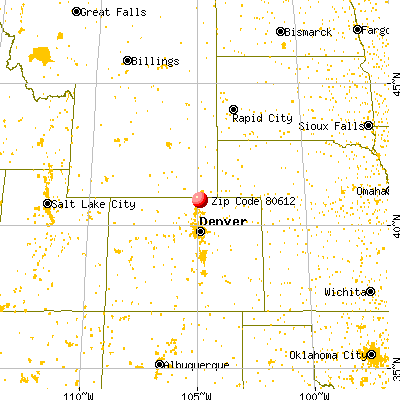


 Nearest zip codes: 80648, 80549, 82001, 80650, 82007, 82005.