Estimated zip code population in 2022: 14,887 Zip code population in 2010: 7,365 Zip code population in 2000: 2,988
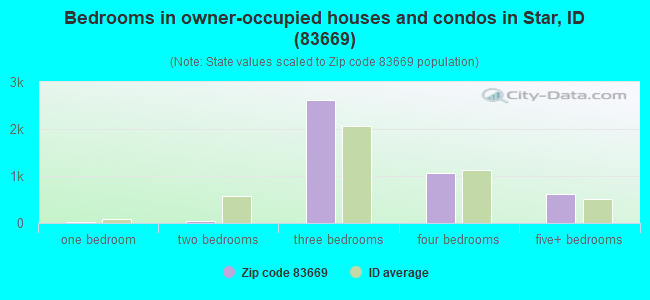
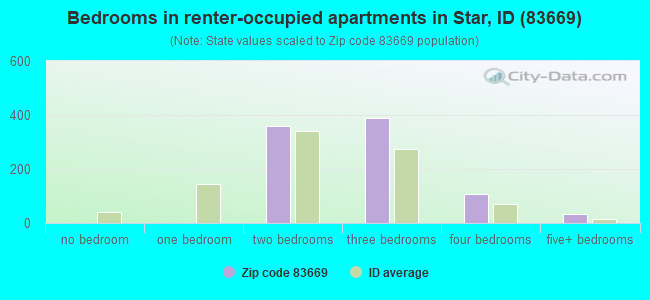
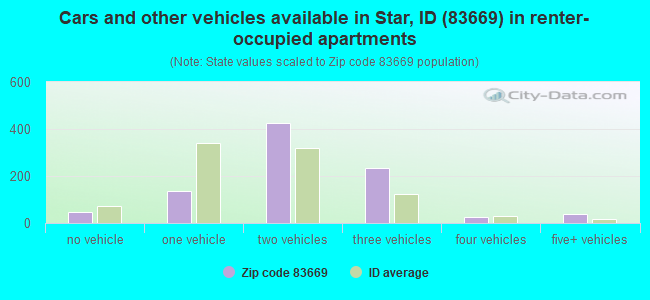
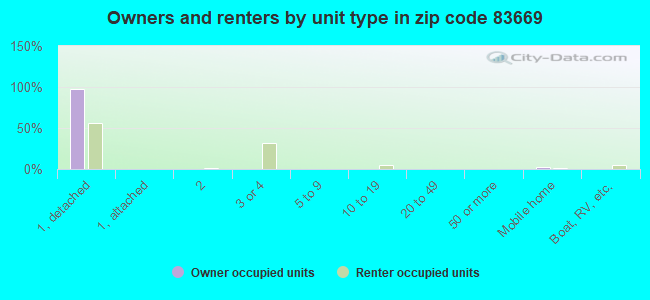
Houses and condos: 5,259 Renter-occupied apartments: 884
% of renters here:
17%
State:
28%
March 2022 cost of living index in zip code 83669: 95.4 (near average, U.S. average is 100)
Land area: 19.8 sq. mi. Water area: 0.2 sq. mi.
Population density: 752 people per square mile
(low).
OSM Map
General Map
Google Map
MSN Map
OSM Map
General Map
Google Map
MSN Map
OSM Map
General Map
Google Map
MSN Map
OSM Map
General Map
Google Map
MSN Map
Please wait while loading the map...
Real estate property taxes paid for housing units in 2022:
This zip code:
0.4% ($2,723)
Idaho:
0.5% ($1,995)
Median real estate property taxes paid for housing units with mortgages in 2022: $2,573 (0.4%) Median real estate property taxes paid for housing units with no mortgage in 2022: $3,391 (0.5%)
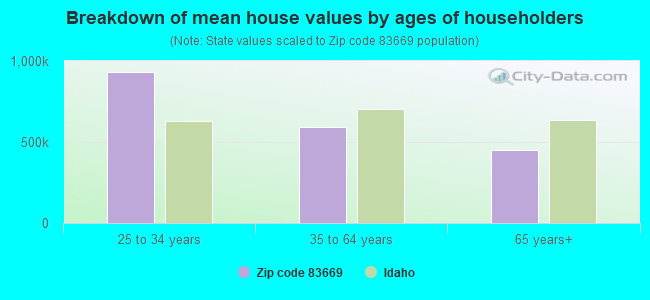
Estimated median house/condo value in 2022: $614,056
83669:
$614,056
Idaho:
$432,500
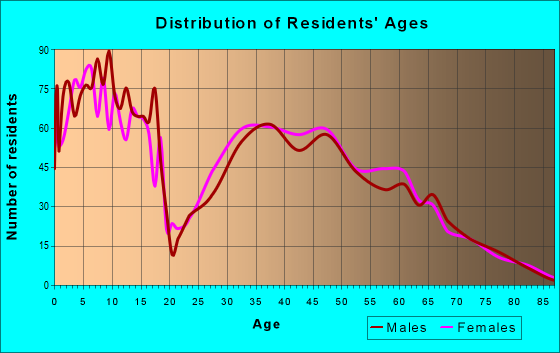
Median resident age:
This zip code:
43.9 years
Idaho median age:
37.5 years
Average household size:
This zip code:
2.8 people
Idaho:
2.6 people
Averages for the 2020 tax year for zip code 83669, filed in 2021:
Average Adjusted Gross Income (AGI) in 2020: $101,748 (Individual Income Tax Returns)
Here:
$101,748
State:
$73,627
Salary/wage: $74,411 (reported on 75.4% of returns)
Here:
$74,411
State:
$55,245
(% of AGI for various income ranges: 1194.2% for AGIs below $25k, 3461.2% for AGIs $25k-50k, 6217.0% for AGIs $50k-75k, 8688.8% for AGIs $75k-100k, 17488.6% for AGIs $100k-200k, 72715.0% for AGIs over 200k)
Taxable interest for individuals: $1,332 (reported on 40.9% of returns)
This zip code:
$1,332
Idaho:
$2,230
(% of AGI for various income ranges: 34.0% for AGIs below $25k, 43.5% for AGIs $25k-50k, 75.7% for AGIs $50k-75k, 90.2% for AGIs $75k-100k, 147.7% for AGIs $100k-200k, 545.0% for AGIs over 200k)
Ordinary dividends: $4,956 (reported on 25.2% of returns)
Here:
$4,956
State:
$7,088
(% of AGI for various income ranges: 60.8% for AGIs below $25k, 66.0% for AGIs $25k-50k, 122.3% for AGIs $50k-75k, 152.4% for AGIs $75k-100k, 274.0% for AGIs $100k-200k, 2221.9% for AGIs over 200k)
Net capital gain/loss in AGI: +$54,217 (reported on 26.5% of returns)
Here:
+$54,217
State:
+$37,284
(% of AGI for various income ranges: 16.0% for AGIs below $25k, 57.0% for AGIs $25k-50k, 171.3% for AGIs $50k-75k, 303.2% for AGIs $75k-100k, 1097.8% for AGIs $100k-200k, 53431.2% for AGIs over 200k)
Profit/loss from business: +$16,129 (reported on 19.6% of returns)
Here:
+$16,129
State:
+$12,955
(% of AGI for various income ranges: 131.9% for AGIs below $25k, 248.0% for AGIs $25k-50k, 363.8% for AGIs $50k-75k, 485.0% for AGIs $75k-100k, 744.3% for AGIs $100k-200k, 4568.8% for AGIs over 200k)
Taxable individual retirement arrangement distribution: $23,488 (reported on 13.8% of returns)
83669:
$23,488
Idaho:
$20,110
(% of AGI for various income ranges: 108.3% for AGIs below $25k, 248.6% for AGIs $25k-50k, 374.6% for AGIs $50k-75k, 524.8% for AGIs $75k-100k, 1128.1% for AGIs $100k-200k, 3004.4% for AGIs over 200k)
Self-employed (Keogh) retirement plans: $23,720 (reported on 0.7% of returns)
83669:
$23,720
Idaho:
$25,219
(% of AGI for various income ranges: 146.4% for AGIs $100k-200k)
Total itemized deductions: $35,646 (reported on 17.7% of returns)
Here:
$35,646
State:
$38,402
(% of AGI for various income ranges: 113.0% for AGIs below $25k, 270.7% for AGIs $25k-50k, 578.0% for AGIs $50k-75k, 837.8% for AGIs $75k-100k, 2028.6% for AGIs $100k-200k, 9480.0% for AGIs over 200k)
Charity contributions: $12,298 (reported on 15.5% of returns)
Here:
$12,298
State:
$18,314
(% of AGI for various income ranges: 10.1% for AGIs below $25k, 28.9% for AGIs $25k-50k, 85.9% for AGIs $50k-75k, 184.2% for AGIs $75k-100k, 500.0% for AGIs $100k-200k, 4418.1% for AGIs over 200k)
Taxes paid: $8,107 (reported on 17.5% of returns)
83669:
$8,107
State:
$7,596
(% of AGI for various income ranges: 19.3% for AGIs below $25k, 48.6% for AGIs $25k-50k, 107.0% for AGIs $50k-75k, 202.2% for AGIs $75k-100k, 536.2% for AGIs $100k-200k, 1893.1% for AGIs over 200k)
Earned income credit: $2,038 (reported on 8.8% of returns)
Here:
$2,038
State:
$2,195
(% of AGI for various income ranges: 61.0% for AGIs below $25k, 67.7% for AGIs $25k-50k, 2.3% for AGIs $50k-75k)
Percentage of individuals using paid preparers for their 2020 taxes: 94.0%
Here:
94%
State:
94%
(% for various income ranges: 92.6% for AGIs below $25k, 93.3% for AGIs $25k-50k, 93.6% for AGIs $50k-75k, 93.9% for AGIs $75k-100k, 95.1% for AGIs $100k-200k, 96.6% for AGIs over 200k)
Averages for the 2012 tax year for zip code 83669, filed in 2013:
Average Adjusted Gross Income (AGI) in 2012: $68,517 (Individual Income Tax Returns)
Here:
$68,517
State:
$52,536
Salary/wage: $55,867 (reported on 82.1% of returns)
Here:
$55,867
State:
$41,938
(% of AGI for various income ranges: 71.2% for AGIs below $25k, 73.8% for AGIs $25k-50k, 74.0% for AGIs $50k-75k, 71.7% for AGIs $75k-100k, 75.1% for AGIs $100k-200k, 46.2% for AGIs over 200k)
Taxable interest for individuals: $1,330 (reported on 35.9% of returns)
This zip code:
$1,330
Idaho:
$1,874
(% of AGI for various income ranges: 1.7% for AGIs below $25k, 1.0% for AGIs $25k-50k, 0.5% for AGIs $50k-75k, 0.5% for AGIs $75k-100k, 0.5% for AGIs $100k-200k, 0.8% for AGIs over 200k)
Ordinary dividends: $5,437 (reported on 19.9% of returns)
Here:
$5,437
State:
$5,706
(% of AGI for various income ranges: 2.9% for AGIs below $25k, 1.0% for AGIs $25k-50k, 0.6% for AGIs $50k-75k, 0.8% for AGIs $75k-100k, 1.0% for AGIs $100k-200k, 3.3% for AGIs over 200k)
Net capital gain/loss in AGI: +$13,337 (reported on 19.4% of returns)
Here:
+$13,337
State:
+$14,571
(% of AGI for various income ranges: 0.7% for AGIs $50k-75k, 0.8% for AGIs $75k-100k, 2.1% for AGIs $100k-200k, 12.2% for AGIs over 200k)
Profit/loss from business: +$11,400 (reported on 20.8% of returns)
Here:
+$11,400
State:
+$10,113
(% of AGI for various income ranges: 9.2% for AGIs below $25k, 5.9% for AGIs $25k-50k, 4.7% for AGIs $50k-75k, 3.9% for AGIs $75k-100k, 2.5% for AGIs $100k-200k, 1.1% for AGIs over 200k)
Taxable individual retirement arrangement distribution: $17,392 (reported on 11.4% of returns)
83669:
$17,392
Idaho:
$14,642
(% of AGI for various income ranges: 4.4% for AGIs below $25k, 2.7% for AGIs $25k-50k, 2.6% for AGIs $50k-75k, 3.2% for AGIs $75k-100k, 2.5% for AGIs $100k-200k, 3.0% for AGIs over 200k)
Total itemized deductions: $24,001 (22% of AGI, reported on 45.0% of returns)
Here:
$24,001
State:
$22,697
Here:
21.8% of AGI
State:
22.0% of AGI
(% of AGI for various income ranges: 15.0% for AGIs below $25k, 13.2% for AGIs $25k-50k, 16.9% for AGIs $50k-75k, 17.4% for AGIs $75k-100k, 18.0% for AGIs $100k-200k, 13.0% for AGIs over 200k)
Charity contributions: $4,957 (reported on 37.3% of returns)
Here:
$4,957
State:
$5,246
(% of AGI for various income ranges: 1.2% for AGIs below $25k, 1.5% for AGIs $25k-50k, 2.5% for AGIs $50k-75k, 2.8% for AGIs $75k-100k, 2.9% for AGIs $100k-200k, 3.4% for AGIs over 200k)
Taxes paid: $7,626 (reported on 44.4% of returns)
83669:
$7,626
State:
$7,139
(% of AGI for various income ranges: 3.0% for AGIs below $25k, 2.6% for AGIs $25k-50k, 3.7% for AGIs $50k-75k, 4.5% for AGIs $75k-100k, 6.5% for AGIs $100k-200k, 5.8% for AGIs over 200k)
Earned income credit: $2,385 (reported on 17.7% of returns)
Here:
$2,385
State:
$2,213
(% of AGI for various income ranges: 7.4% for AGIs below $25k, 1.7% for AGIs $25k-50k)
Percentage of individuals using paid preparers for their 2012 taxes: 55.3%
Here:
55%
State:
52%
(% for various income ranges: 47.7% for AGIs below $25k, 52.6% for AGIs $25k-50k, 54.1% for AGIs $50k-75k, 59.0% for AGIs $75k-100k, 66.7% for AGIs $100k-200k, 84.6% for AGIs over 200k)
Averages for the 2004 tax year for zip code 83669, filed in 2005:
Average Adjusted Gross Income (AGI) in 2004: $58,735 (Individual Income Tax Returns)
Here:
$58,735
State:
$42,679
Salary/wage: $50,492 (reported on 85.7% of returns)
Here:
$50,492
State:
$35,636
(% of AGI for various income ranges: 222.0% for AGIs below $10k, 74.4% for AGIs $10k-25k, 80.0% for AGIs $25k-50k, 85.2% for AGIs $50k-75k, 83.5% for AGIs $75k-100k, 62.2% for AGIs over 100k)
Taxable interest for individuals: $1,909 (reported on 44.5% of returns)
This zip code:
$1,909
Idaho:
$2,024
(% of AGI for various income ranges: 12.0% for AGIs below $10k, 2.1% for AGIs $10k-25k, 1.6% for AGIs $25k-50k, 0.8% for AGIs $50k-75k, 0.5% for AGIs $75k-100k, 1.7% for AGIs over 100k)
Taxable dividends: $2,389 (reported on 25.7% of returns)
Here:
$2,389
State:
$2,917
(% of AGI for various income ranges: 7.9% for AGIs below $10k, 1.2% for AGIs $10k-25k, 0.6% for AGIs $25k-50k, 0.5% for AGIs $50k-75k, 0.7% for AGIs $75k-100k, 1.4% for AGIs over 100k)
Net capital gain/loss: +$17,184 (reported on 25.2% of returns)
Here:
+$17,184
State:
+$13,146
(% of AGI for various income ranges: 1.2% for AGIs below $10k, 0.8% for AGIs $10k-25k, 0.8% for AGIs $25k-50k, 1.4% for AGIs $50k-75k, 1.3% for AGIs $75k-100k, 14.7% for AGIs over 100k)
Profit/loss from business: +$9,449 (reported on 20.8% of returns)
Here:
+$9,449
State:
+$8,765
(% of AGI for various income ranges: 24.2% for AGIs below $10k, 9.0% for AGIs $10k-25k, 5.2% for AGIs $25k-50k, 1.8% for AGIs $50k-75k, 3.0% for AGIs $75k-100k, 2.4% for AGIs over 100k)
IRA payment deduction: $3,129 (reported on 3.7% of returns)
83669:
$3,129
Idaho:
$3,020
(% of AGI for various income ranges: 0.4% for AGIs $25k-50k, 0.2% for AGIs $50k-75k, 0.3% for AGIs $75k-100k, 0.1% for AGIs over 100k)
Total itemized deductions: $21,046 (24% of AGI, reported on 53.4% of returns)
Here:
$21,046
State:
$18,385
Here:
24.1% of AGI
State:
23.1% of AGI
(% of AGI for various income ranges: 43.9% for AGIs below $10k, 16.9% for AGIs $10k-25k, 21.4% for AGIs $25k-50k, 21.8% for AGIs $50k-75k, 21.0% for AGIs $75k-100k, 16.7% for AGIs over 100k)
Charity contributions deductions: $3,365 (4% of AGI, reported on 46.7% of returns)
Here:
$3,365
State:
$3,875
Here:
3.7% of AGI
State:
4.6% of AGI
(% of AGI for various income ranges: 2.5% for AGIs below $10k, 1.6% for AGIs $10k-25k, 2.3% for AGIs $25k-50k, 2.9% for AGIs $50k-75k, 3.0% for AGIs $75k-100k, 2.8% for AGIs over 100k)
Total tax: $8,952 (reported on 77.4% of returns)
83669:
$8,952
State:
$6,282
(% of AGI for various income ranges: 8.2% for AGIs below $10k, 4.9% for AGIs $10k-25k, 5.2% for AGIs $25k-50k, 6.5% for AGIs $50k-75k, 9.5% for AGIs $75k-100k, 17.7% for AGIs over 100k)
Earned income credit: $1,612 (reported on 13.5% of returns)
Here:
$1,612
State:
$1,660
Percentage of individuals using paid preparers for their 2004 taxes: 60.3%
Here:
60%
State:
59%
(% for various income ranges: 50.5% for AGIs below $10k, 61.8% for AGIs $10k-25k, 58.0% for AGIs $25k-50k, 61.9% for AGIs $50k-75k, 61.5% for AGIs $75k-100k, 72.2% for AGIs over 100k)
Likely homosexual households (counted as self-reported same-sex unmarried-partner households)
Lesbian couples: 0.5% of all households
Gay men: 0.0% of all households
Household received Food Stamps/SNAP in the past 12 months: 37 Household did not receive Food Stamps/SNAP in the past 12 months: 5,240
Women who had a birth in the past 12 months: 53 (50 now married, 0 unmarried) Women who did not have a birth in the past 12 months: 2,812 (1,628 now married, 1,194 unmarried)
Housing units in zip code 83669 with a mortgage: 3,268 (295 second mortgage, 224 both second mortgage and home equity loan) Houses without a mortgage: 25
Median monthly owner costs for units with a mortgage: $1,848 Median monthly owner costs for units without a mortgage: $579
Residents with income below the poverty level in 2022:
This zip code:
3.9%
Whole state:
10.7%
Residents with income below 50% of the poverty level in 2022:
This zip code:
1.0%
Whole state:
6.1%
Median number of rooms in houses and condos:
Here:
6.5
State:
6.5
Median number of rooms in apartments:
Here:
5.2
State:
4.4
Notable locations in this zip code not listed on our city pages
In group quarters: 11 (-1 institutionalized population)
Size of family households: 1,867 2-persons, 595 3-persons, 748 4-persons, 334 5-persons, 193 6-persons, 149 7-or-more-persons
Size of nonfamily households: 933 1-person, 418 2-persons
2,983 married couples with children.
212 single-parent households (98 men, 114 women).
94.4% of residents of 83669 zip code speak English at home.
4.3% of residents speak Spanish at home (96% very well, 4% well).
0.2% of residents speak other Indo-European language at home (26% very well, 74% well).
0.9% of residents speak Asian or Pacific Island language at home (26% very well, 37% well, 37% not well).
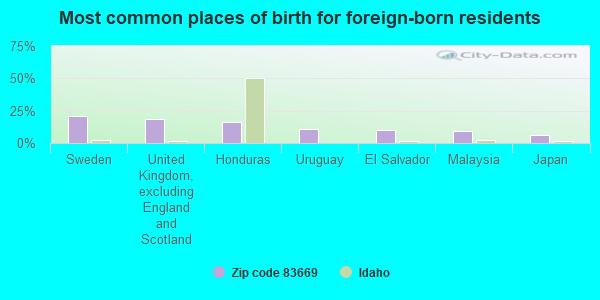
Foreign born population: 895 (6.0%) (71.3% of them are naturalized citizens)
This zip code:
6.0%
Whole state:
6.0%
21%Sweden
19%United Kingdom, excluding England and Scotland
16%Honduras
11%Uruguay
10%El Salvador
9%Malaysia
6%Japan
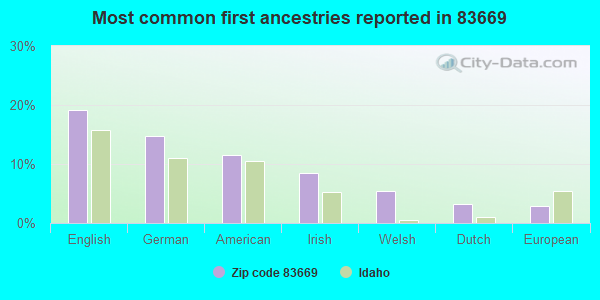
19%English
15%German
12%American
8%Irish
5%Welsh
3%Dutch
3%European
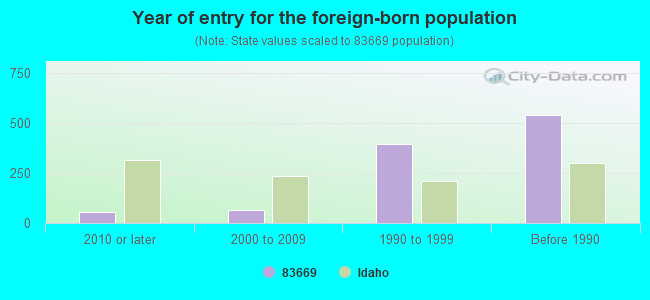
Year of entry for the foreign-born population
552010 or later
672000 to 2009
3961990 to 1999
539Before 1990
Facilities with environmental interests located in this zip code:
MEADOWBROOK SUBDIVISON #2 (STAR ROAD in STAR, ID)
National Pollutant Discharge Elimination System NON-MAJOR (Tracking pollutant discharge elimination systems) - permit - ICIS-10-2005-0015, ENFORCEMENT/COMPLIANCE ACTIVITY, ICIS-, National Pollutant Discharge Elimination System NON-MAJOR (Tracking pollutant discharge elimination systems) - permit - ICIS-10-2005-0036, ENFORCEMENT/COMPLIANCE ACTIVITY, ICIS-, Business SIC classification: GENERAL CONTRACTORS-SINGLE-FAMILY HOUSES Alternative names: MEADOWBROOK SUBDIVISION #2, PROJECTS WEST INC, TOMASKA CONSTRUCTION INC
LIBERTY DEVELOPMENT INC (10500 W. FLOATING FEATHER ROAD in STAR, ID)
(Integrated Compliance Information System) - ICIS-10-2006-0041, ENFORCEMENT/COMPLIANCE ACTIVITY FORMAL ENFORCEMENT ACTION (Integrated Compliance Information System) - ICIS-10-2006-0041, ENFORCEMENT/COMPLIANCE ACTIVITY National Pollutant Discharge Elimination System NON-MAJOR (Tracking pollutant discharge elimination systems) - permit Business SIC classification: GENERAL CONTRACTORS-RESIDENTIAL BUILDINGS, OTHER THAN SINGLE-FAMILY Alternative names: LOBO CREEK SUBDIVISION
STAR ELEMENTARY SCHOOL (700 NORTH STAR ROAD in STAR, ID)
(Geographic Names Information System) (National Center for Education Statistics) - STATE ID-002 103 Organizations: MERIDIAN JOINT SCHOOL DISTRICT 2 (SCHOOL DISTRICT)
NORTH STAR CHARTER SCHOOL (5713 N HILL HAVEN PLACE in STAR, ID)
(National Center for Education Statistics) - STATE ID-002 801 Organizations: MERIDIAN JOINT SCHOOL DISTRICT 2 (SCHOOL DISTRICT)
THORNTON HOG FARM (12421 HIGHWAY 16 in STAR, ID)
(Integrated Compliance Information System) - ICIS-10-1998-0096, FORMAL ENFORCEMENT ACTION, ICIS-10-1998-0097, Business SIC classification: HOGS
PINEWOOD LAKES SUBDIV-PHASE 6 (1/8 MILE SOUTH OF STATE HWY 44 in STAR, ID)
National Pollutant Discharge Elimination System NON-MAJOR (Tracking pollutant discharge elimination systems) - permit National Pollutant Discharge Elimination System NON-MAJOR (Tracking pollutant discharge elimination systems) - permit Business SIC classification: GENERAL CONTRACTORS-NONRESIDENTIAL BUILDINGS, OTHER THAN INDUSTRIAL BUILDINGS AND WAREHOUSES Alternative names: PINEWOOD LAKES SUBDIV-PHASE 5, SUPERIOR CONSTRUCTION &
LITTLE CATTLE CO (6139 EDNA LN in STAR, ID)
(Resource Conservation and Recovery Act (tracking hazardous waste))
G & B REDI-MIX (GOLDIE LANE-2.5 MI W STAR RD in STAR, ID)
AIR MINOR (AIRS/AFS) Business SIC classification: CRUSHED AND BROKEN STONE
PINEWOOD LAKES SUBDIV NO. 5/6 (1/8 MILE SOUTH OF STATE HWY 44 in STAR, ID)
National Pollutant Discharge Elimination System NON-MAJOR (Tracking pollutant discharge elimination systems) - permit Business SIC classification: GENERAL CONTRACTORS-NONRESIDENTIAL BUILDINGS, OTHER THAN INDUSTRIAL BUILDINGS AND WAREHOUSES Alternative names: PINEWOOD LAKES LLC
STAR WATER & SEWER DISTRICT (WASTEWATER TREATMENT PLANT in STAR, ID)
National Pollutant Discharge Elimination System NON-MAJOR (Tracking pollutant discharge elimination systems) - permit Business SIC classification: SEWERAGE SYSTEMS
Housing units lacking complete plumbing facilities: 0.8% Housing units lacking complete kitchen facilities: 1.3%
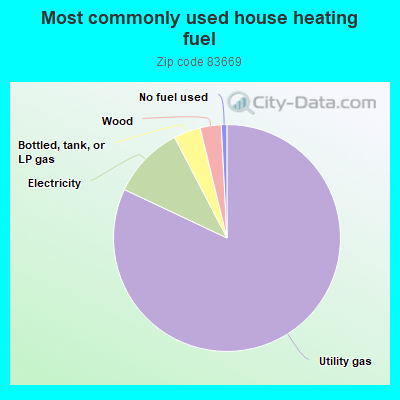
81.7%Utility gas
10.3%Electricity
3.8%Bottled, tank, or LP gas
3.0%Wood
0.8%No fuel used
Population in 1990: 1,579. Population change in the 1990s: +1,409 (+89.2%).
Place of birth for U.S.-born residents:
This state: 4,471
Northeast: 466
Midwest: 1,481
South: 707
West: 6,760
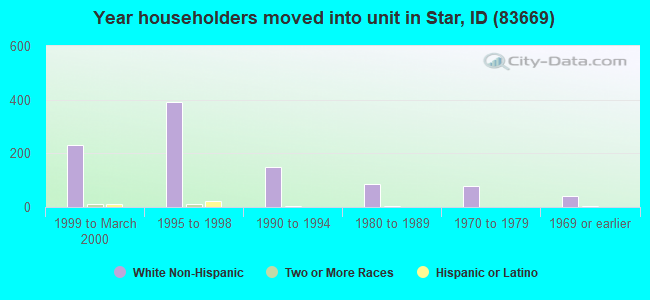
38% of the 83669 zip code residents lived in the same house 5 years ago. Out of people who lived in different houses, 52% lived in this county. Out of people who lived in different counties, 50% lived in Idaho.
83% of the 83669 zip code residents lived in the same house 1 year ago. Out of people who lived in different houses, 21% moved from this county. Out of people who lived in different houses, 5% moved from different county within same state. Out of people who lived in different houses, 73% moved from different state.
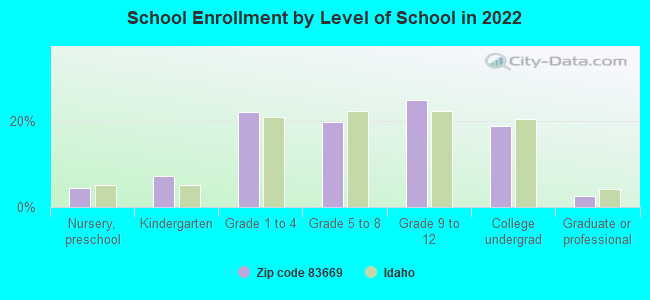
Private vs. public school enrollment:
Students in private schools in grades 1 to 8 (elementary and middle school): 26
Here:
1.7%
Idaho:
13.5%
Students in private schools in grades 9 to 12 (high school): 105
Here:
11.4%
Idaho:
8.5%
Students in private undergraduate colleges: 119
Here:
17.2%
Idaho:
30.0%
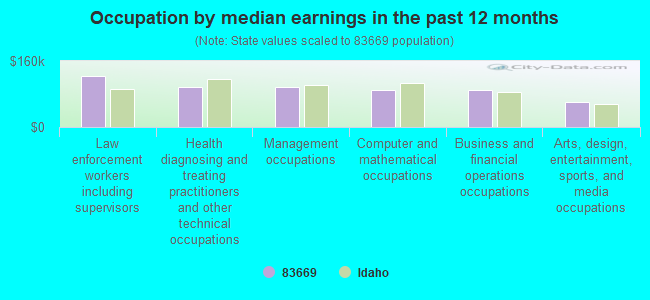
Occupation by median earnings in the past 12 months ($)
122,670Law enforcement workers including supervisors
97,655Health diagnosing and treating practitioners and other technical occupations
97,036Management occupations
89,950Computer and mathematical occupations
88,659Business and financial operations occupations
60,166Arts, design, entertainment, sports, and media occupations
Top industries in this zip code by the number of employees in 2005:
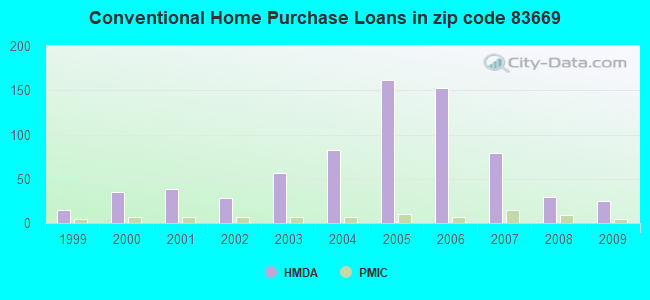
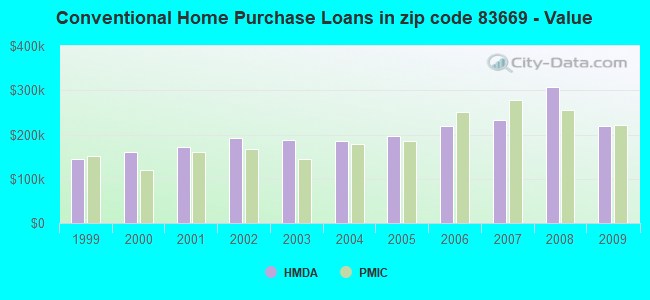
Detailed PMIC statistics for the following Tracts:0102.01
2002 - 2018 National Fire Incident Reporting System (NFIRS) incidents
Based on the data from the years 2002 - 2018 the average number of fire incidents per year is 64. The highest number of reported fire incidents - 117 took place in 2007, and the least - 21 in 2006. The data has a dropping trend.
When looking into fire subcategories, the most reports belonged to: Outside Fires (66.0%), and Structure Fires (23.4%).
Fire incident types reported to NFIRS in Zip Code 83669
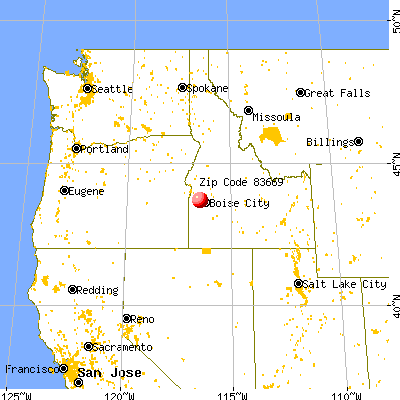


 Nearest zip codes: 83644, 83646, 83616, 83687, 83605, 83713.


 Based on the data from the years 2002 - 2018 the average number of fire incidents per year is 64. The highest number of reported fire incidents - 117 took place in 2007, and the least - 21 in 2006. The data has a dropping trend.
 When looking into fire subcategories, the most reports belonged to: Outside Fires (66.0%), and Structure Fires (23.4%).