Estimated zip code population in 2022: 35,410 Zip code population in 2010: 22,780 Zip code population in 2000: 15,111
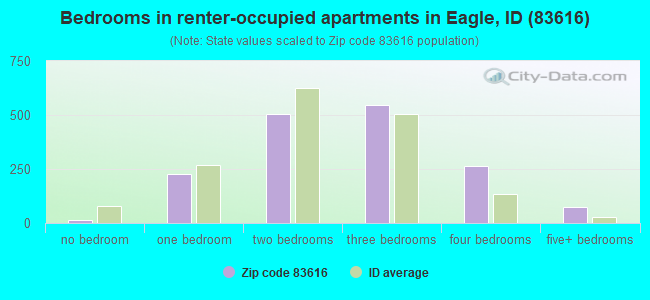
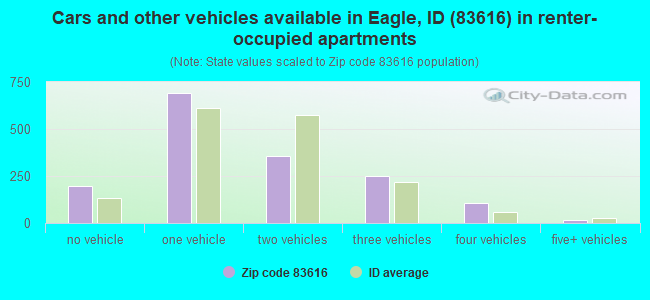
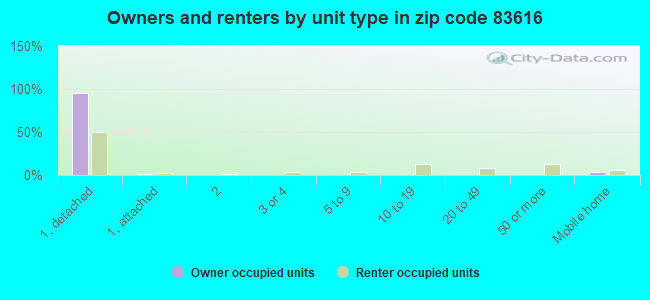
Houses and condos: 13,980 Renter-occupied apartments: 1,623
% of renters here:
12%
State:
28%
March 2022 cost of living index in zip code 83616: 97.9 (near average, U.S. average is 100)
Land area: 106.4 sq. mi. Water area: 0.7 sq. mi.
Population density: 333 people per square mile
(very low).
OSM Map
General Map
Google Map
MSN Map
OSM Map
General Map
Google Map
MSN Map
OSM Map
General Map
Google Map
MSN Map
OSM Map
General Map
Google Map
MSN Map
Please wait while loading the map...
Real estate property taxes paid for housing units in 2022:
This zip code:
0.4% ($3,691)
Idaho:
0.5% ($1,995)
Median real estate property taxes paid for housing units with mortgages in 2022: $3,702 (0.4%) Median real estate property taxes paid for housing units with no mortgage in 2022: $3,777 (0.4%)
Estimated median house/condo value in 2022: $850,783
83616:
$850,783
Idaho:
$432,500
According to our research of Idaho and other state lists, there were 4 registered sex offenders living in 83616 zip code as of April 27, 2024. The ratio of all residents to sex offenders in zip code 83616 is 6,514 to 1. The ratio of registered sex offenders to all residents in this zip code is much lower than the state average.
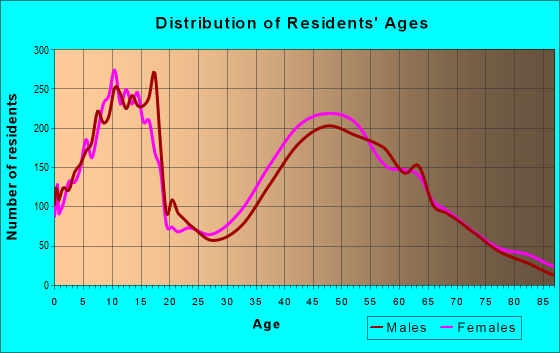
Median resident age:
This zip code:
46.8 years
Idaho median age:
37.5 years
Average household size:
This zip code:
2.6 people
Idaho:
2.6 people
Averages for the 2020 tax year for zip code 83616, filed in 2021:
Average Adjusted Gross Income (AGI) in 2020: $170,178 (Individual Income Tax Returns)
Here:
$170,178
State:
$73,627
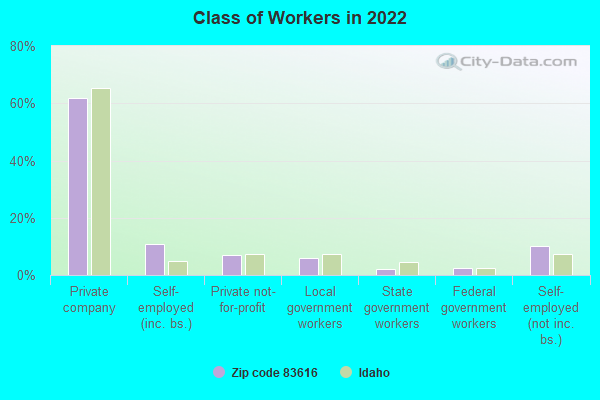
Salary/wage: $111,409 (reported on 73.3% of returns)
Here:
$111,409
State:
$55,245
(% of AGI for various income ranges: 1248.9% for AGIs below $25k, 3519.9% for AGIs $25k-50k, 5837.1% for AGIs $50k-75k, 9362.5% for AGIs $75k-100k, 18176.9% for AGIs $100k-200k, 102982.3% for AGIs over 200k)
Taxable interest for individuals: $4,640 (reported on 50.6% of returns)
This zip code:
$4,640
Idaho:
$2,230
(% of AGI for various income ranges: 49.9% for AGIs below $25k, 89.8% for AGIs $25k-50k, 144.4% for AGIs $50k-75k, 286.6% for AGIs $75k-100k, 379.0% for AGIs $100k-200k, 3269.5% for AGIs over 200k)
Ordinary dividends: $11,093 (reported on 37.6% of returns)
Here:
$11,093
State:
$7,088
(% of AGI for various income ranges: 74.4% for AGIs below $25k, 171.6% for AGIs $25k-50k, 317.8% for AGIs $50k-75k, 491.6% for AGIs $75k-100k, 774.1% for AGIs $100k-200k, 5542.3% for AGIs over 200k)
Net capital gain/loss in AGI: +$65,009 (reported on 38.4% of returns)
Here:
+$65,009
State:
+$37,284
(% of AGI for various income ranges: 37.0% for AGIs below $25k, 157.2% for AGIs $25k-50k, 340.0% for AGIs $50k-75k, 569.5% for AGIs $75k-100k, 1511.8% for AGIs $100k-200k, 46950.1% for AGIs over 200k)
Profit/loss from business: +$22,342 (reported on 20.7% of returns)
Here:
+$22,342
State:
+$12,955
(% of AGI for various income ranges: 123.3% for AGIs below $25k, 240.5% for AGIs $25k-50k, 314.9% for AGIs $50k-75k, 769.7% for AGIs $75k-100k, 1074.7% for AGIs $100k-200k, 5295.3% for AGIs over 200k)
Taxable individual retirement arrangement distribution: $29,591 (reported on 16.0% of returns)
83616:
$29,591
Idaho:
$20,110
(% of AGI for various income ranges: 115.3% for AGIs below $25k, 314.7% for AGIs $25k-50k, 639.6% for AGIs $50k-75k, 982.5% for AGIs $75k-100k, 1771.9% for AGIs $100k-200k, 3280.1% for AGIs over 200k)
Self-employed (Keogh) retirement plans: $30,510 (reported on 1.8% of returns)
83616:
$30,510
Idaho:
$25,219
(% of AGI for various income ranges: 38.3% for AGIs $50k-75k, 67.5% for AGIs $100k-200k, 925.6% for AGIs over 200k)
Total itemized deductions: $49,700 (reported on 24.0% of returns)
Here:
$49,700
State:
$38,402
(% of AGI for various income ranges: 121.7% for AGIs below $25k, 344.5% for AGIs $25k-50k, 824.7% for AGIs $50k-75k, 1218.5% for AGIs $75k-100k, 2477.3% for AGIs $100k-200k, 16106.8% for AGIs over 200k)
Charity contributions: $24,390 (reported on 21.1% of returns)
Here:
$24,390
State:
$18,314
(% of AGI for various income ranges: 7.9% for AGIs below $25k, 49.1% for AGIs $25k-50k, 127.9% for AGIs $50k-75k, 252.2% for AGIs $75k-100k, 587.4% for AGIs $100k-200k, 8864.8% for AGIs over 200k)
Taxes paid: $8,854 (reported on 23.9% of returns)
83616:
$8,854
State:
$7,596
(% of AGI for various income ranges: 20.7% for AGIs below $25k, 59.1% for AGIs $25k-50k, 175.5% for AGIs $50k-75k, 281.8% for AGIs $75k-100k, 660.4% for AGIs $100k-200k, 2293.3% for AGIs over 200k)
Earned income credit: $1,830 (reported on 5.9% of returns)
Here:
$1,830
State:
$2,195
(% of AGI for various income ranges: 42.9% for AGIs below $25k, 49.7% for AGIs $25k-50k)
Percentage of individuals using paid preparers for their 2020 taxes: 93.8%
Here:
94%
State:
94%
(% for various income ranges: 91.4% for AGIs below $25k, 91.3% for AGIs $25k-50k, 94.1% for AGIs $50k-75k, 94.6% for AGIs $75k-100k, 95.2% for AGIs $100k-200k, 96.5% for AGIs over 200k)
Averages for the 2012 tax year for zip code 83616, filed in 2013:
Average Adjusted Gross Income (AGI) in 2012: $118,681 (Individual Income Tax Returns)
Here:
$118,681
State:
$52,536
Salary/wage: $79,887 (reported on 77.9% of returns)
Here:
$79,887
State:
$41,938
(% of AGI for various income ranges: 69.3% for AGIs below $25k, 67.0% for AGIs $25k-50k, 64.0% for AGIs $50k-75k, 64.1% for AGIs $75k-100k, 69.7% for AGIs $100k-200k, 39.2% for AGIs over 200k)
Taxable interest for individuals: $3,390 (reported on 49.7% of returns)
This zip code:
$3,390
Idaho:
$1,874
(% of AGI for various income ranges: 3.2% for AGIs below $25k, 1.8% for AGIs $25k-50k, 1.7% for AGIs $50k-75k, 1.0% for AGIs $75k-100k, 1.3% for AGIs $100k-200k, 1.4% for AGIs over 200k)
Ordinary dividends: $8,764 (reported on 35.0% of returns)
Here:
$8,764
State:
$5,706
(% of AGI for various income ranges: 4.2% for AGIs below $25k, 2.3% for AGIs $25k-50k, 2.7% for AGIs $50k-75k, 1.8% for AGIs $75k-100k, 2.0% for AGIs $100k-200k, 2.9% for AGIs over 200k)
Net capital gain/loss in AGI: +$32,030 (reported on 34.1% of returns)
Here:
+$32,030
State:
+$14,571
(% of AGI for various income ranges: 0.3% for AGIs below $25k, 0.3% for AGIs $25k-50k, 1.1% for AGIs $50k-75k, 1.0% for AGIs $75k-100k, 2.7% for AGIs $100k-200k, 15.7% for AGIs over 200k)
Profit/loss from business: +$20,470 (reported on 21.7% of returns)
Here:
+$20,470
State:
+$10,113
(% of AGI for various income ranges: 10.3% for AGIs below $25k, 6.3% for AGIs $25k-50k, 4.5% for AGIs $50k-75k, 4.2% for AGIs $75k-100k, 4.0% for AGIs $100k-200k, 2.9% for AGIs over 200k)
Taxable individual retirement arrangement distribution: $21,170 (reported on 15.4% of returns)
83616:
$21,170
Idaho:
$14,642
(% of AGI for various income ranges: 5.4% for AGIs below $25k, 5.2% for AGIs $25k-50k, 5.6% for AGIs $50k-75k, 5.3% for AGIs $75k-100k, 3.8% for AGIs $100k-200k, 1.2% for AGIs over 200k)
Self-employment retirement plans: $27,680 (reported on 1.4% of returns)
83616:
$27,680
Idaho:
$20,719
(% of AGI for various income ranges: 0.4% for AGIs $25k-50k, 0.3% for AGIs $100k-200k, 0.5% for AGIs over 200k)
Total itemized deductions: $34,633 (18% of AGI, reported on 53.3% of returns)
Here:
$34,633
State:
$22,697
Here:
17.8% of AGI
State:
22.0% of AGI
(% of AGI for various income ranges: 21.4% for AGIs below $25k, 18.0% for AGIs $25k-50k, 18.3% for AGIs $50k-75k, 18.6% for AGIs $75k-100k, 19.0% for AGIs $100k-200k, 12.7% for AGIs over 200k)
Charity contributions: $7,601 (reported on 47.3% of returns)
Here:
$7,601
State:
$5,246
(% of AGI for various income ranges: 1.9% for AGIs below $25k, 1.9% for AGIs $25k-50k, 2.7% for AGIs $50k-75k, 2.9% for AGIs $75k-100k, 3.1% for AGIs $100k-200k, 3.2% for AGIs over 200k)
Taxes paid: $13,602 (reported on 53.0% of returns)
83616:
$13,602
State:
$7,139
(% of AGI for various income ranges: 3.9% for AGIs below $25k, 3.5% for AGIs $25k-50k, 4.8% for AGIs $50k-75k, 5.4% for AGIs $75k-100k, 7.0% for AGIs $100k-200k, 6.2% for AGIs over 200k)
Earned income credit: $1,908 (reported on 9.4% of returns)
Here:
$1,908
State:
$2,213
(% of AGI for various income ranges: 3.9% for AGIs below $25k, 0.9% for AGIs $25k-50k)
Percentage of individuals using paid preparers for their 2012 taxes: 59.1%
Here:
59%
State:
52%
(% for various income ranges: 47.4% for AGIs below $25k, 55.4% for AGIs $25k-50k, 60.2% for AGIs $50k-75k, 63.4% for AGIs $75k-100k, 65.0% for AGIs $100k-200k, 80.4% for AGIs over 200k)
Averages for the 2004 tax year for zip code 83616, filed in 2005:
Average Adjusted Gross Income (AGI) in 2004: $92,039 (Individual Income Tax Returns)
Here:
$92,039
State:
$42,679
Salary/wage: $67,942 (reported on 81.2% of returns)
Here:
$67,942
State:
$35,636
(% of AGI for various income ranges: 69.1% for AGIs $10k-25k, 71.9% for AGIs $25k-50k, 72.7% for AGIs $50k-75k, 77.3% for AGIs $75k-100k, 52.0% for AGIs over 100k)
Taxable interest for individuals: $3,893 (reported on 57.7% of returns)
This zip code:
$3,893
Idaho:
$2,024
(% of AGI for various income ranges: 4.0% for AGIs $10k-25k, 2.4% for AGIs $25k-50k, 1.7% for AGIs $50k-75k, 1.7% for AGIs $75k-100k, 2.4% for AGIs over 100k)
Taxable dividends: $3,318 (reported on 40.8% of returns)
Here:
$3,318
State:
$2,917
(% of AGI for various income ranges: 2.7% for AGIs $10k-25k, 2.0% for AGIs $25k-50k, 1.2% for AGIs $50k-75k, 1.4% for AGIs $75k-100k, 1.2% for AGIs over 100k)
Net capital gain/loss: +$22,871 (reported on 40.3% of returns)
Here:
+$22,871
State:
+$13,146
(% of AGI for various income ranges: 2.5% for AGIs $10k-25k, 1.9% for AGIs $25k-50k, 2.0% for AGIs $50k-75k, 2.4% for AGIs $75k-100k, 12.8% for AGIs over 100k)
Profit/loss from business: +$17,946 (reported on 22.0% of returns)
Here:
+$17,946
State:
+$8,765
(% of AGI for various income ranges: 7.2% for AGIs $10k-25k, 6.8% for AGIs $25k-50k, 4.7% for AGIs $50k-75k, 4.4% for AGIs $75k-100k, 3.9% for AGIs over 100k)
IRA payment deduction: $3,535 (reported on 4.2% of returns)
83616:
$3,535
Idaho:
$3,020
(% of AGI for various income ranges: 0.3% for AGIs $10k-25k, 0.5% for AGIs $25k-50k, 0.3% for AGIs $50k-75k, 0.2% for AGIs $75k-100k, 0.1% for AGIs over 100k)
Self-employed pension: $15,603 (reported on 2.0% of returns)
Here:
$15,603
Idaho:
$14,427
(% of AGI for various income ranges: 0.2% for AGIs $25k-50k, 0.2% for AGIs $50k-75k, 0.2% for AGIs $75k-100k, 0.4% for AGIs over 100k)
Total itemized deductions: $29,121 (21% of AGI, reported on 59.5% of returns)
Here:
$29,121
State:
$18,385
Here:
20.5% of AGI
State:
23.1% of AGI
(% of AGI for various income ranges: 21.3% for AGIs $10k-25k, 22.9% for AGIs $25k-50k, 23.6% for AGIs $50k-75k, 22.8% for AGIs $75k-100k, 16.5% for AGIs over 100k)
Charity contributions deductions: $5,037 (3% of AGI, reported on 54.2% of returns)
Here:
$5,037
State:
$3,875
Here:
3.4% of AGI
State:
4.6% of AGI
(% of AGI for various income ranges: 1.8% for AGIs $10k-25k, 2.7% for AGIs $25k-50k, 3.3% for AGIs $50k-75k, 3.0% for AGIs $75k-100k, 2.9% for AGIs over 100k)
Total tax: $18,805 (reported on 80.6% of returns)
83616:
$18,805
State:
$6,282
(% of AGI for various income ranges: 4.6% for AGIs $10k-25k, 6.4% for AGIs $25k-50k, 7.7% for AGIs $50k-75k, 8.8% for AGIs $75k-100k, 19.9% for AGIs over 100k)
Earned income credit: $1,533 (reported on 7.3% of returns)
Here:
$1,533
State:
$1,660
Percentage of individuals using paid preparers for their 2004 taxes: 61.0%
Here:
61%
State:
59%
(% for various income ranges: 50.6% for AGIs below $10k, 57.5% for AGIs $10k-25k, 62.7% for AGIs $25k-50k, 62.2% for AGIs $50k-75k, 60.2% for AGIs $75k-100k, 69.2% for AGIs over 100k)
Likely homosexual households (counted as self-reported same-sex unmarried-partner households)
Lesbian couples: 0.1% of all households
Gay men: 0.0% of all households
Household received Food Stamps/SNAP in the past 12 months: 315 Household did not receive Food Stamps/SNAP in the past 12 months: 13,251
Women who had a birth in the past 12 months: 130 (90 now married, 41 unmarried) Women who did not have a birth in the past 12 months: 6,451 (3,440 now married, 3,022 unmarried)
Housing units in zip code 83616 with a mortgage: 7,572 (846 second mortgage, 771 both second mortgage and home equity loan) Houses without a mortgage: 487
Median monthly owner costs for units with a mortgage: $2,222 Median monthly owner costs for units without a mortgage: $611
Residents with income below the poverty level in 2022:
This zip code:
7.1%
Whole state:
10.7%
Residents with income below 50% of the poverty level in 2022:
This zip code:
2.2%
Whole state:
6.1%
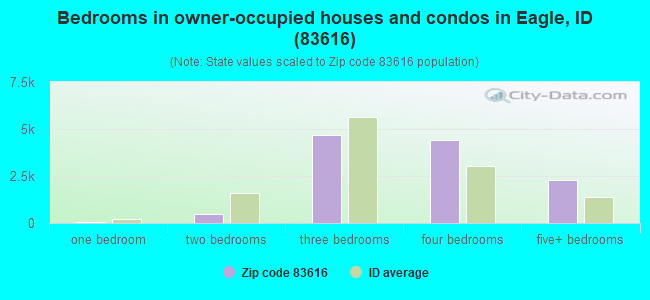
Median number of rooms in houses and condos:
Here:
7.6
State:
6.5
Median number of rooms in apartments:
Here:
5.2
State:
4.4
Notable locations in this zip code not listed on our city pages
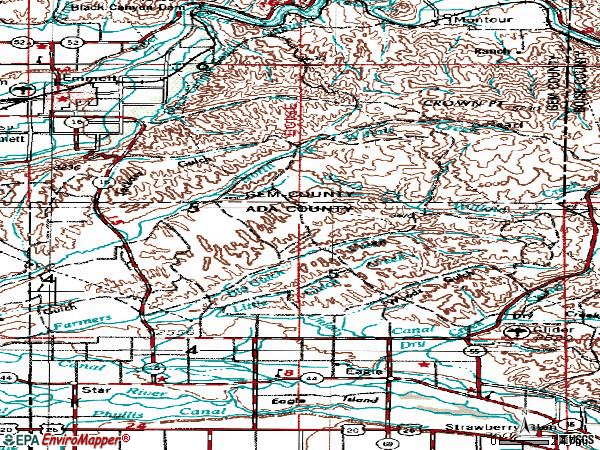
Notable locations in zip code 83616: Eagle Hatchery (A), Pleasant View School (B), Eagle Island Prison Farm (C), Eagle Fire Protection District Station 3 (D), Eagle Fire Protection District Station 2 (E), Ada County Paramedics Medical Station 59 (F), Eagle Fire Protection District Station 1 (G). Display/hide their locations on the map
Creeks: Big Gulch Creek (A), Goose Creek (B), Little Gulch Creek (C), North Fork Willow Creek (D), Schiller Creek (E), South Fork Willow Creek (F), Dry Creek (G). Display/hide their locations on the map
6,720 married couples with children.
1,163 single-parent households (438 men, 725 women).
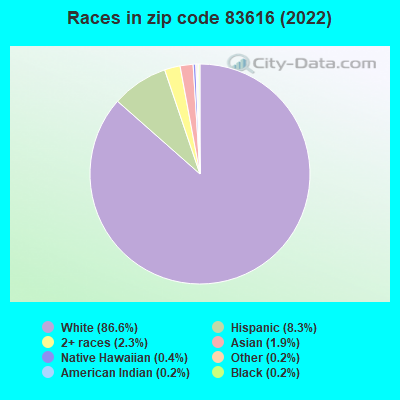
93.2% of residents of 83616 zip code speak English at home.
3.4% of residents speak Spanish at home (65% very well, 3% well, 21% not well, 10% not at all).
2.4% of residents speak other Indo-European language at home (81% very well, 16% well, 2% not well, 1% not at all).
1.2% of residents speak Asian or Pacific Island language at home (29% very well, 42% well, 30% not well).
0.1% of residents speak other language at home (100% very well).
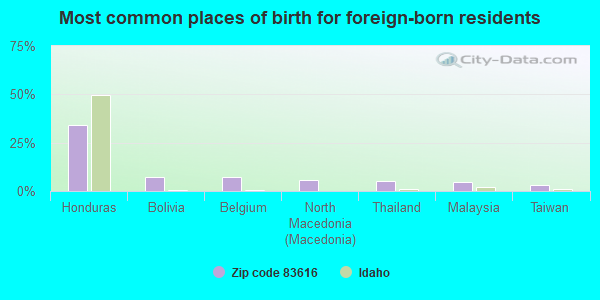
Foreign born population: 2,116 (6.0%) (62.5% of them are naturalized citizens)
This zip code:
6.0%
Whole state:
6.0%
34%Honduras
7%Bolivia
7%Belgium
6%North Macedonia (Macedonia)
5%Thailand
5%Malaysia
3%Taiwan
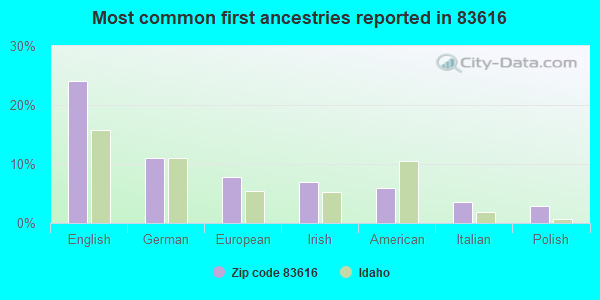
24%English
11%German
8%European
7%Irish
6%American
3%Italian
3%Polish
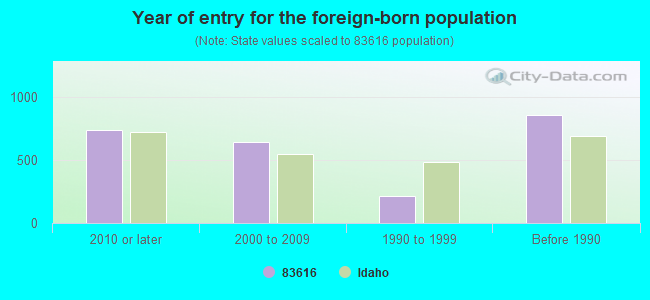
Year of entry for the foreign-born population
7342010 or later
6412000 to 2009
2111990 to 1999
856Before 1990
Major facilities with environmental interests located in this zip code:
PADDY ROW SUBDIVISION (150 SOUTH 2ND STREET in EAGLE, ID)
(Integrated Compliance Information System) - ICIS-10-2004-0125, FORMAL ENFORCEMENT ACTION, ICIS-10-2005-0014, National Pollutant Discharge Elimination System NON-MAJOR (Tracking pollutant discharge elimination systems) - permit - ICIS-10-2005-0014, ENFORCEMENT/COMPLIANCE ACTIVITY, ICIS-, National Pollutant Discharge Elimination System NON-MAJOR (Tracking pollutant discharge elimination systems) - permit - ICIS-10-2005-0014, ENFORCEMENT/COMPLIANCE ACTIVITY, ICIS-, Business SIC classification: GENERAL CONTRACTORS-RESIDENTIAL BUILDINGS, OTHER THAN SINGLE-FAMILY Alternative names: MASCO INC, ROTH CONSTRUCTION INC
IDAHO FEED LOT CO (6477 BEACON LIGHT RD in EAGLE, ID)
(Integrated Compliance Information System) - ICIS-10-1997-0068, FORMAL ENFORCEMENT ACTION, ICIS-10-1994-0232, National Pollutant Discharge Elimination System NON-MAJOR (Tracking pollutant discharge elimination systems) - permit (Resource Conservation and Recovery Act (tracking hazardous waste)) Business SIC classification: BEEF CATTLE FEEDLOTS Organizations: RICH HORMEACHEA (CONTACT/OWNER)
Alternative names: IDAHO FEEDLOT COMPANY
EAGLE ELEMENTARY SCHOOL (475 NORTH EAGLE ROAD in EAGLE, ID)
(Geographic Names Information System) (National Center for Education Statistics) - STATE ID-002 105 Organizations: MERIDIAN JOINT SCHOOL DISTRICT 2 (SCHOOL DISTRICT)
EAGLE HILLS ELEMENTARY SCHOOL (650 RANCH DRIVE in EAGLE, ID)
(Geographic Names Information System) (National Center for Education Statistics) - STATE ID-002 113 Organizations: MERIDIAN JOINT SCHOOL DISTRICT 2 (SCHOOL DISTRICT)
SENORA CREEK SUBDIVISON (OFF LINDER RD, SOUTH OF in EAGLE, ID)
National Pollutant Discharge Elimination System NON-MAJOR (Tracking pollutant discharge elimination systems) - permit - ICIS-10-2005-0064, ENFORCEMENT/COMPLIANCE ACTIVITY, ICIS-, Business SIC classification: GENERAL CONTRACTORS-SINGLE-FAMILY HOUSES Alternative names: GOLDCREEK DEVELOPERS LLC
EAGLE ACADEMY (100 SOUTH ACADEMY AVENUE in EAGLE, ID)
(National Center for Education Statistics) - STATE ID-002 492 Organizations: MERIDIAN JOINT SCHOOL DISTRICT 2 (SCHOOL DISTRICT)
EAGLE HIGH SCHOOL (574 NORTH PARK LANE in EAGLE, ID)
(National Center for Education Statistics) - STATE ID-002 406 Organizations: MERIDIAN JOINT SCHOOL DISTRICT 2 (SCHOOL DISTRICT)
EAGLE MIDDLE SCHOOL (1000 WEST FLOATING FEATHER in EAGLE, ID)
(National Center for Education Statistics) - STATE ID-002 604 Organizations: MERIDIAN JOINT SCHOOL DISTRICT 2 (SCHOOL DISTRICT)
SEVEN OAKS ELEMENTARY (1441 SOUTH SEVENOAKES WAY in EAGLE, ID)
(National Center for Education Statistics) - STATE ID-002 129 Organizations: MERIDIAN JOINT SCHOOL DISTRICT 2 (SCHOOL DISTRICT)
ALBERTSONS INC STORE 182 EAGLE (250 S EAGLE RD in EAGLE, ID)
(Resource Conservation and Recovery Act (tracking hazardous waste))
GLIDER AIR PARK (HWY 55 in EAGLE, ID)
(Resource Conservation and Recovery Act (tracking hazardous waste)) Organizations: J A TERTELING (CONTACT/OWNER)
HOME DEPOT 1809 (2808 E STATE ST in EAGLE, ID)
Conditionally Exempt Small Quantity Generators, less than 100 kg/month of hazardous waste (Resource Conservation and Recovery Act (tracking hazardous waste)) Organizations: HOME DEPOT USA (CONTACT/OPERATOR)
KELLY MOORE PAINT CO INC EAGLE (127 E STATE ST in EAGLE, ID)
Small Quantity Generators, between 100 kg and 1000 kg of hazardous waste/month (Resource Conservation and Recovery Act (tracking hazardous waste))
Housing units lacking complete plumbing facilities: 0.4% Housing units lacking complete kitchen facilities: 1.1%
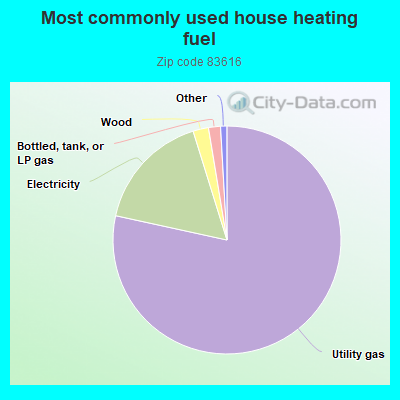
78.5%Utility gas
16.8%Electricity
2.2%Wood
1.7%Bottled, tank, or LP gas
Population in 1990: 6,874. Population change in the 1990s: +8,237 (+119.8%).
Place of birth for U.S.-born residents:
This state: 10,887
Northeast: 1,423
Midwest: 3,153
South: 2,341
West: 15,368
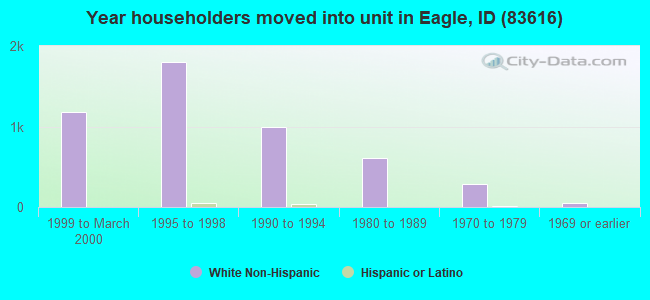
43% of the 83616 zip code residents lived in the same house 5 years ago. Out of people who lived in different houses, 51% lived in this county. Out of people who lived in different counties, 50% lived in Idaho.
87% of the 83616 zip code residents lived in the same house 1 year ago. Out of people who lived in different houses, 38% moved from this county. Out of people who lived in different houses, 7% moved from different county within same state. Out of people who lived in different houses, 51% moved from different state. Out of people who lived in different houses, 4% moved from abroad.
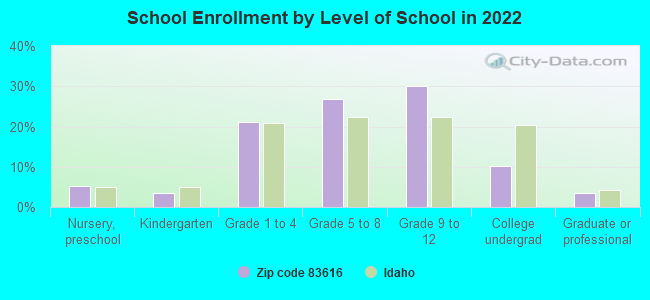
Private vs. public school enrollment:
Students in private schools in grades 1 to 8 (elementary and middle school): 1,226
Here:
29.2%
Idaho:
13.5%
Students in private schools in grades 9 to 12 (high school): 297
Here:
11.6%
Idaho:
8.5%
Students in private undergraduate colleges: 112
Here:
12.7%
Idaho:
30.0%
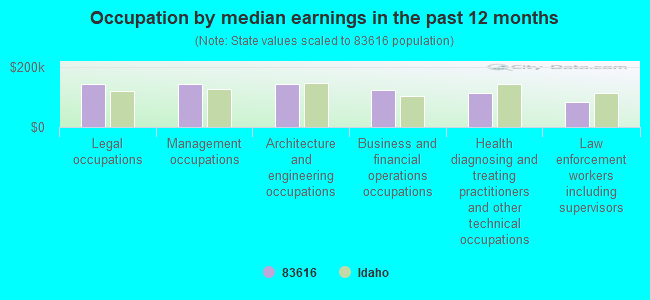
Occupation by median earnings in the past 12 months ($)
145,365Legal occupations
144,927Management occupations
144,221Architecture and engineering occupations
125,735Business and financial operations occupations
113,219Health diagnosing and treating practitioners and other technical occupations
84,493Law enforcement workers including supervisors
Companies with federal contracts located in this zip code (EAGLE, ID):
TRACE INC (4380 W BEACON LIGHT RD) : $85,279,651 in 216 contractsfrom 1999 to 2006
Contracts for Landscaping/Groundskeeping Services, Other Housekeeping Services by Air Force, Defense Commissary Agency, Department of Defense, Navy, and others Signed by year:2000: $8,156,344; 2001: $11,051,049; 2002: $13,744,226; 2003: $14,032,794; 2004: $18,007,020; 2005: $12,091,777; 2006: $6,210,064.
Biggest contracts:
$2,400,700 with Air Force for Landscaping/Groundskeeping Services. Taking place in OK. Signed on 2005-10-01. Completion date: 2006-09-30.
$1,962,990, same as above.Signed on 2004-12-01. Completion date: 2006-09-30.
$1,878,626 with Defense Commissary Agency for Other Housekeeping Services. Taking place in AZ. Signed on 2005-03-01. Completion date: 2006-02-28.
$1,747,274 with Department of Defense for Other Housekeeping Services. Taking place in AZ. Signed on 2003-06-30. Completion date: 2002-06-01.
GEMINI TECHNOLOGIES, INC (1117 E PLAZA DR, STE C1; small business) : $258,225 in 11 contractsfrom 2003 to 2005
Contracts for Miscellaneous Weapons, Guns, through 30 mm, Miscellaneous Special Industry Machinery, Hardware, Weapon System, and moreby Army, Navy Signed by year:2000: $0; 2001: $0; 2002: $0; 2003: $11,420; 2004: $13,920; 2005: $232,885; 2006: $0.
Biggest contracts:
$59,137 with Army for Miscellaneous Weapons. Signed on 2005-02-11. Completion date: 2005-04-15.
$50,112 with Army for Guns, through 30 mm. Signed on 2005-06-30. Completion date: 2005-09-06.
$48,081, same as above.Signed on 2005-09-28. Completion date: 2005-10-27.
$31,078 with Navy for Miscellaneous Weapons. Signed on 2005-02-25. Completion date: 2005-03-10.
STEED CONSTRUCTION, INC. (1250 E IR EGLE DR STE 200; small business) 35 employees, $27912585 revenue. : $222,232 in 12 contractsfrom 2003 to 2004
Contracts for Construction of Structures and Facilities -- Office Buildings by Public Buildings Service Signed by year:2000: $0; 2001: $0; 2002: $0; 2003: $104,034; 2004: $118,198; 2005: $0; 2006: $0.
Biggest contracts:
$75,427 with Public Buildings Service for Construction of Structures and Facilities -- Office Buildings. Signed on 2004-12-14. Completion date: 2004-12-31.
$38,741, same as above.Signed on 2003-06-15. Completion date: 2002-06-15.
$35,264, same as above.Signed on 2003-05-15. Completion date: 2002-06-15.
$25,152, same as above.Signed on 2003-04-15. Completion date: 2002-06-15.
GREG POE AIR SHOWS LLC (738 S WATERTON AVE; small business) : $14,500 in 2 contractsfrom 2005 to 2006
$8,500 with Air Force for Recreational Services. Taking place in AR. Signed on 2005-09-12. Completion date: 2005-10-09.
$6,000 with Air Force for Other Professional Services. Taking place in UT. Signed on 2006-06-09. Completion date: 2006-06-11.
REALVISION INC (1092 PARKINSON RD; small business) : $14,369 in 3 contractsfrom 2003 to 2005
$5,025 with Army for Other ADP and Telecommunications Services (includes data storage on tapes, compact disks, etc.). Taking place in NY. Signed on 2005-09-19. Completion date: 2005-09-30.
$4,786, same as above.Signed on 2004-09-13. Completion date: 2005-09-30.
$4,558, same as above.Signed on 2003-10-02. Completion date: 2004-09-30.
FIREBIRD RACEWAY (8551 HIGHWAY 16; small business) : $8,170 in 2 contractsfrom 2005 to 2006
$5,145 with Army for Advertising Services. Signed on 2006-02-24. Completion date: 2006-03-10.
$3,025 with Army for Public Relations Services(includes writing services, event planning and management, media relations, radio and television analysis, and press services). Signed on 2005-09-19. Completion date: 2005-09-18.
Top industries in this zip code by the number of employees in 2005:
2002 - 2018 National Fire Incident Reporting System (NFIRS) incidents
Based on the data from the years 2002 - 2018 the average number of fires per year is 98. The highest number of reported fire incidents - 132 took place in 2003, and the least - 66 in 2012. The data has a decreasing trend.
When looking into fire subcategories, the most reports belonged to: Outside Fires (53.0%), and Structure Fires (32.9%).
Fire incident types reported to NFIRS in Zip Code 83616


 Nearest zip codes: 83669, 83714, 83646, 83713, 83704, 83644.
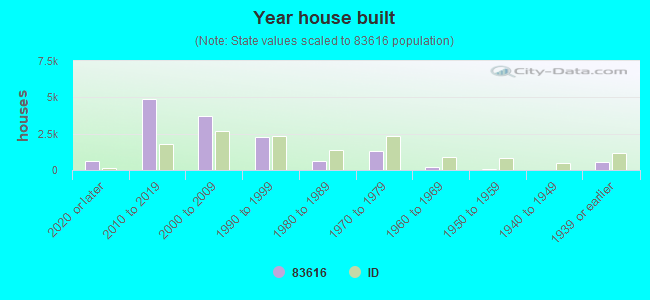


 Based on the data from the years 2002 - 2018 the average number of fires per year is 98. The highest number of reported fire incidents - 132 took place in 2003, and the least - 66 in 2012. The data has a decreasing trend.
 When looking into fire subcategories, the most reports belonged to: Outside Fires (53.0%), and Structure Fires (32.9%).