Estimated zip code population in 2022: 42,375 Zip code population in 2010: 39,628 Zip code population in 2000: 38,744
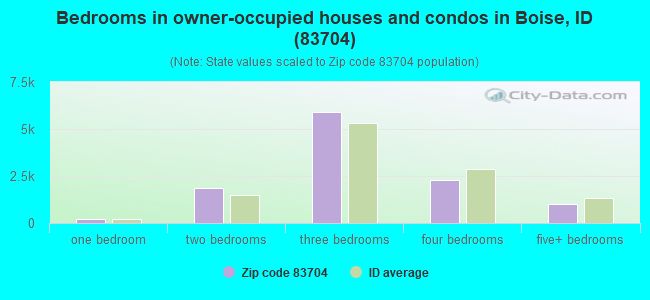
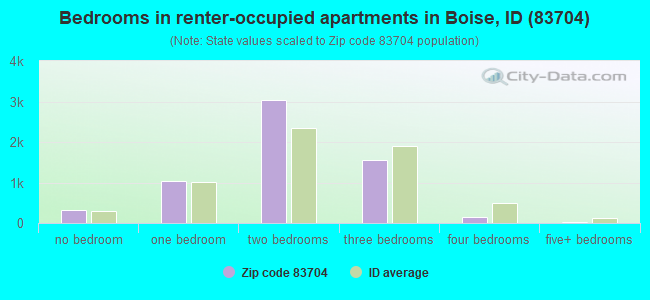
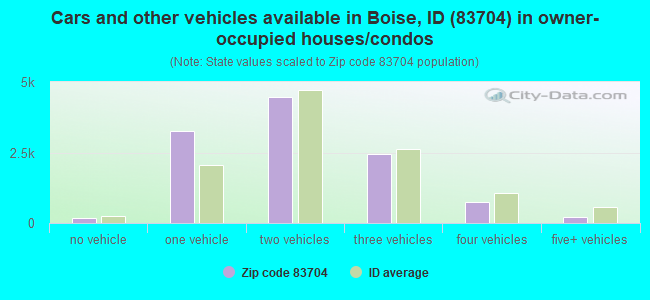
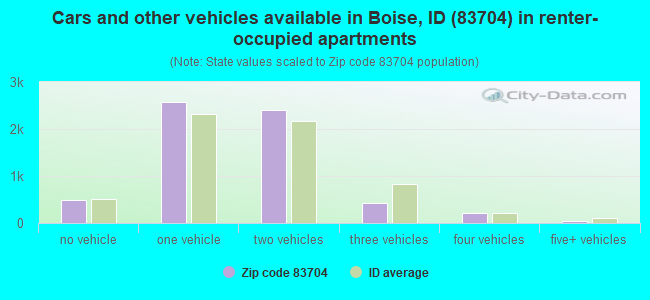
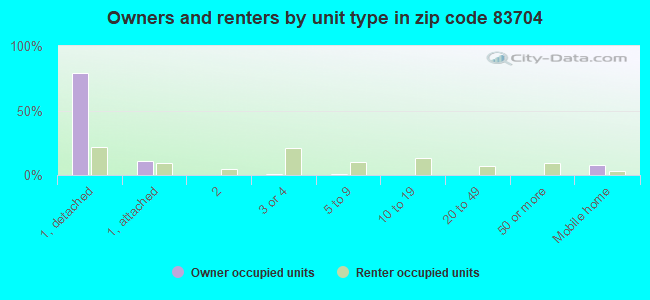
Houses and condos: 18,142 Renter-occupied apartments: 6,198
% of renters here:
35%
State:
28%
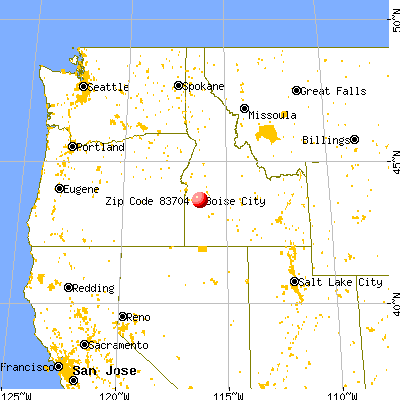
March 2022 cost of living index in zip code 83704: 94.7 (less than average, U.S. average is 100)
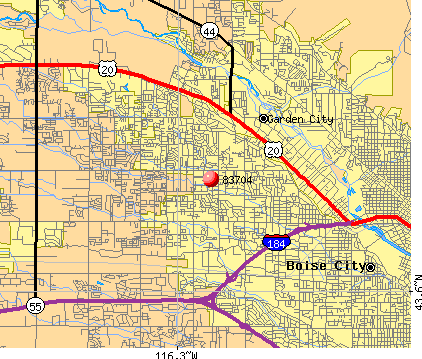
Land area: 8.8 sq. mi. Water area: 0.0 sq. mi.
Population density: 4,839 people per square mile
(average).
OSM Map
General Map
Google Map
MSN Map
OSM Map
General Map
Google Map
MSN Map
OSM Map
General Map
Google Map
MSN Map
OSM Map
General Map
Google Map
MSN Map
Please wait while loading the map...
Real estate property taxes paid for housing units in 2022:
This zip code:
0.5% ($2,031)
Idaho:
0.5% ($1,995)
Median real estate property taxes paid for housing units with mortgages in 2022: $2,065 (0.5%) Median real estate property taxes paid for housing units with no mortgage in 2022: $2,011 (0.5%)
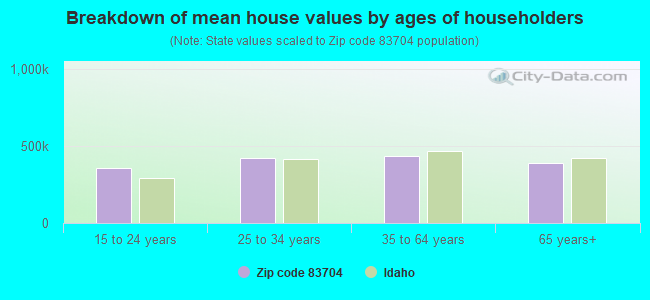
Estimated median house/condo value in 2022: $418,544
83704:
$418,544
Idaho:
$432,500
According to our research of Idaho and other state lists, there were 17 registered sex offenders living in 83704 zip code as of April 27, 2024. The ratio of all residents to sex offenders in zip code 83704 is 2,403 to 1. The ratio of registered sex offenders to all residents in this zip code is much lower than the state average.
Median resident age:
This zip code:
39.0 years
Idaho median age:
37.5 years
Average household size:
This zip code:
2.4 people
Idaho:
2.6 people
Averages for the 2020 tax year for zip code 83704, filed in 2021:
Average Adjusted Gross Income (AGI) in 2020: $52,840 (Individual Income Tax Returns)
Here:
$52,840
State:
$73,627
Salary/wage: $44,999 (reported on 83.4% of returns)
Here:
$44,999
State:
$55,245
(% of AGI for various income ranges: 1305.5% for AGIs below $25k, 3943.3% for AGIs $25k-50k, 7070.1% for AGIs $50k-75k, 10174.2% for AGIs $75k-100k, 18255.3% for AGIs $100k-200k, 66309.0% for AGIs over 200k)
Taxable interest for individuals: $1,448 (reported on 23.2% of returns)
This zip code:
$1,448
Idaho:
$2,230
(% of AGI for various income ranges: 12.3% for AGIs below $25k, 16.9% for AGIs $25k-50k, 40.7% for AGIs $50k-75k, 88.7% for AGIs $75k-100k, 161.5% for AGIs $100k-200k, 1983.0% for AGIs over 200k)
Ordinary dividends: $4,462 (reported on 15.3% of returns)
Here:
$4,462
State:
$7,088
(% of AGI for various income ranges: 23.1% for AGIs below $25k, 28.1% for AGIs $25k-50k, 84.3% for AGIs $50k-75k, 140.7% for AGIs $75k-100k, 380.7% for AGIs $100k-200k, 4323.0% for AGIs over 200k)
Net capital gain/loss in AGI: +$12,204 (reported on 15.0% of returns)
Here:
+$12,204
State:
+$37,284
(% of AGI for various income ranges: 10.1% for AGIs below $25k, 22.7% for AGIs $25k-50k, 62.1% for AGIs $50k-75k, 177.2% for AGIs $75k-100k, 849.2% for AGIs $100k-200k, 24266.0% for AGIs over 200k)
Profit/loss from business: +$11,367 (reported on 14.3% of returns)
Here:
+$11,367
State:
+$12,955
(% of AGI for various income ranges: 124.6% for AGIs below $25k, 113.4% for AGIs $25k-50k, 228.3% for AGIs $50k-75k, 424.0% for AGIs $75k-100k, 732.0% for AGIs $100k-200k, 4613.0% for AGIs over 200k)
Taxable individual retirement arrangement distribution: $16,655 (reported on 8.3% of returns)
83704:
$16,655
Idaho:
$20,110
(% of AGI for various income ranges: 52.0% for AGIs below $25k, 82.3% for AGIs $25k-50k, 203.2% for AGIs $50k-75k, 370.1% for AGIs $75k-100k, 904.4% for AGIs $100k-200k, 4244.0% for AGIs over 200k)
Self-employed (Keogh) retirement plans: $21,100 (reported on 0.2% of returns)
83704:
$21,100
Idaho:
$25,219
(% of AGI for various income ranges: 81.2% for AGIs $100k-200k)
Total itemized deductions: $29,669 (reported on 5.4% of returns)
Here:
$29,669
State:
$38,402
(% of AGI for various income ranges: 40.4% for AGIs below $25k, 66.7% for AGIs $25k-50k, 240.2% for AGIs $50k-75k, 414.1% for AGIs $75k-100k, 869.8% for AGIs $100k-200k, 8972.0% for AGIs over 200k)
Charity contributions: $9,785 (reported on 4.1% of returns)
Here:
$9,785
State:
$18,314
(% of AGI for various income ranges: 2.4% for AGIs below $25k, 9.1% for AGIs $25k-50k, 34.4% for AGIs $50k-75k, 78.6% for AGIs $75k-100k, 272.6% for AGIs $100k-200k, 3236.0% for AGIs over 200k)
Taxes paid: $6,559 (reported on 5.4% of returns)
83704:
$6,559
State:
$7,596
(% of AGI for various income ranges: 4.4% for AGIs below $25k, 12.4% for AGIs $25k-50k, 53.1% for AGIs $50k-75k, 113.6% for AGIs $75k-100k, 258.8% for AGIs $100k-200k, 1398.0% for AGIs over 200k)
Earned income credit: $2,014 (reported on 15.8% of returns)
Here:
$2,014
State:
$2,195
(% of AGI for various income ranges: 74.9% for AGIs below $25k, 56.6% for AGIs $25k-50k, 1.5% for AGIs $50k-75k)
Percentage of individuals using paid preparers for their 2020 taxes: 93.1%
Here:
93%
State:
94%
(% for various income ranges: 91.3% for AGIs below $25k, 94.1% for AGIs $25k-50k, 94.4% for AGIs $50k-75k, 93.6% for AGIs $75k-100k, 93.2% for AGIs $100k-200k, 95.0% for AGIs over 200k)
Averages for the 2012 tax year for zip code 83704, filed in 2013:
Average Adjusted Gross Income (AGI) in 2012: $43,164 (Individual Income Tax Returns)
Here:
$43,164
State:
$52,536
Salary/wage: $36,465 (reported on 84.1% of returns)
Here:
$36,465
State:
$41,938
(% of AGI for various income ranges: 77.8% for AGIs below $25k, 81.6% for AGIs $25k-50k, 74.5% for AGIs $50k-75k, 72.7% for AGIs $75k-100k, 68.6% for AGIs $100k-200k, 36.9% for AGIs over 200k)
Taxable interest for individuals: $1,442 (reported on 27.0% of returns)
This zip code:
$1,442
Idaho:
$1,874
(% of AGI for various income ranges: 0.8% for AGIs below $25k, 0.5% for AGIs $25k-50k, 0.7% for AGIs $50k-75k, 0.7% for AGIs $75k-100k, 1.0% for AGIs $100k-200k, 2.2% for AGIs over 200k)
Ordinary dividends: $4,026 (reported on 16.9% of returns)
Here:
$4,026
State:
$5,706
(% of AGI for various income ranges: 1.3% for AGIs below $25k, 0.9% for AGIs $25k-50k, 1.3% for AGIs $50k-75k, 1.3% for AGIs $75k-100k, 1.8% for AGIs $100k-200k, 3.6% for AGIs over 200k)
Net capital gain/loss in AGI: +$5,303 (reported on 13.9% of returns)
Here:
+$5,303
State:
+$14,571
(% of AGI for various income ranges: 0.3% for AGIs $25k-50k, 0.5% for AGIs $50k-75k, 0.5% for AGIs $75k-100k, 2.2% for AGIs $100k-200k, 10.0% for AGIs over 200k)
Profit/loss from business: +$9,619 (reported on 14.0% of returns)
Here:
+$9,619
State:
+$10,113
(% of AGI for various income ranges: 6.1% for AGIs below $25k, 2.8% for AGIs $25k-50k, 2.5% for AGIs $50k-75k, 2.5% for AGIs $75k-100k, 1.9% for AGIs $100k-200k, 4.4% for AGIs over 200k)
Taxable individual retirement arrangement distribution: $13,066 (reported on 10.1% of returns)
83704:
$13,066
Idaho:
$14,642
(% of AGI for various income ranges: 2.8% for AGIs below $25k, 2.1% for AGIs $25k-50k, 3.2% for AGIs $50k-75k, 3.3% for AGIs $75k-100k, 4.3% for AGIs $100k-200k, 2.5% for AGIs over 200k)
Self-employment retirement plans: $17,000 (reported on 0.3% of returns)
83704:
$17,000
Idaho:
$20,719
Total itemized deductions: $18,757 (23% of AGI, reported on 27.2% of returns)
Here:
$18,757
State:
$22,697
Here:
22.7% of AGI
State:
22.0% of AGI
(% of AGI for various income ranges: 7.8% for AGIs below $25k, 9.1% for AGIs $25k-50k, 12.7% for AGIs $50k-75k, 13.6% for AGIs $75k-100k, 14.3% for AGIs $100k-200k, 13.8% for AGIs over 200k)
Charity contributions: $4,297 (reported on 22.3% of returns)
Here:
$4,297
State:
$5,246
(% of AGI for various income ranges: 0.7% for AGIs below $25k, 1.1% for AGIs $25k-50k, 1.9% for AGIs $50k-75k, 2.7% for AGIs $75k-100k, 3.1% for AGIs $100k-200k, 4.7% for AGIs over 200k)
Taxes paid: $5,654 (reported on 27.1% of returns)
83704:
$5,654
State:
$7,139
(% of AGI for various income ranges: 1.2% for AGIs below $25k, 1.9% for AGIs $25k-50k, 3.1% for AGIs $50k-75k, 4.0% for AGIs $75k-100k, 5.6% for AGIs $100k-200k, 6.4% for AGIs over 200k)
Earned income credit: $2,101 (reported on 21.2% of returns)
Here:
$2,101
State:
$2,213
(% of AGI for various income ranges: 5.7% for AGIs below $25k, 1.2% for AGIs $25k-50k)
Percentage of individuals using paid preparers for their 2012 taxes: 44.3%
Here:
44%
State:
52%
(% for various income ranges: 39.2% for AGIs below $25k, 43.3% for AGIs $25k-50k, 50.4% for AGIs $50k-75k, 52.7% for AGIs $75k-100k, 55.0% for AGIs $100k-200k, 78.9% for AGIs over 200k)
Averages for the 2004 tax year for zip code 83704, filed in 2005:
Average Adjusted Gross Income (AGI) in 2004: $40,734 (Individual Income Tax Returns)
Here:
$40,734
State:
$42,679
Salary/wage: $35,106 (reported on 85.4% of returns)
Here:
$35,106
State:
$35,636
(% of AGI for various income ranges: 146.0% for AGIs below $10k, 80.1% for AGIs $10k-25k, 83.0% for AGIs $25k-50k, 78.9% for AGIs $50k-75k, 77.1% for AGIs $75k-100k, 53.6% for AGIs over 100k)
Taxable interest for individuals: $1,851 (reported on 37.7% of returns)
This zip code:
$1,851
Idaho:
$2,024
(% of AGI for various income ranges: 7.8% for AGIs below $10k, 1.9% for AGIs $10k-25k, 1.2% for AGIs $25k-50k, 1.1% for AGIs $50k-75k, 1.1% for AGIs $75k-100k, 2.6% for AGIs over 100k)
Taxable dividends: $2,398 (reported on 23.5% of returns)
Here:
$2,398
State:
$2,917
(% of AGI for various income ranges: 6.0% for AGIs below $10k, 1.6% for AGIs $10k-25k, 1.0% for AGIs $25k-50k, 1.1% for AGIs $50k-75k, 1.3% for AGIs $75k-100k, 1.7% for AGIs over 100k)
Net capital gain/loss: +$11,521 (reported on 20.4% of returns)
Here:
+$11,521
State:
+$13,146
(% of AGI for various income ranges: -3.2% for AGIs below $10k, 0.2% for AGIs $10k-25k, 0.4% for AGIs $25k-50k, 1.2% for AGIs $50k-75k, 1.8% for AGIs $75k-100k, 18.5% for AGIs over 100k)
Profit/loss from business: +$8,643 (reported on 14.5% of returns)
Here:
+$8,643
State:
+$8,765
(% of AGI for various income ranges: 7.2% for AGIs below $10k, 4.1% for AGIs $10k-25k, 2.1% for AGIs $25k-50k, 2.2% for AGIs $50k-75k, 2.6% for AGIs $75k-100k, 4.2% for AGIs over 100k)
IRA payment deduction: $2,845 (reported on 2.6% of returns)
83704:
$2,845
Idaho:
$3,020
(% of AGI for various income ranges: 0.2% for AGIs $10k-25k, 0.3% for AGIs $25k-50k, 0.2% for AGIs $50k-75k, 0.2% for AGIs $75k-100k, 0.1% for AGIs over 100k)
Self-employed pension: $11,238 (reported on 0.5% of returns)
Here:
$11,238
Idaho:
$14,427
(% of AGI for various income ranges: 0.1% for AGIs $10k-25k, 0.0% for AGIs $50k-75k, 0.1% for AGIs $75k-100k, 0.4% for AGIs over 100k)
Total itemized deductions: $16,387 (23% of AGI, reported on 37.2% of returns)
Here:
$16,387
State:
$18,385
Here:
23.2% of AGI
State:
23.1% of AGI
(% of AGI for various income ranges: 24.7% for AGIs below $10k, 10.4% for AGIs $10k-25k, 14.6% for AGIs $25k-50k, 16.5% for AGIs $50k-75k, 17.1% for AGIs $75k-100k, 14.6% for AGIs over 100k)
Charity contributions deductions: $3,574 (5% of AGI, reported on 32.3% of returns)
Here:
$3,574
State:
$3,875
Here:
4.8% of AGI
State:
4.6% of AGI
(% of AGI for various income ranges: 1.7% for AGIs below $10k, 1.2% for AGIs $10k-25k, 1.8% for AGIs $25k-50k, 2.7% for AGIs $50k-75k, 3.2% for AGIs $75k-100k, 4.4% for AGIs over 100k)
Total tax: $5,372 (reported on 75.4% of returns)
83704:
$5,372
State:
$6,282
(% of AGI for various income ranges: 3.7% for AGIs below $10k, 4.2% for AGIs $10k-25k, 6.4% for AGIs $25k-50k, 8.3% for AGIs $50k-75k, 10.2% for AGIs $75k-100k, 16.8% for AGIs over 100k)
Earned income credit: $1,606 (reported on 14.4% of returns)
Here:
$1,606
State:
$1,660
Percentage of individuals using paid preparers for their 2004 taxes: 51.1%
Here:
51%
State:
59%
(% for various income ranges: 42.6% for AGIs below $10k, 50.8% for AGIs $10k-25k, 53.0% for AGIs $25k-50k, 53.3% for AGIs $50k-75k, 54.5% for AGIs $75k-100k, 60.8% for AGIs over 100k)
Likely homosexual households (counted as self-reported same-sex unmarried-partner households)
Lesbian couples: 0.2% of all households
Gay men: 0.1% of all households
Household received Food Stamps/SNAP in the past 12 months: 1,271 Household did not receive Food Stamps/SNAP in the past 12 months: 16,228
Women who had a birth in the past 12 months: 564 (522 now married, 17 unmarried) Women who did not have a birth in the past 12 months: 9,556 (4,058 now married, 5,470 unmarried)
Housing units in zip code 83704 with a mortgage: 7,234 (1,059 second mortgage, 807 both second mortgage and home equity loan) Houses without a mortgage: 360
Median monthly owner costs for units with a mortgage: $1,362 Median monthly owner costs for units without a mortgage: $446
Residents with income below the poverty level in 2022:
This zip code:
9.9%
Whole state:
10.7%
Residents with income below 50% of the poverty level in 2022:
This zip code:
5.0%
Whole state:
6.1%
Median number of rooms in houses and condos:
Here:
6.2
State:
6.5
Median number of rooms in apartments:
Here:
4.1
State:
4.4
Notable locations in this zip code not listed on our city pages
Notable locations in zip code 83704: Valley View School (A), T J Maxx Plaza (B), Boise Towne Square (C), Ada County Paramedics Medical Station 54 (D), Boise City Fire Department Station 4 (E). Display/hide their locations on the map
Tourist attractions (not listed on the city page) : Adventure Travel (Recreational Trips & Guides; 9113 Yaryan Drive), Global Travel (Tours & Charters; 350 North Milwaukee Street Suite 2150).
4,729 married couples with children.
1,753 single-parent households (529 men, 1,224 women).
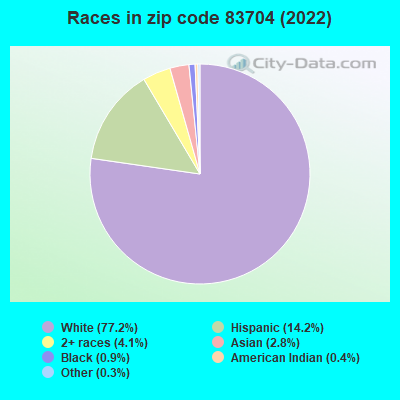
88.0% of residents of 83704 zip code speak English at home.
7.3% of residents speak Spanish at home (67% very well, 18% well, 13% not well, 3% not at all).
2.9% of residents speak other Indo-European language at home (59% very well, 23% well, 13% not well, 5% not at all).
1.2% of residents speak Asian or Pacific Island language at home (53% very well, 42% well, 5% not well).
0.9% of residents speak other language at home (53% very well, 32% well, 15% not well).
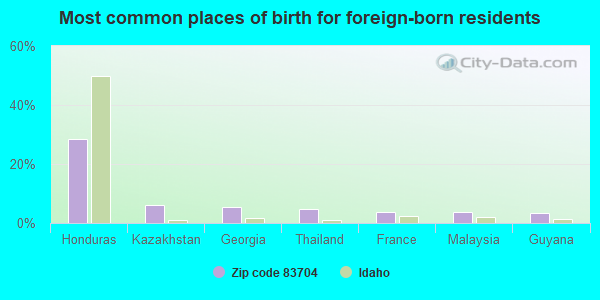
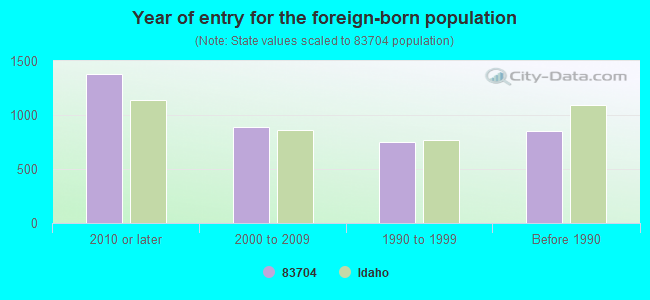
Foreign born population: 3,219 (7.6%) (51.1% of them are naturalized citizens)
Major facilities with environmental interests located in this zip code:
SYNGENTA SEEDS INC (600 N ARMSTRONG PL in BOISE, ID)
COMPLIANCE ACTIVITY (Tracking inspections of insecticide, fungicide, and rodenticide, and toxic substances) STATE MASTER (New Jersey environmental info) - NJEMS-002725, PESTICIDES - MANUFACTURE Alternative names: SYGENTA, NOVARTIS SEEDS INC, ROGERS SEED CO, SYGENTA
CAPITAL SENIOR HIGH SCHOOL (8055 GODDARD ROAD in BOISE, ID)
(Geographic Names Information System) (National Center for Education Statistics) - STATE ID-001 303 Conditionally Exempt Small Quantity Generators, less than 100 kg/month of hazardous waste (Resource Conservation and Recovery Act (tracking hazardous waste)) - notification Organizations: IND SCHOOL DIST OF BOISE CITY (CONTACT/OWNER)
, BOISE CITY INDEPENDENT SCHOOL DISTRICT 1 (SCHOOL DISTRICT)
Alternative names: CAPITAL HIGH SCHOOL
ADA COUNTY JUVENILE CENTER (6300 DENTON STREET in BOISE, ID)
(Geographic Names Information System) (National Center for Education Statistics) - STATE ID-001 915 Organizations: BOISE CITY INDEPENDENT SCHOOL DISTRICT 1 (SCHOOL DISTRICT)
SUMMERWIND ELEMENTARY SCHOOL (3675 NORTH JULLION WAY in BOISE, ID)
(Geographic Names Information System) (National Center for Education Statistics) - STATE ID-002 110 Organizations: MERIDIAN JOINT SCHOOL DISTRICT 2 (SCHOOL DISTRICT)
COLE ELEMENTARY SCHOOL (7415 FAIRVIEW AVENUE in BOISE, ID)
(Geographic Names Information System) (National Center for Education Statistics) - STATE ID-001 104 Organizations: BOISE CITY INDEPENDENT SCHOOL DISTRICT 1 (SCHOOL DISTRICT)
HORIZON ELEMENTARY SCHOOL (730 NORTH MITCHELL STREET in BOISE, ID)
(Geographic Names Information System) (National Center for Education Statistics) - STATE ID-001 135 Organizations: BOISE CITY INDEPENDENT SCHOOL DISTRICT 1 (SCHOOL DISTRICT)
FAIRMONT JUNIOR HIGH SCHOOL (2121 NORTH COLE ROAD in BOISE, ID)
(Geographic Names Information System) (National Center for Education Statistics) - STATE ID-001 202 Organizations: BOISE CITY INDEPENDENT SCHOOL DISTRICT 1 (SCHOOL DISTRICT)
MOUNTAIN VIEW ELEMENTARY SCH (3500 CABARTON LANE in BOISE, ID)
(Geographic Names Information System) (National Center for Education Statistics) - STATE ID-001 120 Organizations: BOISE CITY INDEPENDENT SCHOOL DISTRICT 1 (SCHOOL DISTRICT)
INTERSTATE BRANDS CORP, EDDYS BAKERY (380 N FIVE MILE RD in BOISE, ID)
AIR MINOR (AIRS/AFS) (Resource Conservation and Recovery Act (tracking hazardous waste)) Business SIC classification: BREAD AND OTHER BAKERY PRODUCTS, EXCEPT COOKIES AND CRACKERS Organizations: INTERSTAE BRANDS CORP (CONTACT/OWNER)
PRECO ELECTRONICS INC. (415 NORTH MAPLE GROVE ROAD in BOISE, ID)
COMPLIANCE ACTIVITY (Tracking inspections of insecticide, fungicide, and rodenticide, and toxic substances) CRITERIA AND HAZARDOUS AIR POLLUTANT INVENTORY (Inventory of air pollution sources) (Resource Conservation and Recovery Act (tracking hazardous waste)) TRI REPORTER (Tracking of toxic chemicals releasing facilities) Business SIC classification: MOTOR VEHICLE PARTS AND ACCESSORIES Organizations: EDWIN R PETERSON (CONTACT/OWNER)
Alternative names: PRECO INC
SCP GLOBAL TECHNOLOGIES (400 N BENJAMIN LN in BOISE, ID)
(Resource Conservation and Recovery Act (tracking hazardous waste)) Business NAICS classification: SEMICONDUCTOR MACHINERY MANUFACTURING.; SEMICONDUCTOR AND RELATED DEVICE MANUFACTURING. Organizations: SCP US INC (CONTACT/OPERATOR)
, PETERSON PROPERTIES (CONTACT/OWNER)
CHEVROLET OF BOISE (9599 W FAIRVIEW AVE in BOISE, ID)
Conditionally Exempt Small Quantity Generators, less than 100 kg/month of hazardous waste (Resource Conservation and Recovery Act (tracking hazardous waste)) Business NAICS classification: OTHER AUTOMOTIVE MECHANICAL AND ELECTRICAL REPAIR AND MAINTENANCE. Organizations: DAVID HEITER (CONTACT/OPERATOR)
, CAPITAL AUTOMOTIVE REIT (CONTACT/OWNER)
, LITHIA MOTORS INC (CONTACT/OWNER)
Alternative names: ROUNDTREE CHEVROLET INC NEW
IDAHO CHEMICAL INDUSTRIES INCORPORATED (21 NORTH ALLUMBAUGH STREET in BOISE, ID)
COMPLIANCE ACTIVITY (Tracking inspections of insecticide, fungicide, and rodenticide, and toxic substances) (Resource Conservation and Recovery Act (tracking hazardous waste)) Business SIC classification: LAMINATED PLASTICS PLATE, SHEET, AND PROFILE SHAPES; PLASTICS PRODUCTS; PLASTICS MATERIALS AND BASIC FORMS AND SHAPES
Housing units lacking complete plumbing facilities: 1.0% Housing units lacking complete kitchen facilities: 1.7%
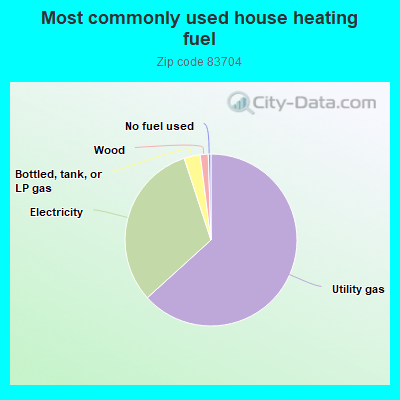
62.9%Utility gas
31.5%Electricity
3.0%Bottled, tank, or LP gas
1.5%Wood
0.5%No fuel used
Population in 1990: 40,912.
Place of birth for U.S.-born residents:
This state: 17,792
Northeast: 1,274
Midwest: 3,275
South: 2,589
West: 13,572
48% of the 83704 zip code residents lived in the same house 5 years ago. Out of people who lived in different houses, 59% lived in this county. Out of people who lived in different counties, 50% lived in Idaho.
89% of the 83704 zip code residents lived in the same house 1 year ago. Out of people who lived in different houses, 52% moved from this county. Out of people who lived in different houses, 19% moved from different county within same state. Out of people who lived in different houses, 28% moved from different state.
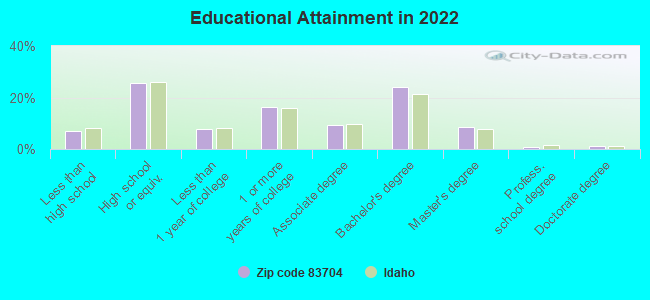
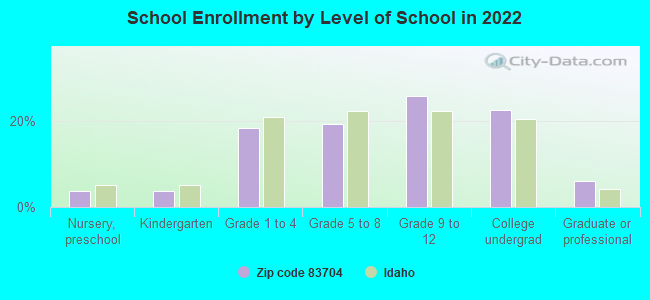
Private vs. public school enrollment:
Students in private schools in grades 1 to 8 (elementary and middle school): 293
Here:
9.5%
Idaho:
13.5%
Students in private schools in grades 9 to 12 (high school): 157
Here:
7.4%
Idaho:
8.5%
Students in private undergraduate colleges: 205
Here:
10.9%
Idaho:
30.0%
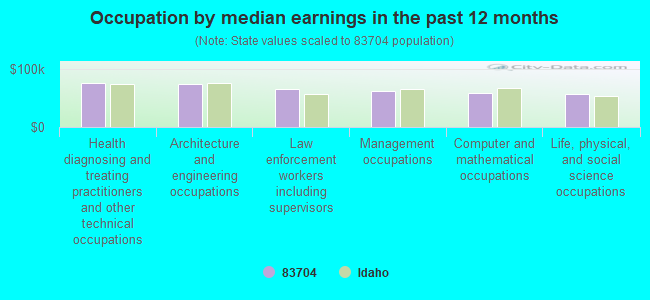
Occupation by median earnings in the past 12 months ($)
76,073Health diagnosing and treating practitioners and other technical occupations
74,362Architecture and engineering occupations
65,375Law enforcement workers including supervisors
61,464Management occupations
58,917Computer and mathematical occupations
57,333Life, physical, and social science occupations
Companies with biggest federal contracts located in this zip code (BOISE, ID):
AATRONICS INCORPORATED (10 N LIBERTY ST; small business) : $426,758 in 27 contractsfrom 1999 to 2006
Contracts for Electrical Hardware and Supplies, ADPE System Configuration, Photographic Projection Equipment, Video Recording and Reproducing Equipment, and moreby Army, Air Force, Bureau of Land Management, Navy, and others Signed by year:2000: $0; 2001: $0; 2002: $0; 2003: $24,000; 2004: $194,870; 2005: $156,964; 2006: $21,810.
Biggest contracts:
$108,744 with Army for Electrical Hardware and Supplies. Signed on 2004-07-09. Completion date: 2004-08-19.
$45,898 with Air Force for ADPE System Configuration. Signed on 2004-09-20. Completion date: 2004-09-28.
$40,188 with Air Force for Photographic Projection Equipment. Taking place in WA. Signed on 2005-09-14. Completion date: 2005-10-28.
$33,586 with Air Force for Video Recording and Reproducing Equipment. Taking place in WA. Signed on 2005-09-20. Completion date: 2005-10-21.
LIVING HOPE CLINIC, INC. (3308 NORTH COLE ROAD, SUIT; small business)
$67,536 with Air Force for Psychiatry Services. Signed on 1999-10-07. Completion date: 2000-10-30.
OVERHEAD DOOR COMPANY OF SOUTH (621 ALLUMBAUGH LN; small business) : $63,996 in 10 contractsfrom 2000 to 2006
Contracts for Fencing, Fences, Gates and Components, Maintenance, Repair and Rebuilding of Equipment -- Miscellaneous, Maintenance, Repair or Alteration of Real Property -- Other Airfield Structures, Miscellaneous Prefabricated Structures, and moreby Army, Bureau of Reclamation, Air Force, Bureau of Land Management, and others Signed by year:2000: $9,572; 2001: $0; 2002: $0; 2003: $0; 2004: $10,492; 2005: $30,674; 2006: $13,258.
Biggest contracts:
$13,258 with Army for Fencing, Fences, Gates and Components. Taking place in WA. Signed on 2006-05-18. Completion date: 2006-06-30.
$12,963 with Bureau of Reclamation for Maintenance, Repair and Rebuilding of Equipment -- Miscellaneous. Taking place in WA. Signed on 2005-07-06. Completion date: 2005-08-12.
$9,572 with Air Force for Maintenance, Repair or Alteration of Real Property -- Other Airfield Structures. Taking place in WA. Signed on 2000-09-29. Completion date: 2000-10-28.
$9,090 with Air Force for Miscellaneous Prefabricated Structures. Signed on 2004-06-25. Completion date: 2004-07-25.
ADA COUNTY (7200 BARRISTER DR)
$49,168 with Army for Guard Services. Signed on 2006-05-11. Completion date: 2006-09-04.
TRI-TECH CONSULTING LLC (2658 WESTLAND PLACE; small business) : $36,906 in 2 contractsfrom 2005 to 2006
$34,880 with Air Force for Training Aids. Taking place in WA. Signed on 2005-09-30. Completion date: 2005-10-29.
$2,026, same as above.Signed on 2006-03-23. Completion date: 2006-05-15.
OVERHEAD DOOR OF STHWSTERN IDA (621 ALLUMBAUGH ST; small business) : $14,406 in 2 contractsfrom 2001 to 2002
$11,000 with Bureau of Land Management for Maintenance, Repair or Alteration of Real Property -- Other Warehouse Buildings. Signed on 2001-09-15. Completion date: 2001-11-15.
$3,406 with U.S. Army Corps of Engineers - civil program financing only for Other Buildings. Taking place in MT. Signed on 2002-10-22. Completion date: 2002-11-29.
CLIMA-TECH CORPORATION (258 N MAPLE GROVE; small business) : $12,093 in 4 contractsfrom 2001 to 2004
$5,432 with Army for Maintenance, Repair or Alteration of Real Property -- Office Buildings. Signed on 2004-02-06. Completion date: 2004-06-30.
$3,661 with Public Buildings Service for Maintenance, Repair or Alteration of Real Property -- Office Buildings. Signed on 2003-03-15. Completion date: 2003-03-15.
$3,000, same as above.Signed on 2001-12-15. Completion date: 2001-12-15.
$0 with Army for Maintenance, Repair or Alteration of Real Property -- Office Buildings. Signed on 2004-02-06. Completion date: 2004-06-30.
SAINT ALPHONSUS PHYSICIAN SERV (6533 EMERALD ST)
$11,473 with Army for General Health Care Services. Signed on 2006-04-06. Completion date: 2006-06-16.
HULICKY INC (9309 FAIRVIEW AVE; small business) : $9,879 in 2 contractsin 2004
$6,514 with Air Force for Maintenance, Repair and Rebuilding of Equipment -- Ground Effect Vehicles, Motor Vehicles, Trailers, and Cycles. Signed on 2004-02-23. Completion date: 2004-03-23.
$3,365, same as above.Signed on 2004-08-24. Completion date: 2004-08-31.
THOMPSON, BILL (9557 ATMORE DR; small business)
$6,600 with Air Force for Other Education and Training Services. Signed on 2005-09-27. Completion date: 2005-04-08.
Top industries in this zip code by the number of employees in 2005:
Administrative and Support and Waste Management and Remediation Services: Temporary Help Services (250-499 employees: 2 establishments, 100-249 employees: 6 establishments, 50-99 employees: 2 establishments, 1-4 employees: 5 establishments)
Finance and Insurance: Financial Transactions Processing, Reserve, and Clearinghouse Activities (over 1000: 1, 10-19: 4, 5-9: 1, 1-4: 5)
Health Care and Social Assistance: General Medical and Surgical Hospitals (over 1000: 1)
Health Care and Social Assistance: Offices of Physicians (except Mental Health Specialists) (100-249: 1, 50-99: 1, 20-49: 3, 10-19: 9, 5-9: 15, 1-4: 19)
Health Care and Social Assistance: Homes for the Elderly (250-499: 1, 50-99: 1, 20-49: 1, 1-4: 3)
Health Care and Social Assistance: Offices of Dentists (10-19: 16, 5-9: 24, 1-4: 23)
People in group quarters in 2010:
963 people in correctional residential facilities
191 people in nursing facilities/skilled-nursing facilities
147 people in group homes intended for adults
36 people in correctional facilities intended for juveniles
14 people in workers' group living quarters and job corps centers
12 people in group homes for juveniles (non-correctional)
12 people in emergency and transitional shelters (with sleeping facilities) for people experiencing homelessness
10 people in residential treatment centers for adults
People in group quarters in 2000:
776 people in local jails and other confinement facilities (including police lockups)
419 people in nursing homes
68 people in short-term care, detention or diagnostic centers for delinquent children
62 people in mental (psychiatric) hospitals or wards
37 people in homes for the mentally retarded
3 people in homes for abused, dependent, and neglected children
2 people in other noninstitutional group quarters
Fatal accident statistics in 2014:
Fatal accident count: 1
Vehicles involved in fatal accidents: 1
Fatal accidents caused by drunken drivers: 0
Fatalities: 1
Persons involved in fatal accidents: 3
Pedestrians involved in fatal accidents: 1
Fatal accident statistics in 2012:
Fatal accident count: 1
Vehicles involved in fatal accidents: 1
Fatal accidents caused by drunken drivers: 1
Fatalities: 2
Persons involved in fatal accidents: 5
Pedestrians involved in fatal accidents: 0
Home Mortgage Disclosure Act Aggregated Statistics For Year 2009 (Based on 4 full and 10 partial tracts)
A) FHA, FSA/RHS & VA Home Purchase Loans
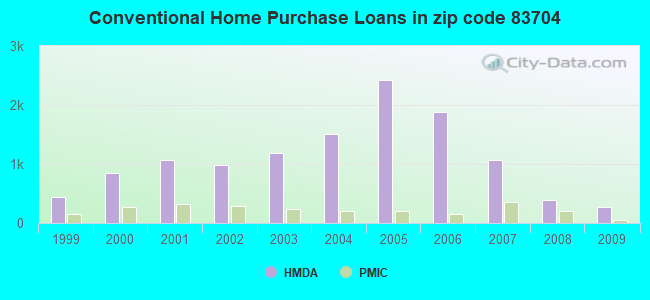
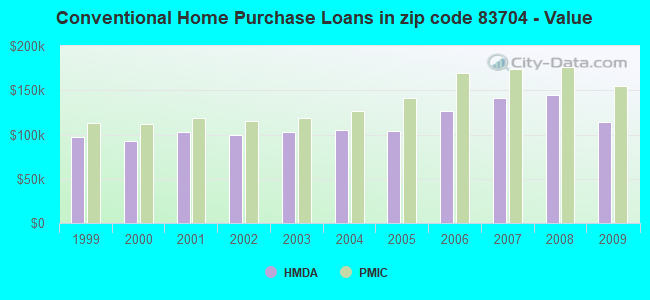
B) Conventional Home Purchase Loans
C) Refinancings
D) Home Improvement Loans
E) Loans on Dwellings For 5+ Families
F) Non-occupant Loans on < 5 Family Dwellings (A B C & D)
G) Loans On Manufactured Home Dwelling (A B C & D)
Number
Average Value
Number
Average Value
Number
Average Value
Number
Average Value
Number
Average Value
Number
Average Value
Number
Average Value
LOANS ORIGINATED
325
$143,504
263
$113,873
1,577
$142,221
83
$84,964
2
$1,618,850
121
$112,058
16
$69,875
APPLICATIONS APPROVED, NOT ACCEPTED
20
$162,590
17
$81,855
288
$151,028
17
$83,855
0
$0
10
$113,040
2
$39,900
APPLICATIONS DENIED
66
$145,015
42
$113,820
631
$165,930
46
$64,969
0
$0
54
$170,310
17
$47,862
APPLICATIONS WITHDRAWN
48
$139,530
27
$104,076
336
$162,497
17
$77,532
3
$134,807
23
$136,152
5
$141,362
FILES CLOSED FOR INCOMPLETENESS
3
$162,600
4
$126,038
66
$140,528
5
$102,548
0
$0
3
$69,483
0
$0
Aggregated Statistics For Year 2008 (Based on 4 full and 10 partial tracts)
A) FHA, FSA/RHS & VA Home Purchase Loans
B) Conventional Home Purchase Loans
C) Refinancings
D) Home Improvement Loans
E) Loans on Dwellings For 5+ Families
F) Non-occupant Loans on < 5 Family Dwellings (A B C & D)
G) Loans On Manufactured Home Dwelling (A B C & D)
Number
Average Value
Number
Average Value
Number
Average Value
Number
Average Value
Number
Average Value
Number
Average Value
Number
Average Value
LOANS ORIGINATED
283
$161,563
384
$144,388
1,106
$150,515
115
$71,258
3
$4,412,920
185
$153,878
21
$66,013
APPLICATIONS APPROVED, NOT ACCEPTED
10
$146,321
36
$95,889
226
$152,273
19
$105,904
0
$0
30
$144,730
15
$61,958
APPLICATIONS DENIED
33
$158,239
91
$167,927
765
$171,366
185
$102,298
0
$0
88
$149,513
22
$68,838
APPLICATIONS WITHDRAWN
26
$164,040
49
$169,468
327
$161,333
33
$108,185
0
$0
55
$190,951
10
$85,368
FILES CLOSED FOR INCOMPLETENESS
4
$165,018
14
$134,384
70
$174,302
12
$73,819
0
$0
13
$179,806
0
$0
Aggregated Statistics For Year 2007 (Based on 4 full and 10 partial tracts)
A) FHA, FSA/RHS & VA Home Purchase Loans
B) Conventional Home Purchase Loans
C) Refinancings
D) Home Improvement Loans
E) Loans on Dwellings For 5+ Families
F) Non-occupant Loans on < 5 Family Dwellings (A B C & D)
G) Loans On Manufactured Home Dwelling (A B C & D)
Number
Average Value
Number
Average Value
Number
Average Value
Number
Average Value
Number
Average Value
Number
Average Value
Number
Average Value
LOANS ORIGINATED
85
$175,093
1,063
$140,871
1,575
$140,316
259
$65,464
2
$598,500
331
$146,883
50
$59,673
APPLICATIONS APPROVED, NOT ACCEPTED
5
$160,382
157
$122,514
306
$140,595
45
$74,216
0
$0
68
$139,627
18
$56,929
APPLICATIONS DENIED
21
$175,154
224
$144,512
800
$159,692
171
$76,779
0
$0
144
$151,079
48
$49,867
APPLICATIONS WITHDRAWN
10
$163,170
123
$130,288
344
$153,821
76
$101,595
0
$0
76
$142,350
4
$74,768
FILES CLOSED FOR INCOMPLETENESS
0
$0
28
$159,988
101
$154,660
19
$57,822
0
$0
8
$172,421
1
$74,030
Aggregated Statistics For Year 2006 (Based on 4 full and 10 partial tracts)
A) FHA, FSA/RHS & VA Home Purchase Loans
B) Conventional Home Purchase Loans
C) Refinancings
D) Home Improvement Loans
E) Loans on Dwellings For 5+ Families
F) Non-occupant Loans on < 5 Family Dwellings (A B C & D)
G) Loans On Manufactured Home Dwelling (A B C & D)
Number
Average Value
Number
Average Value
Number
Average Value
Number
Average Value
Number
Average Value
Number
Average Value
Number
Average Value
LOANS ORIGINATED
127
$151,552
1,889
$126,034
2,106
$127,800
275
$58,428
3
$648,293
691
$129,046
37
$90,502
APPLICATIONS APPROVED, NOT ACCEPTED
5
$107,906
205
$117,519
295
$117,758
61
$74,265
0
$0
66
$117,555
16
$106,739
APPLICATIONS DENIED
24
$152,053
422
$110,698
790
$125,835
230
$63,339
1
$58,400
159
$133,167
64
$86,640
APPLICATIONS WITHDRAWN
10
$154,554
191
$124,117
665
$125,858
60
$101,390
0
$0
88
$129,024
5
$67,426
FILES CLOSED FOR INCOMPLETENESS
4
$195,942
51
$119,066
98
$142,032
8
$94,179
0
$0
15
$127,149
1
$105,350
Aggregated Statistics For Year 2005 (Based on 4 full and 10 partial tracts)
A) FHA, FSA/RHS & VA Home Purchase Loans
B) Conventional Home Purchase Loans
C) Refinancings
D) Home Improvement Loans
E) Loans on Dwellings For 5+ Families
F) Non-occupant Loans on < 5 Family Dwellings (A B C & D)
G) Loans On Manufactured Home Dwelling (A B C & D)
Number
Average Value
Number
Average Value
Number
Average Value
Number
Average Value
Number
Average Value
Number
Average Value
Number
Average Value
LOANS ORIGINATED
184
$129,571
2,428
$104,044
1,709
$108,830
173
$51,737
11
$819,575
774
$107,773
31
$39,057
APPLICATIONS APPROVED, NOT ACCEPTED
17
$114,194
213
$108,476
304
$113,304
11
$41,581
0
$0
92
$113,795
16
$46,631
APPLICATIONS DENIED
26
$109,792
532
$96,263
755
$109,141
162
$48,101
2
$575,555
140
$106,581
106
$51,337
APPLICATIONS WITHDRAWN
14
$138,523
306
$115,019
597
$113,284
68
$106,728
0
$0
77
$136,897
8
$101,890
FILES CLOSED FOR INCOMPLETENESS
8
$116,111
35
$89,964
140
$115,287
8
$49,455
0
$0
13
$115,448
7
$42,604
Aggregated Statistics For Year 2004 (Based on 4 full and 10 partial tracts)
A) FHA, FSA/RHS & VA Home Purchase Loans
B) Conventional Home Purchase Loans
C) Refinancings
D) Home Improvement Loans
E) Loans on Dwellings For 5+ Families
F) Non-occupant Loans on < 5 Family Dwellings (A B C & D)
G) Loans On Manufactured Home Dwelling (A B C & D)
Number
Average Value
Number
Average Value
Number
Average Value
Number
Average Value
Number
Average Value
Number
Average Value
Number
Average Value
LOANS ORIGINATED
252
$119,920
1,513
$104,897
1,569
$102,906
158
$35,996
3
$1,052,583
439
$110,459
21
$45,013
APPLICATIONS APPROVED, NOT ACCEPTED
20
$123,362
188
$103,335
241
$100,619
18
$63,439
0
$0
50
$115,258
17
$64,122
APPLICATIONS DENIED
38
$113,360
246
$85,025
612
$100,357
109
$28,890
0
$0
80
$93,249
62
$53,131
APPLICATIONS WITHDRAWN
25
$117,171
125
$122,889
470
$111,590
38
$30,015
0
$0
51
$124,071
2
$41,595
FILES CLOSED FOR INCOMPLETENESS
7
$138,500
39
$74,608
131
$116,600
10
$41,477
0
$0
11
$133,223
16
$26,122
Aggregated Statistics For Year 2003 (Based on 4 full and 10 partial tracts)
A) FHA, FSA/RHS & VA Home Purchase Loans
B) Conventional Home Purchase Loans
C) Refinancings
D) Home Improvement Loans
E) Loans on Dwellings For 5+ Families
F) Non-occupant Loans on < 5 Family Dwellings (A B C & D)
Number
Average Value
Number
Average Value
Number
Average Value
Number
Average Value
Number
Average Value
Number
Average Value
LOANS ORIGINATED
387
$112,769
1,178
$102,837
4,176
$102,483
120
$17,231
3
$295,050
510
$98,678
APPLICATIONS APPROVED, NOT ACCEPTED
20
$113,238
129
$89,068
425
$103,838
9
$20,966
0
$0
53
$97,730
APPLICATIONS DENIED
35
$112,658
211
$88,779
813
$91,674
89
$23,453
0
$0
84
$103,082
APPLICATIONS WITHDRAWN
32
$99,243
104
$99,165
623
$106,246
15
$23,219
0
$0
54
$93,321
FILES CLOSED FOR INCOMPLETENESS
7
$139,661
22
$108,718
157
$101,414
7
$26,776
0
$0
24
$97,378
Aggregated Statistics For Year 2002 (Based on 4 full and 10 partial tracts)
A) FHA, FSA/RHS & VA Home Purchase Loans
B) Conventional Home Purchase Loans
C) Refinancings
D) Home Improvement Loans
F) Non-occupant Loans on < 5 Family Dwellings (A B C & D)
Number
Average Value
Number
Average Value
Number
Average Value
Number
Average Value
Number
Average Value
LOANS ORIGINATED
348
$106,454
981
$99,660
2,743
$101,317
121
$14,824
388
$88,582
APPLICATIONS APPROVED, NOT ACCEPTED
23
$108,396
143
$100,854
331
$99,324
22
$12,364
43
$92,624
APPLICATIONS DENIED
23
$121,301
163
$78,813
483
$97,462
74
$10,288
55
$84,733
APPLICATIONS WITHDRAWN
40
$98,186
73
$116,998
505
$107,416
29
$17,490
39
$100,419
FILES CLOSED FOR INCOMPLETENESS
1
$186,880
26
$81,726
120
$97,431
6
$42,528
8
$89,041
Aggregated Statistics For Year 2001 (Based on 4 full and 10 partial tracts)
A) FHA, FSA/RHS & VA Home Purchase Loans
B) Conventional Home Purchase Loans
C) Refinancings
D) Home Improvement Loans
E) Loans on Dwellings For 5+ Families
F) Non-occupant Loans on < 5 Family Dwellings (A B C & D)
Number
Average Value
Number
Average Value
Number
Average Value
Number
Average Value
Number
Average Value
Number
Average Value
LOANS ORIGINATED
535
$104,173
1,069
$102,315
2,201
$98,524
198
$17,774
5
$1,145,906
323
$86,688
APPLICATIONS APPROVED, NOT ACCEPTED
16
$108,125
107
$90,145
223
$91,079
25
$14,708
0
$0
22
$81,580
APPLICATIONS DENIED
25
$101,206
217
$63,554
498
$81,908
114
$18,714
0
$0
27
$90,474
APPLICATIONS WITHDRAWN
32
$109,524
92
$88,380
390
$95,868
28
$29,133
0
$0
34
$81,991
FILES CLOSED FOR INCOMPLETENESS
11
$102,083
47
$82,698
102
$96,603
13
$23,633
0
$0
12
$74,482
Aggregated Statistics For Year 2000 (Based on 4 full and 10 partial tracts)
A) FHA, FSA/RHS & VA Home Purchase Loans
B) Conventional Home Purchase Loans
C) Refinancings
D) Home Improvement Loans
E) Loans on Dwellings For 5+ Families
F) Non-occupant Loans on < 5 Family Dwellings (A B C & D)
Number
Average Value
Number
Average Value
Number
Average Value
Number
Average Value
Number
Average Value
Number
Average Value
LOANS ORIGINATED
467
$95,013
851
$92,245
436
$81,026
227
$56,954
3
$4,547,287
112
$81,575
APPLICATIONS APPROVED, NOT ACCEPTED
33
$68,394
129
$78,677
116
$77,975
62
$24,122
0
$0
22
$95,208
APPLICATIONS DENIED
71
$83,142
320
$59,200
309
$72,314
129
$20,526
0
$0
22
$91,818
APPLICATIONS WITHDRAWN
22
$100,014
107
$92,637
136
$81,866
33
$57,316
0
$0
14
$78,556
FILES CLOSED FOR INCOMPLETENESS
4
$92,865
43
$101,711
40
$81,428
4
$20,758
2
$266,945
7
$87,731
Aggregated Statistics For Year 1999 (Based on 1 full and 6 partial tracts)
A) FHA, FSA/RHS & VA Home Purchase Loans
B) Conventional Home Purchase Loans
C) Refinancings
D) Home Improvement Loans
E) Loans on Dwellings For 5+ Families
F) Non-occupant Loans on < 5 Family Dwellings (A B C & D)
2002 - 2018 National Fire Incident Reporting System (NFIRS) incidents
According to the data from the years 2002 - 2018 the average number of fires per year is 103. The highest number of fire incidents - 162 took place in 2003, and the least - 63 in 2017. The data has a decreasing trend.
When looking into fire subcategories, the most incidents belonged to: Outside Fires (40.0%), and Structure Fires (34.6%).
Fire incident types reported to NFIRS in Zip Code 83704


 Nearest zip codes: 83713, 83703, 83709, 83705, 83706, 83714.


 According to the data from the years 2002 - 2018 the average number of fires per year is 103. The highest number of fire incidents - 162 took place in 2003, and the least - 63 in 2017. The data has a decreasing trend.
 When looking into fire subcategories, the most incidents belonged to: Outside Fires (40.0%), and Structure Fires (34.6%).