Estimated zip code population in 2022: 25,478 Zip code population in 2010: 24,305 Zip code population in 2000: 23,972
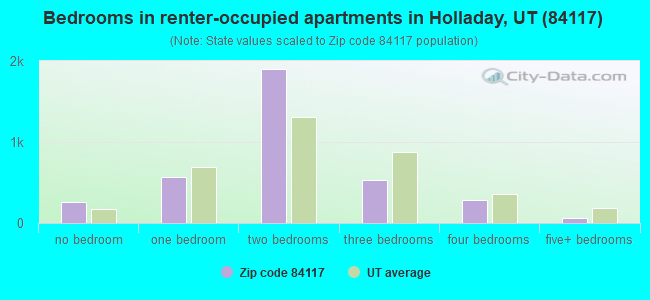
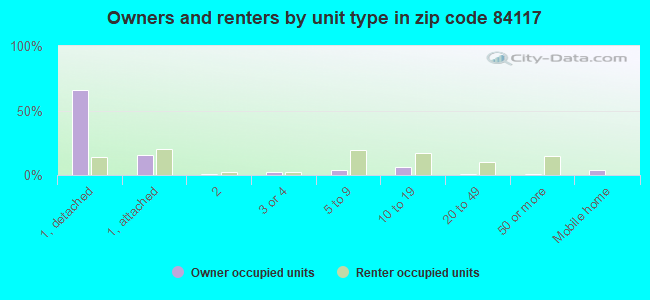
Houses and condos: 11,956 Renter-occupied apartments: 3,612
% of renters here:
33%
State:
29%
March 2022 cost of living index in zip code 84117: 95.5 (near average, U.S. average is 100)
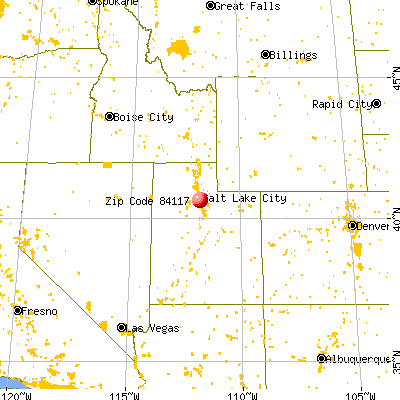
Land area: 5.7 sq. mi. Water area: 0.0 sq. mi.
Population density: 4,454 people per square mile
(average).
OSM Map
General Map
Google Map
MSN Map
OSM Map
General Map
Google Map
MSN Map
OSM Map
General Map
Google Map
MSN Map
OSM Map
General Map
Google Map
MSN Map
Please wait while loading the map...
Real estate property taxes paid for housing units in 2022:
This zip code:
0.5% ($2,954)
Utah:
0.5% ($2,376)
Median real estate property taxes paid for housing units with mortgages in 2022: $2,801 (0.4%) Median real estate property taxes paid for housing units with no mortgage in 2022: $3,193 (0.5%)
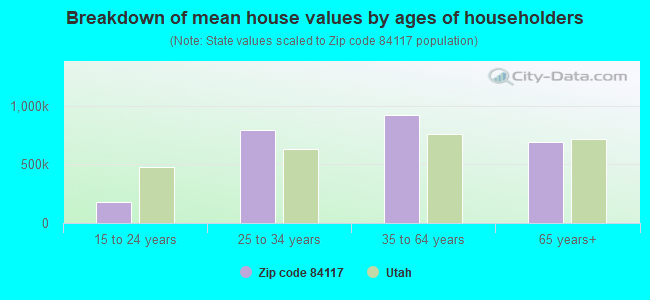
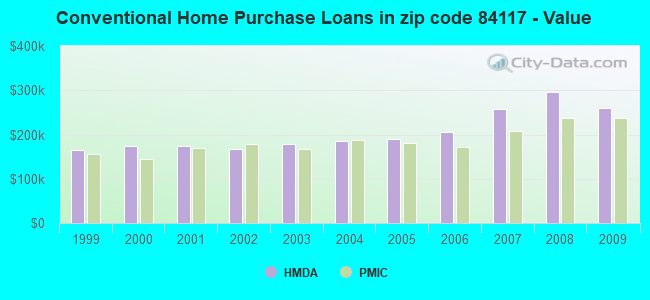
Estimated median house/condo value in 2022: $624,222
84117:
$624,222
Utah:
$499,500
According to our research of Utah and other state lists, there were 25 registered sex offenders living in 84117 zip code as of April 27, 2024. The ratio of all residents to sex offenders in zip code 84117 is 1,032 to 1. The ratio of registered sex offenders to all residents in this zip code is much lower than the state average.
Median resident age:
This zip code:
42.4 years
Utah median age:
32.1 years
Average household size:
This zip code:
2.3 people
Utah:
3.0 people
Averages for the 2020 tax year for zip code 84117, filed in 2021:
Average Adjusted Gross Income (AGI) in 2020: $163,245 (Individual Income Tax Returns)
Here:
$163,245
State:
$81,660
Salary/wage: $90,666 (reported on 78.5% of returns)
Here:
$90,666
State:
$63,027
(% of AGI for various income ranges: 1223.4% for AGIs below $25k, 4031.1% for AGIs $25k-50k, 6748.3% for AGIs $50k-75k, 9846.2% for AGIs $75k-100k, 19794.0% for AGIs $100k-200k, 118332.1% for AGIs over 200k)
Taxable interest for individuals: $5,948 (reported on 40.3% of returns)
This zip code:
$5,948
Utah:
$2,255
(% of AGI for various income ranges: 24.3% for AGIs below $25k, 46.3% for AGIs $25k-50k, 79.3% for AGIs $50k-75k, 138.1% for AGIs $75k-100k, 352.8% for AGIs $100k-200k, 6181.6% for AGIs over 200k)
Ordinary dividends: $18,271 (reported on 28.4% of returns)
Here:
$18,271
State:
$7,362
(% of AGI for various income ranges: 54.6% for AGIs below $25k, 61.9% for AGIs $25k-50k, 151.4% for AGIs $50k-75k, 306.0% for AGIs $75k-100k, 757.1% for AGIs $100k-200k, 13593.9% for AGIs over 200k)
Net capital gain/loss in AGI: +$145,012 (reported on 28.5% of returns)
Here:
+$145,012
State:
+$43,433
(% of AGI for various income ranges: 41.1% for AGIs below $25k, 46.0% for AGIs $25k-50k, 117.6% for AGIs $50k-75k, 355.0% for AGIs $75k-100k, 1388.6% for AGIs $100k-200k, 132052.4% for AGIs over 200k)
Profit/loss from business: +$11,987 (reported on 17.0% of returns)
Here:
+$11,987
State:
+$9,957
(% of AGI for various income ranges: 142.4% for AGIs below $25k, 144.1% for AGIs $25k-50k, 177.7% for AGIs $50k-75k, 286.2% for AGIs $75k-100k, 554.0% for AGIs $100k-200k, 2693.4% for AGIs over 200k)
Taxable individual retirement arrangement distribution: $25,071 (reported on 11.4% of returns)
84117:
$25,071
Utah:
$21,167
(% of AGI for various income ranges: 74.3% for AGIs below $25k, 130.6% for AGIs $25k-50k, 246.4% for AGIs $50k-75k, 528.7% for AGIs $75k-100k, 1215.1% for AGIs $100k-200k, 3541.1% for AGIs over 200k)
Self-employed (Keogh) retirement plans: $29,520 (reported on 0.8% of returns)
84117:
$29,520
Utah:
$29,069
(% of AGI for various income ranges: 53.1% for AGIs $100k-200k, 645.5% for AGIs over 200k)
Total itemized deductions: $88,322 (reported on 18.7% of returns)
Here:
$88,322
State:
$41,056
(% of AGI for various income ranges: 76.2% for AGIs below $25k, 159.6% for AGIs $25k-50k, 461.0% for AGIs $50k-75k, 1063.8% for AGIs $75k-100k, 2631.9% for AGIs $100k-200k, 43607.6% for AGIs over 200k)
Charity contributions: $71,992 (reported on 16.5% of returns)
Here:
$71,992
State:
$22,261
(% of AGI for various income ranges: 9.4% for AGIs below $25k, 29.2% for AGIs $25k-50k, 95.9% for AGIs $50k-75k, 272.6% for AGIs $75k-100k, 860.0% for AGIs $100k-200k, 36260.0% for AGIs over 200k)
Taxes paid: $8,200 (reported on 18.7% of returns)
84117:
$8,200
State:
$7,985
(% of AGI for various income ranges: 14.8% for AGIs below $25k, 30.6% for AGIs $25k-50k, 109.8% for AGIs $50k-75k, 287.5% for AGIs $75k-100k, 697.4% for AGIs $100k-200k, 2235.8% for AGIs over 200k)
Earned income credit: $1,846 (reported on 8.7% of returns)
Here:
$1,846
State:
$2,169
(% of AGI for various income ranges: 60.1% for AGIs below $25k, 35.9% for AGIs $25k-50k)
Percentage of individuals using paid preparers for their 2020 taxes: 93.5%
Here:
93%
State:
94%
(% for various income ranges: 92.0% for AGIs below $25k, 94.1% for AGIs $25k-50k, 93.3% for AGIs $50k-75k, 93.9% for AGIs $75k-100k, 94.0% for AGIs $100k-200k, 94.9% for AGIs over 200k)
Averages for the 2012 tax year for zip code 84117, filed in 2013:
Average Adjusted Gross Income (AGI) in 2012: $92,254 (Individual Income Tax Returns)
Here:
$92,254
State:
$60,327
Salary/wage: $61,796 (reported on 79.1% of returns)
Here:
$61,796
State:
$48,762
(% of AGI for various income ranges: 73.6% for AGIs below $25k, 75.9% for AGIs $25k-50k, 72.4% for AGIs $50k-75k, 64.7% for AGIs $75k-100k, 65.2% for AGIs $100k-200k, 37.1% for AGIs over 200k)
Taxable interest for individuals: $4,111 (reported on 45.6% of returns)
This zip code:
$4,111
Utah:
$1,534
(% of AGI for various income ranges: 1.8% for AGIs below $25k, 1.1% for AGIs $25k-50k, 1.1% for AGIs $50k-75k, 1.3% for AGIs $75k-100k, 1.3% for AGIs $100k-200k, 2.8% for AGIs over 200k)
Ordinary dividends: $13,277 (reported on 27.7% of returns)
Here:
$13,277
State:
$5,711
(% of AGI for various income ranges: 3.0% for AGIs below $25k, 1.8% for AGIs $25k-50k, 1.7% for AGIs $50k-75k, 2.6% for AGIs $75k-100k, 2.7% for AGIs $100k-200k, 5.6% for AGIs over 200k)
Net capital gain/loss in AGI: +$60,155 (reported on 25.7% of returns)
Here:
+$60,155
State:
+$23,734
(% of AGI for various income ranges: 0.4% for AGIs below $25k, 0.6% for AGIs $25k-50k, 0.7% for AGIs $50k-75k, 1.0% for AGIs $75k-100k, 2.7% for AGIs $100k-200k, 31.6% for AGIs over 200k)
Profit/loss from business: +$14,187 (reported on 16.9% of returns)
Here:
+$14,187
State:
+$8,845
(% of AGI for various income ranges: 6.3% for AGIs below $25k, 3.4% for AGIs $25k-50k, 2.6% for AGIs $50k-75k, 3.5% for AGIs $75k-100k, 3.6% for AGIs $100k-200k, 1.6% for AGIs over 200k)
Taxable individual retirement arrangement distribution: $19,199 (reported on 13.6% of returns)
84117:
$19,199
Utah:
$15,565
(% of AGI for various income ranges: 3.8% for AGIs below $25k, 3.2% for AGIs $25k-50k, 3.1% for AGIs $50k-75k, 4.5% for AGIs $75k-100k, 4.6% for AGIs $100k-200k, 1.7% for AGIs over 200k)
Self-employment retirement plans: $23,808 (reported on 1.0% of returns)
84117:
$23,808
Utah:
$22,655
(% of AGI for various income ranges: 0.3% for AGIs $50k-75k, 0.4% for AGIs $100k-200k, 0.3% for AGIs over 200k)
Total itemized deductions: $34,736 (19% of AGI, reported on 41.2% of returns)
Here:
$34,736
State:
$25,197
Here:
19.4% of AGI
State:
22.4% of AGI
(% of AGI for various income ranges: 12.4% for AGIs below $25k, 11.8% for AGIs $25k-50k, 16.6% for AGIs $50k-75k, 17.8% for AGIs $75k-100k, 18.4% for AGIs $100k-200k, 15.0% for AGIs over 200k)
Charity contributions: $12,588 (reported on 35.8% of returns)
Here:
$12,588
State:
$8,502
(% of AGI for various income ranges: 1.6% for AGIs below $25k, 2.2% for AGIs $25k-50k, 3.5% for AGIs $50k-75k, 4.3% for AGIs $75k-100k, 4.6% for AGIs $100k-200k, 6.1% for AGIs over 200k)
Taxes paid: $10,886 (reported on 41.1% of returns)
84117:
$10,886
State:
$7,001
(% of AGI for various income ranges: 2.4% for AGIs below $25k, 2.7% for AGIs $25k-50k, 4.3% for AGIs $50k-75k, 5.2% for AGIs $75k-100k, 6.3% for AGIs $100k-200k, 5.0% for AGIs over 200k)
Earned income credit: $1,946 (reported on 12.1% of returns)
Here:
$1,946
State:
$2,259
(% of AGI for various income ranges: 4.2% for AGIs below $25k, 0.7% for AGIs $25k-50k)
Percentage of individuals using paid preparers for their 2012 taxes: 54.2%
Here:
54%
State:
51%
(% for various income ranges: 49.8% for AGIs below $25k, 48.1% for AGIs $25k-50k, 53.9% for AGIs $50k-75k, 55.7% for AGIs $75k-100k, 63.8% for AGIs $100k-200k, 82.7% for AGIs over 200k)
Averages for the 2004 tax year for zip code 84117, filed in 2005:
Average Adjusted Gross Income (AGI) in 2004: $60,343 (Individual Income Tax Returns)
Here:
$60,343
State:
$45,498
Salary/wage: $47,412 (reported on 78.4% of returns)
Here:
$47,412
State:
$38,975
(% of AGI for various income ranges: 71.6% for AGIs $10k-25k, 74.5% for AGIs $25k-50k, 70.1% for AGIs $50k-75k, 68.1% for AGIs $75k-100k, 47.3% for AGIs over 100k)
Taxable interest for individuals: $3,318 (reported on 57.7% of returns)
This zip code:
$3,318
Utah:
$1,445
(% of AGI for various income ranges: 2.5% for AGIs $10k-25k, 1.8% for AGIs $25k-50k, 2.2% for AGIs $50k-75k, 2.0% for AGIs $75k-100k, 3.3% for AGIs over 100k)
Taxable dividends: $8,369 (reported on 32.9% of returns)
Here:
$8,369
State:
$3,152
(% of AGI for various income ranges: 2.5% for AGIs $10k-25k, 1.7% for AGIs $25k-50k, 2.0% for AGIs $50k-75k, 2.2% for AGIs $75k-100k, 5.9% for AGIs over 100k)
Net capital gain/loss: +$29,021 (reported on 29.9% of returns)
Here:
+$29,021
State:
+$14,059
(% of AGI for various income ranges: 1.2% for AGIs $10k-25k, 0.9% for AGIs $25k-50k, 2.2% for AGIs $50k-75k, 2.4% for AGIs $75k-100k, 21.9% for AGIs over 100k)
Profit/loss from business: +$13,566 (reported on 17.6% of returns)
Here:
+$13,566
State:
+$6,903
(% of AGI for various income ranges: 4.6% for AGIs $10k-25k, 2.9% for AGIs $25k-50k, 2.7% for AGIs $50k-75k, 3.7% for AGIs $75k-100k, 4.1% for AGIs over 100k)
IRA payment deduction: $3,227 (reported on 2.7% of returns)
84117:
$3,227
Utah:
$2,970
(% of AGI for various income ranges: 0.3% for AGIs $10k-25k, 0.2% for AGIs $25k-50k, 0.2% for AGIs $50k-75k, 0.2% for AGIs $75k-100k, 0.1% for AGIs over 100k)
Self-employed pension: $15,545 (reported on 1.2% of returns)
Here:
$15,545
Utah:
$14,916
(% of AGI for various income ranges: 0.1% for AGIs $25k-50k, 0.1% for AGIs $50k-75k, 0.3% for AGIs $75k-100k, 0.4% for AGIs over 100k)
Total itemized deductions: $25,886 (22% of AGI, reported on 43.0% of returns)
Here:
$25,886
State:
$20,312
Here:
22.1% of AGI
State:
24.9% of AGI
(% of AGI for various income ranges: 14.2% for AGIs $10k-25k, 14.9% for AGIs $25k-50k, 19.4% for AGIs $50k-75k, 21.4% for AGIs $75k-100k, 17.1% for AGIs over 100k)
Charity contributions deductions: $9,452 (8% of AGI, reported on 39.4% of returns)
Here:
$9,452
State:
$6,250
Here:
7.7% of AGI
State:
7.4% of AGI
(% of AGI for various income ranges: 2.2% for AGIs $10k-25k, 3.0% for AGIs $25k-50k, 4.7% for AGIs $50k-75k, 5.2% for AGIs $75k-100k, 7.4% for AGIs over 100k)
Total tax: $11,355 (reported on 78.6% of returns)
84117:
$11,355
State:
$6,523
(% of AGI for various income ranges: 4.4% for AGIs $10k-25k, 7.1% for AGIs $25k-50k, 9.2% for AGIs $50k-75k, 10.1% for AGIs $75k-100k, 18.6% for AGIs over 100k)
Earned income credit: $1,453 (reported on 9.9% of returns)
Here:
$1,453
State:
$1,703
Percentage of individuals using paid preparers for their 2004 taxes: 56.9%
Here:
57%
State:
53%
(% for various income ranges: 52.1% for AGIs below $10k, 54.2% for AGIs $10k-25k, 52.9% for AGIs $25k-50k, 59.6% for AGIs $50k-75k, 58.4% for AGIs $75k-100k, 72.6% for AGIs over 100k)
Likely homosexual households (counted as self-reported same-sex unmarried-partner households)
Lesbian couples: 0.2% of all households
Gay men: 0.0% of all households
Household received Food Stamps/SNAP in the past 12 months: 406 Household did not receive Food Stamps/SNAP in the past 12 months: 10,626
Women who had a birth in the past 12 months: 255 (196 now married, 55 unmarried) Women who did not have a birth in the past 12 months: 5,722 (2,199 now married, 3,543 unmarried)
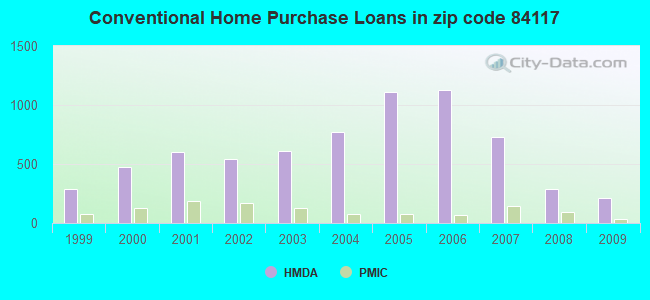
Housing units in zip code 84117 with a mortgage: 4,279 (474 second mortgage, 33 home equity loan, 390 both second mortgage and home equity loan) Houses without a mortgage: 105
Median monthly owner costs for units with a mortgage: $1,982 Median monthly owner costs for units without a mortgage: $707
Residents with income below the poverty level in 2022:
This zip code:
6.5%
Whole state:
8.2%
Residents with income below 50% of the poverty level in 2022:
This zip code:
2.6%
Whole state:
4.3%
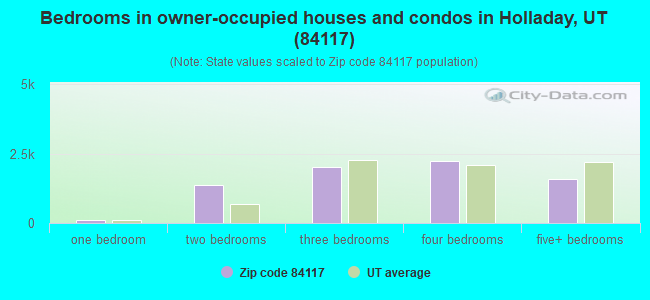
Median number of rooms in houses and condos:
Here:
7.2
State:
7.6
Median number of rooms in apartments:
Here:
4.2
State:
4.3
Notable locations in this zip code not listed on our city pages
Notable locations in zip code 84117: Ivy Place Shopping Village (A), Village Professional Building Condominium (B), Classics Condominium (C), Unified Fire Authority Station 104 (D). Display/hide their locations on the map
Shopping Centers: Holladay Village Center Shopping Center (1), Cottonwood Mall Shopping Center (2), Creekside Place Shopping Center (3). Display/hide their locations on the map
Churches in zip code 84117 include: The Church of Jesus Christ of Latter Day Saints (A), Third Church of Christ Scientist (B), Holladay United Church of Christ (C), Jehovahs Witnesses Holladay Congregation (D), Prophet Elias Greek Orthodox Church (E), Saint Vincents Catholic Church (F), The Church of Jesus Christ of Latter Day Saints (G). Display/hide their locations on the map
Parks in zip code 84117 include: Big Cottonwood Barrier Free Park (1), Big Cottonwood Regional Park (2), Detention Basin Park (3). Display/hide their locations on the map
Tourist attractions (not listed on the city page) : Itech Center (Amusement & Theme Parks; 4835 Highland Drive), Mormon Heritage Association (Tours & Charters; 1840 Moor Mont Drive).
3,231 married couples with children.
945 single-parent households (231 men, 714 women).
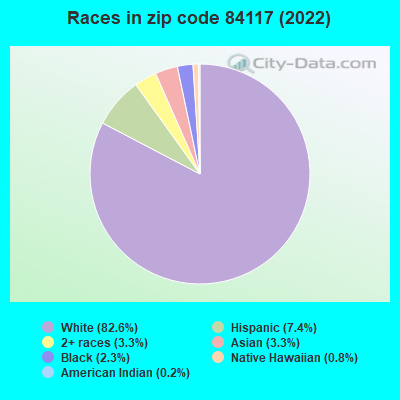
89.0% of residents of 84117 zip code speak English at home.
4.6% of residents speak Spanish at home (79% very well, 16% well, 4% not well).
4.2% of residents speak other Indo-European language at home (89% very well, 5% well, 4% not well, 2% not at all).
1.3% of residents speak Asian or Pacific Island language at home (40% very well, 40% well, 11% not well, 9% not at all).
1.0% of residents speak other language at home (52% very well, 24% well, 24% not well).
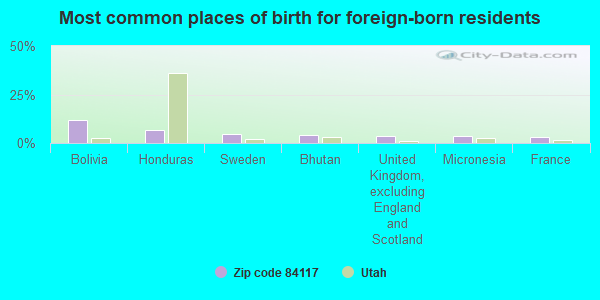
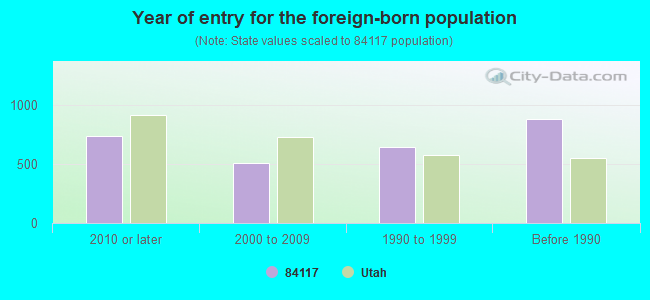
Foreign born population: 2,392 (9.4%) (53.5% of them are naturalized citizens)
Major facilities with environmental interests located in this zip code:
BOB JONES TIRE CORP (4621 SOUTH 900 EAST in SALT LAKE CITY, UT)
AIR MINOR (AIRS/AFS) ENFORCEMENT/COMPLIANCE ACTIVITY (Integrated Compliance Information System) - ICIS-08-2003-0149, FORMAL ENFORCEMENT ACTION, ICIS-08-2003-0150, (Integrated Compliance Information System) - ICIS-08-2003-0149, FORMAL ENFORCEMENT ACTION, ICIS-08-2003-0150, Conditionally Exempt Small Quantity Generators, less than 100 kg/month of hazardous waste (Resource Conservation and Recovery Act (tracking hazardous waste)) - notification Business SIC classification: AUTOMOTIVE SERVICES, EXCEPT REPAIR AND CARWASHES Organizations: ROBERT B JONES (CONTACT/OWNER)
HOLLIDAY WATER CO (1887 EAST 4500 SOUTH in SALT LAKE CITY, UT)
ENFORCEMENT/COMPLIANCE ACTIVITY (Integrated Compliance Information System) - ICIS-08-1992-0259, FORMAL ENFORCEMENT ACTION (Integrated Compliance Information System) - ICIS-08-1992-0259, FORMAL ENFORCEMENT ACTION National Pollutant Discharge Elimination System NON-MAJOR (Tracking pollutant discharge elimination systems) - permit Business SIC classification: CHEMICALS AND CHEMICAL PREPARATIONS Alternative names: HOLIDAY WATER CO
GULL LABORATORIES (1011 E MURRAY HOLLADY RD in SALT LAKE CITY, UT)
STATE MASTER (Utah compliance and permitting operations) - SQG DATABASE-7, CESQG (Resource Conservation and Recovery Act (tracking hazardous waste)) TRI REPORTER (Tracking of toxic chemicals releasing facilities) Business SIC classification: SURGICAL AND MEDICAL INSTRUMENTS AND APPARATUS Organizations: GULL LABORATORIES INC (CONTACT/OWNER)
CHEVRON USA - 74811 RANDY MOSER CHEVRON (5590 SOUTH 900 EAST in SALT LAKE CITY, UT)
STATE MASTER (Utah compliance and permitting operations) - UST DATABASE-4, UNDERGROUND STORAGE TANK PROGRAM Small Quantity Generators, between 100 kg and 1000 kg of hazardous waste/month (Resource Conservation and Recovery Act (tracking hazardous waste)) - notification Organizations: CHEVRON USA PRODUCTS COMPANY (CONTACT/OWNER)
Alternative names: CHEVRON #74811
JIFFY LUBE (2350 EAST 4500 SOUTH in SALT LAKE CITY, UT)
STATE MASTER (Utah compliance and permitting operations) - USED OIL TRACKING SY-2, USED OIL PROGRAM Small Quantity Generators, between 100 kg and 1000 kg of hazardous waste/month (Resource Conservation and Recovery Act (tracking hazardous waste)) - notification Organizations: OILWELL INC (CONTACT/OWNER)
Alternative names: JIFFY LUBE HOLLADAY
MOORE HALL US ARMY RESERVE CNTR (4550 SOUTH 1300 EAST in SALT LAKE CITY, UT) . Federal Facility. U.S. ARMY
STATE MASTER (Utah compliance and permitting operations) - UST DATABASE-4, UNDERGROUND STORAGE TANK PROGRAM Conditionally Exempt Small Quantity Generators, less than 100 kg/month of hazardous waste (Resource Conservation and Recovery Act (tracking hazardous waste)) - notification Organizations: GENERAL SERVICES ADMINISTRATION (CONTACT/OWNER)
Alternative names: U S A R C
BONNEVILLE JR HIGH (5330 S 1660 E in SALT LAKE CITY, UT)
(National Center for Education Statistics) - STATE ID-12 402 Organizations: GRANITE SCHOOL DISTRICT (SCHOOL DISTRICT)
HOLLADAY ELEM SCH (4580 S 2300 E in SALT LAKE CITY, UT)
(National Center for Education Statistics) - STATE ID-12 136 Organizations: GRANITE SCHOOL DISTRICT (SCHOOL DISTRICT)
MEADOW MOOR ELEM SCH (5315 S 1700 E in SALT LAKE CITY, UT)
(National Center for Education Statistics) - STATE ID-12 157 Organizations: GRANITE SCHOOL DISTRICT (SCHOOL DISTRICT)
HOLLADAY FARMS SUBDIVISION (4600 SOUTH HIGHLAND DRIVE in HOLLADAY, UT)
National Pollutant Discharge Elimination System NON-MAJOR (Tracking pollutant discharge elimination systems) - permit National Pollutant Discharge Elimination System NON-MAJOR (Tracking pollutant discharge elimination systems) - permit Business SIC classification: GENERAL CONTRACTORS-SINGLE-FAMILY HOUSES; NONCLASSIFIABLE ESTABLISHMENTS Alternative names: JAR DEVELOPMENT
IVORY HOMES SHADOW CREST SUB-D (1700 EAST 12600 SOUTH in SALT LAKE CITY, UT)
National Pollutant Discharge Elimination System NON-MAJOR (Tracking pollutant discharge elimination systems) - permit Business SIC classification: GENERAL CONTRACTORS-NONRESIDENTIAL BUILDINGS, OTHER THAN INDUSTRIAL BUILDINGS AND WAREHOUSES
HARPER EXCAVATION (6000 SOUTH 3200 E. PIT #15 in HOLLADAY, UT)
AIR MINOR (AIRS/AFS) Business SIC classification: CONSTRUCTION SAND AND GRAVEL
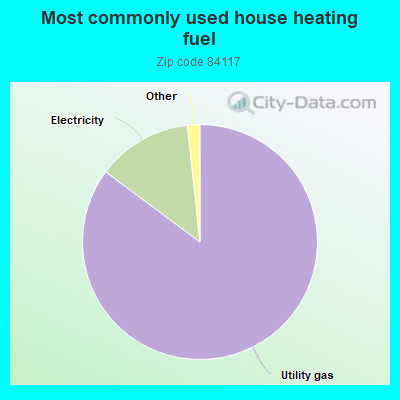
Housing units lacking complete kitchen facilities: 1.3%
85.2%Utility gas
13.1%Electricity
0.5%Solar energy
0.5%No fuel used
Population in 1990: 23,063. Population change in the 1990s: +909 (+3.9%).
Place of birth for U.S.-born residents:
This state: 14,283
Northeast: 989
Midwest: 1,523
South: 1,381
West: 4,521
57% of the 84117 zip code residents lived in the same house 5 years ago. Out of people who lived in different houses, 66% lived in this county. Out of people who lived in different counties, 50% lived in Utah.
88% of the 84117 zip code residents lived in the same house 1 year ago. Out of people who lived in different houses, 60% moved from this county. Out of people who lived in different houses, 11% moved from different county within same state. Out of people who lived in different houses, 21% moved from different state. Out of people who lived in different houses, 6% moved from abroad.
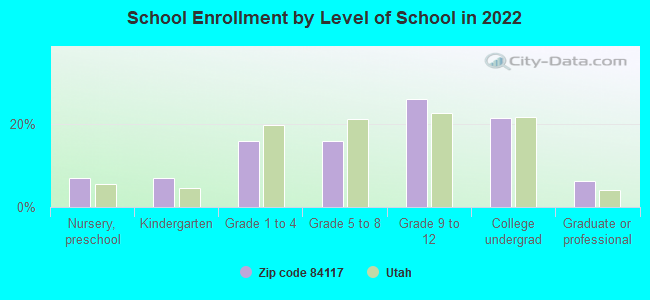
Private vs. public school enrollment:
Students in private schools in grades 1 to 8 (elementary and middle school): 276
Here:
16.5%
Utah:
7.2%
Students in private schools in grades 9 to 12 (high school): 229
Here:
16.7%
Utah:
5.3%
Students in private undergraduate colleges: 346
Here:
30.9%
Utah:
26.7%
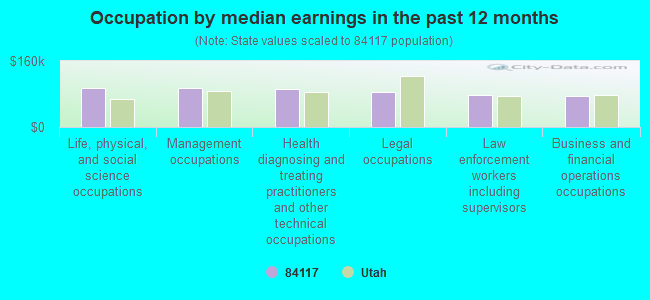
Occupation by median earnings in the past 12 months ($)
94,549Life, physical, and social science occupations
94,501Management occupations
93,216Health diagnosing and treating practitioners and other technical occupations
85,243Legal occupations
77,411Law enforcement workers including supervisors
74,299Business and financial operations occupations
Companies with federal contracts located in this zip code:
LIVEWIRE TEST LABS, INC (5330 SOUTH 900 EAST, SUITE in MURRAY, UT; small business) : $1,008,498 in 7 contractsfrom 2004 to 2006
Contracts for Defense Aircraft -- Management and Support (R&D), Defense Electronics and Communication Equipment -- Basic Research (R&D), Engineering -- Basic Research (R&D) by Air Force, Navy Signed by year:2000: $0; 2001: $0; 2002: $0; 2003: $0; 2004: $178,602; 2005: $454,948; 2006: $374,948.
Biggest contracts:
$245,000 with Air Force for Defense Aircraft -- Management and Support (R&D). Signed on 2005-03-25. Completion date: 2007-06-28.
$197,240, same as above.Signed on 2006-03-29. Completion date: 2007-06-28.
$177,708, same as above.Signed on 2006-01-27. Completion date: 2007-06-28.
$130,000, same as above.Signed on 2005-03-02. Completion date: 2007-06-28.
CRESTVIEW LLC (10424 S 2700 W in SALT LAKE CITY, UT) 10 employees, $1000000 revenue: $529,000 in 4 contractsfrom 2001 to 2002
$252,000 with Department of State for Lodging - Hotel/Motel. Signed on 2001-11-15. Completion date: 2002-02-15.
$250,000 with Office of Assistant Secretary for Health except national centers (disused code) for Lease or Rental of Facilities -- Family Housing Facilities. Signed on 2001-05-15. Completion date: 2002-02-15.
$27,000 with Department of State for Lodging - Hotel/Motel. Signed on 2002-02-15. Completion date: 2002-02-15.
$0, same as above.Signed on 2002-02-15. Completion date: 2002-02-15.
MOUNTAIN MOBILITY GROUP, LLC (4574 SOUTH WELLINGTON STRE in SALT LAKE CITY, UT; small business) : $346,934 in 16 contractsfrom 2004 to 2006
Contracts for Other Defense -- Operational Systems Development (R&D), Individual Equipment, Athletic and Sporting Equipment, Other Education and Training Services, and moreby Army, U.S. Special Operations Command, Department of Defense Signed by year:2000: $0; 2001: $0; 2002: $0; 2003: $0; 2004: $220,753; 2005: $75,023; 2006: $51,158.
Biggest contracts:
$110,000 with Army for Other Defense -- Operational Systems Development (R&D). Signed on 2004-03-16. Completion date: 2004-12-03.
$77,317 with Army for Individual Equipment. Signed on 2004-06-28. Completion date: 2004-07-19.
$25,120 with U.S. Special Operations Command for Athletic and Sporting Equipment. Taking place in VA. Signed on 2004-05-18. Completion date: 2004-05-29.
$19,494 with U.S. Special Operations Command for Other Education and Training Services. Signed on 2006-02-02. Completion date: 2006-02-14.
MARK F TWIGHT (4574 SOUTH WELLINGTON STRE in HOLLADAY, UT; small business) : $15,188 in 5 contractsfrom 2002 to 2005
Contracts for Patent and Trademark Services, Technical Assistance by Army Signed by year:2000: $0; 2001: $0; 2002: $19,987; 2003: $0; 2004: $0; 2005: -$4,799; 2006: $0.
Biggest contracts:
$19,975 with Army for Patent and Trademark Services. Signed on 2002-08-08. Completion date: 2003-03-06.
$12 with Army for Technical Assistance. Signed on 2002-07-15. Completion date: 2002-04-26.
$0 with Army for Patent and Trademark Services. Signed on 2005-10-26. Completion date: 2003-03-06.
$0 with Army for Technical Assistance. Signed on 2002-07-15. Completion date: 2002-04-26.
SPORTS MALL, INC (5445 SOUTH 900 EAST in SALT LAKE CITY, UT; small business)
$5,616 with Army for Recreational Services. Taking place in CO. Signed on 2002-11-27. Completion date: 2003-11-30.
RELAX THE BACK STORE (4862 SOUTH HIGHLAND DRIVE in SALT LAKE CITY, UT; small business) : $5,225 in 2 contractsin 2002
$4,750 with Army for Office Furniture. Signed on 2002-09-23. Completion date: 2002-10-06.
$475, same as above.Signed on 2002-02-27. Completion date: 2002-03-13.
DOLPHIN POOLS INC (4678 HIGHLAND DR in SALT LAKE CITY, UT; small business) : $1,923 in 2 contractsin 2004
$3,170 with Army for Chemicals. Signed on 2004-05-20. Completion date: 2004-06-01.
-$1,247, same as above.Signed on 2004-06-29. Completion date: 2004-07-07.
Top industries in this zip code by the number of employees in 2005:
Health Care and Social Assistance: Nursing Care Facilities (100-249 employees: 2 establishments, 50-99 employees: 2 establishments)
2002 - 2018 National Fire Incident Reporting System (NFIRS) incidents
Based on the data from the years 2002 - 2018 the average number of fire incidents per year is 54. The highest number of fires - 132 took place in 2003, and the least - 9 in 2010. The data has a declining trend.
When looking into fire subcategories, the most incidents belonged to: Structure Fires (41.1%), and Outside Fires (34.7%).
Fire incident types reported to NFIRS in Zip Code 84117


 Nearest zip codes: 84124, 84107, 84106, 84093, 84047, 84115.


 Based on the data from the years 2002 - 2018 the average number of fire incidents per year is 54. The highest number of fires - 132 took place in 2003, and the least - 9 in 2010. The data has a declining trend.
 When looking into fire subcategories, the most incidents belonged to: Structure Fires (41.1%), and Outside Fires (34.7%).