Estimated zip code population in 2022: 25,073 Zip code population in 2010: 23,130 Zip code population in 2000: 25,324
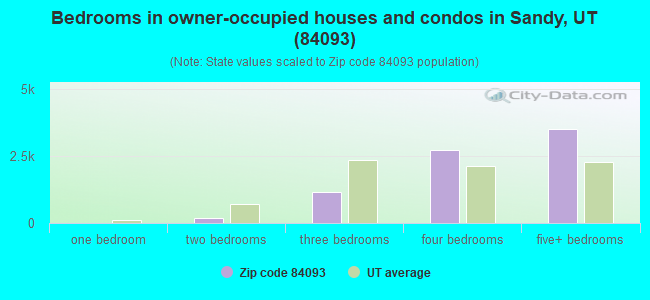
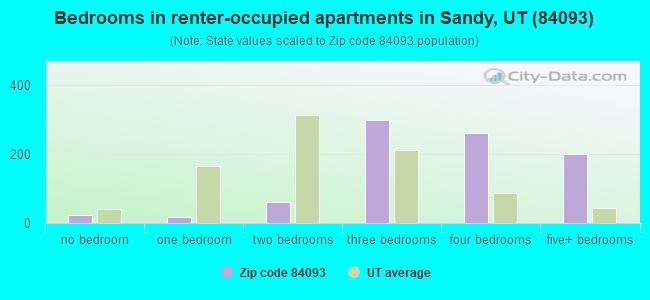
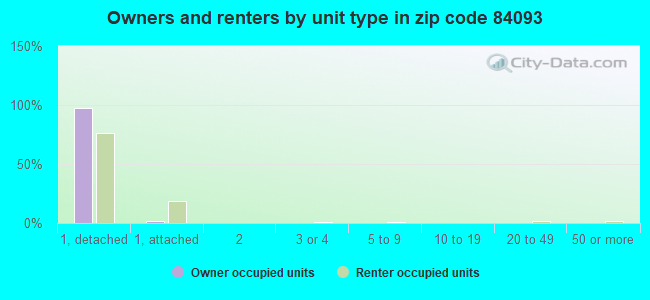
Houses and condos: 8,516 Renter-occupied apartments: 842
% of renters here:
10%
State:
29%
March 2022 cost of living index in zip code 84093: 95.1 (less than average, U.S. average is 100)
Land area: 5.4 sq. mi. Water area: 0.0 sq. mi.
Population density: 4,623 people per square mile
(average).
OSM Map
General Map
Google Map
MSN Map
OSM Map
General Map
Google Map
MSN Map
OSM Map
General Map
Google Map
MSN Map
OSM Map
General Map
Google Map
MSN Map
Please wait while loading the map...
Real estate property taxes paid for housing units in 2022:
This zip code:
0.5% ($3,388)
Utah:
0.5% ($2,376)
Median real estate property taxes paid for housing units with mortgages in 2022: $3,319 (0.5%) Median real estate property taxes paid for housing units with no mortgage in 2022: $3,527 (0.5%)
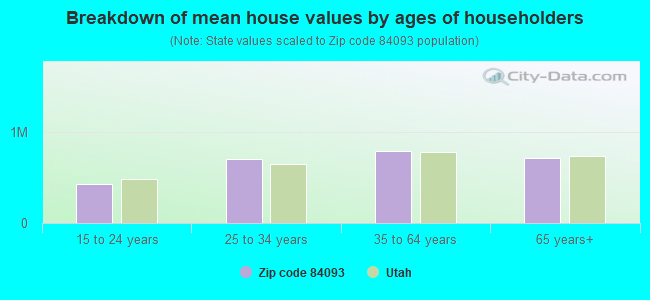
Estimated median house/condo value in 2022: $723,511
84093:
$723,511
Utah:
$499,500
According to our research of Utah and other state lists, there were 23 registered sex offenders living in 84093 zip code as of April 27, 2024. The ratio of all residents to sex offenders in zip code 84093 is 1,049 to 1. The ratio of registered sex offenders to all residents in this zip code is much lower than the state average.
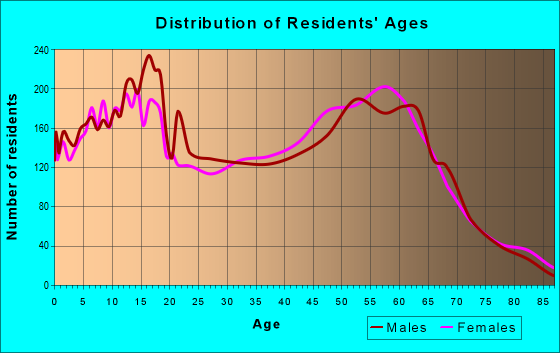
Median resident age:
This zip code:
40.5 years
Utah median age:
32.1 years
Average household size:
This zip code:
3.0 people
Utah:
3.0 people
Averages for the 2020 tax year for zip code 84093, filed in 2021:
Average Adjusted Gross Income (AGI) in 2020: $132,581 (Individual Income Tax Returns)
Here:
$132,581
State:
$81,660
Salary/wage: $90,783 (reported on 80.0% of returns)
Here:
$90,783
State:
$63,027
(% of AGI for various income ranges: 1242.3% for AGIs below $25k, 3707.5% for AGIs $25k-50k, 6208.5% for AGIs $50k-75k, 9763.4% for AGIs $75k-100k, 19423.4% for AGIs $100k-200k, 72651.0% for AGIs over 200k)
Taxable interest for individuals: $4,531 (reported on 47.1% of returns)
This zip code:
$4,531
Utah:
$2,255
(% of AGI for various income ranges: 35.5% for AGIs below $25k, 66.2% for AGIs $25k-50k, 128.0% for AGIs $50k-75k, 159.8% for AGIs $75k-100k, 261.8% for AGIs $100k-200k, 3331.6% for AGIs over 200k)
Ordinary dividends: $8,617 (reported on 31.6% of returns)
Here:
$8,617
State:
$7,362
(% of AGI for various income ranges: 45.8% for AGIs below $25k, 96.9% for AGIs $25k-50k, 131.2% for AGIs $50k-75k, 258.8% for AGIs $75k-100k, 519.5% for AGIs $100k-200k, 3706.3% for AGIs over 200k)
Net capital gain/loss in AGI: +$64,096 (reported on 31.3% of returns)
Here:
+$64,096
State:
+$43,433
(% of AGI for various income ranges: 31.0% for AGIs below $25k, 81.8% for AGIs $25k-50k, 233.5% for AGIs $50k-75k, 353.0% for AGIs $75k-100k, 947.4% for AGIs $100k-200k, 41029.4% for AGIs over 200k)
Profit/loss from business: +$17,124 (reported on 18.6% of returns)
Here:
+$17,124
State:
+$9,957
(% of AGI for various income ranges: 112.2% for AGIs below $25k, 178.7% for AGIs $25k-50k, 336.8% for AGIs $50k-75k, 337.5% for AGIs $75k-100k, 441.3% for AGIs $100k-200k, 4045.3% for AGIs over 200k)
Taxable individual retirement arrangement distribution: $25,354 (reported on 12.6% of returns)
84093:
$25,354
Utah:
$21,167
(% of AGI for various income ranges: 75.7% for AGIs below $25k, 192.9% for AGIs $25k-50k, 448.3% for AGIs $50k-75k, 548.9% for AGIs $75k-100k, 942.4% for AGIs $100k-200k, 2384.5% for AGIs over 200k)
Self-employed (Keogh) retirement plans: $26,540 (reported on 0.9% of returns)
84093:
$26,540
Utah:
$29,069
(% of AGI for various income ranges: 46.7% for AGIs $100k-200k, 416.7% for AGIs over 200k)
Total itemized deductions: $48,373 (reported on 22.7% of returns)
Here:
$48,373
State:
$41,056
(% of AGI for various income ranges: 79.3% for AGIs below $25k, 231.8% for AGIs $25k-50k, 637.0% for AGIs $50k-75k, 1060.8% for AGIs $75k-100k, 2287.3% for AGIs $100k-200k, 15033.3% for AGIs over 200k)
Charity contributions: $29,767 (reported on 20.0% of returns)
Here:
$29,767
State:
$22,261
(% of AGI for various income ranges: 6.4% for AGIs below $25k, 44.6% for AGIs $25k-50k, 148.5% for AGIs $50k-75k, 276.7% for AGIs $75k-100k, 785.1% for AGIs $100k-200k, 10396.1% for AGIs over 200k)
Taxes paid: $8,677 (reported on 22.5% of returns)
84093:
$8,677
State:
$7,985
(% of AGI for various income ranges: 12.5% for AGIs below $25k, 58.1% for AGIs $25k-50k, 155.5% for AGIs $50k-75k, 264.5% for AGIs $75k-100k, 636.5% for AGIs $100k-200k, 1854.1% for AGIs over 200k)
Earned income credit: $1,761 (reported on 6.8% of returns)
Here:
$1,761
State:
$2,169
(% of AGI for various income ranges: 44.0% for AGIs below $25k, 40.7% for AGIs $25k-50k, 1.5% for AGIs $50k-75k)
Percentage of individuals using paid preparers for their 2020 taxes: 93.1%
Here:
93%
State:
94%
(% for various income ranges: 91.2% for AGIs below $25k, 93.2% for AGIs $25k-50k, 93.0% for AGIs $50k-75k, 93.5% for AGIs $75k-100k, 93.7% for AGIs $100k-200k, 95.4% for AGIs over 200k)
Averages for the 2012 tax year for zip code 84093, filed in 2013:
Average Adjusted Gross Income (AGI) in 2012: $96,831 (Individual Income Tax Returns)
Here:
$96,831
State:
$60,327
Salary/wage: $68,764 (reported on 84.1% of returns)
Here:
$68,764
State:
$48,762
(% of AGI for various income ranges: 78.5% for AGIs below $25k, 73.6% for AGIs $25k-50k, 71.7% for AGIs $50k-75k, 73.3% for AGIs $75k-100k, 74.8% for AGIs $100k-200k, 42.2% for AGIs over 200k)
Taxable interest for individuals: $2,958 (reported on 50.8% of returns)
This zip code:
$2,958
Utah:
$1,534
(% of AGI for various income ranges: 1.9% for AGIs below $25k, 1.2% for AGIs $25k-50k, 1.3% for AGIs $50k-75k, 0.9% for AGIs $75k-100k, 0.9% for AGIs $100k-200k, 2.1% for AGIs over 200k)
Ordinary dividends: $6,257 (reported on 27.8% of returns)
Here:
$6,257
State:
$5,711
(% of AGI for various income ranges: 1.8% for AGIs below $25k, 1.4% for AGIs $25k-50k, 1.5% for AGIs $50k-75k, 1.4% for AGIs $75k-100k, 1.3% for AGIs $100k-200k, 2.3% for AGIs over 200k)
Net capital gain/loss in AGI: +$30,646 (reported on 26.0% of returns)
Here:
+$30,646
State:
+$23,734
(% of AGI for various income ranges: 0.3% for AGIs $25k-50k, 0.8% for AGIs $50k-75k, 0.9% for AGIs $75k-100k, 1.7% for AGIs $100k-200k, 16.8% for AGIs over 200k)
Profit/loss from business: +$14,639 (reported on 18.5% of returns)
Here:
+$14,639
State:
+$8,845
(% of AGI for various income ranges: 6.1% for AGIs below $25k, 4.9% for AGIs $25k-50k, 2.7% for AGIs $50k-75k, 2.3% for AGIs $75k-100k, 2.9% for AGIs $100k-200k, 2.2% for AGIs over 200k)
Taxable individual retirement arrangement distribution: $19,615 (reported on 11.5% of returns)
84093:
$19,615
Utah:
$15,565
(% of AGI for various income ranges: 3.7% for AGIs below $25k, 3.6% for AGIs $25k-50k, 2.7% for AGIs $50k-75k, 3.4% for AGIs $75k-100k, 2.8% for AGIs $100k-200k, 1.5% for AGIs over 200k)
Self-employment retirement plans: $21,050 (reported on 0.9% of returns)
84093:
$21,050
Utah:
$22,655
(% of AGI for various income ranges: 0.2% for AGIs $25k-50k, 0.2% for AGIs $100k-200k, 0.3% for AGIs over 200k)
Total itemized deductions: $33,868 (21% of AGI, reported on 50.7% of returns)
Here:
$33,868
State:
$25,197
Here:
20.9% of AGI
State:
22.4% of AGI
(% of AGI for various income ranges: 14.6% for AGIs below $25k, 17.0% for AGIs $25k-50k, 19.9% for AGIs $50k-75k, 20.5% for AGIs $75k-100k, 18.5% for AGIs $100k-200k, 16.6% for AGIs over 200k)
Charity contributions: $13,618 (reported on 45.5% of returns)
Here:
$13,618
State:
$8,502
(% of AGI for various income ranges: 1.7% for AGIs below $25k, 3.3% for AGIs $25k-50k, 4.2% for AGIs $50k-75k, 5.1% for AGIs $75k-100k, 5.0% for AGIs $100k-200k, 8.7% for AGIs over 200k)
Taxes paid: $10,139 (reported on 50.5% of returns)
84093:
$10,139
State:
$7,001
(% of AGI for various income ranges: 2.7% for AGIs below $25k, 3.6% for AGIs $25k-50k, 5.0% for AGIs $50k-75k, 5.8% for AGIs $75k-100k, 6.3% for AGIs $100k-200k, 5.1% for AGIs over 200k)
Earned income credit: $1,724 (reported on 9.9% of returns)
Here:
$1,724
State:
$2,259
(% of AGI for various income ranges: 3.4% for AGIs below $25k, 0.8% for AGIs $25k-50k)
Percentage of individuals using paid preparers for their 2012 taxes: 52.0%
Here:
52%
State:
51%
(% for various income ranges: 44.1% for AGIs below $25k, 51.1% for AGIs $25k-50k, 55.3% for AGIs $50k-75k, 51.7% for AGIs $75k-100k, 55.4% for AGIs $100k-200k, 74.1% for AGIs over 200k)
Averages for the 2004 tax year for zip code 84093, filed in 2005:
Average Adjusted Gross Income (AGI) in 2004: $63,535 (Individual Income Tax Returns)
Here:
$63,535
State:
$45,498
Salary/wage: $53,656 (reported on 86.0% of returns)
Here:
$53,656
State:
$38,975
(% of AGI for various income ranges: 77.2% for AGIs $10k-25k, 76.3% for AGIs $25k-50k, 77.4% for AGIs $50k-75k, 79.1% for AGIs $75k-100k, 59.2% for AGIs over 100k)
Taxable interest for individuals: $2,302 (reported on 60.4% of returns)
This zip code:
$2,302
Utah:
$1,445
(% of AGI for various income ranges: 2.2% for AGIs $10k-25k, 2.0% for AGIs $25k-50k, 1.2% for AGIs $50k-75k, 1.3% for AGIs $75k-100k, 2.0% for AGIs over 100k)
Taxable dividends: $3,296 (reported on 31.6% of returns)
Here:
$3,296
State:
$3,152
(% of AGI for various income ranges: 1.7% for AGIs $10k-25k, 1.6% for AGIs $25k-50k, 1.1% for AGIs $50k-75k, 0.9% for AGIs $75k-100k, 1.6% for AGIs over 100k)
Net capital gain/loss: +$19,923 (reported on 28.6% of returns)
Here:
+$19,923
State:
+$14,059
(% of AGI for various income ranges: 0.3% for AGIs $10k-25k, 1.3% for AGIs $25k-50k, 2.1% for AGIs $50k-75k, 1.5% for AGIs $75k-100k, 12.2% for AGIs over 100k)
Profit/loss from business: +$13,319 (reported on 19.3% of returns)
Here:
+$13,319
State:
+$6,903
(% of AGI for various income ranges: 6.0% for AGIs $10k-25k, 4.1% for AGIs $25k-50k, 3.9% for AGIs $50k-75k, 3.4% for AGIs $75k-100k, 3.6% for AGIs over 100k)
IRA payment deduction: $3,625 (reported on 3.5% of returns)
84093:
$3,625
Utah:
$2,970
(% of AGI for various income ranges: 0.2% for AGIs $10k-25k, 0.5% for AGIs $25k-50k, 0.3% for AGIs $50k-75k, 0.2% for AGIs $75k-100k, 0.1% for AGIs over 100k)
Self-employed pension: $17,441 (reported on 1.2% of returns)
Here:
$17,441
Utah:
$14,916
(% of AGI for various income ranges: 0.3% for AGIs $50k-75k, 0.1% for AGIs $75k-100k, 0.4% for AGIs over 100k)
Total itemized deductions: $25,408 (22% of AGI, reported on 51.5% of returns)
Here:
$25,408
State:
$20,312
Here:
22.1% of AGI
State:
24.9% of AGI
(% of AGI for various income ranges: 15.8% for AGIs $10k-25k, 22.5% for AGIs $25k-50k, 24.4% for AGIs $50k-75k, 22.7% for AGIs $75k-100k, 17.0% for AGIs over 100k)
Charity contributions deductions: $8,361 (7% of AGI, reported on 47.9% of returns)
Here:
$8,361
State:
$6,250
Here:
7.0% of AGI
State:
7.4% of AGI
(% of AGI for various income ranges: 2.3% for AGIs $10k-25k, 4.5% for AGIs $25k-50k, 5.6% for AGIs $50k-75k, 5.7% for AGIs $75k-100k, 6.5% for AGIs over 100k)
Total tax: $12,185 (reported on 77.6% of returns)
84093:
$12,185
State:
$6,523
(% of AGI for various income ranges: 4.9% for AGIs $10k-25k, 6.3% for AGIs $25k-50k, 7.6% for AGIs $50k-75k, 9.0% for AGIs $75k-100k, 18.2% for AGIs over 100k)
Earned income credit: $1,413 (reported on 7.6% of returns)
Here:
$1,413
State:
$1,703
Percentage of individuals using paid preparers for their 2004 taxes: 52.3%
Here:
52%
State:
53%
(% for various income ranges: 42.5% for AGIs below $10k, 47.0% for AGIs $10k-25k, 55.0% for AGIs $25k-50k, 55.2% for AGIs $50k-75k, 53.2% for AGIs $75k-100k, 64.3% for AGIs over 100k)
Household received Food Stamps/SNAP in the past 12 months: 182 Household did not receive Food Stamps/SNAP in the past 12 months: 8,151
Women who had a birth in the past 12 months: 339 (277 now married, 59 unmarried) Women who did not have a birth in the past 12 months: 4,881 (2,623 now married, 2,249 unmarried)
Housing units in zip code 84093 with a mortgage: 4,827 (782 second mortgage, 5 home equity loan, 727 both second mortgage and home equity loan) Houses without a mortgage: 89
Median monthly owner costs for units with a mortgage: $2,258 Median monthly owner costs for units without a mortgage: $667
Residents with income below the poverty level in 2022:
This zip code:
4.9%
Whole state:
8.2%
Residents with income below 50% of the poverty level in 2022:
This zip code:
2.4%
Whole state:
4.3%
Median number of rooms in houses and condos:
Here:
10.0
State:
7.6
Median number of rooms in apartments:
Here:
7.9
State:
4.3
Notable locations in this zip code not listed on our city pages
5,136 married couples with children.
860 single-parent households (181 men, 679 women).
93.0% of residents of 84093 zip code speak English at home.
1.6% of residents speak Spanish at home (84% very well, 14% well, 2% not well).
2.8% of residents speak other Indo-European language at home (77% very well, 18% well, 5% not well).
1.8% of residents speak Asian or Pacific Island language at home (73% very well, 9% well, 18% not well).
0.7% of residents speak other language at home (100% very well).
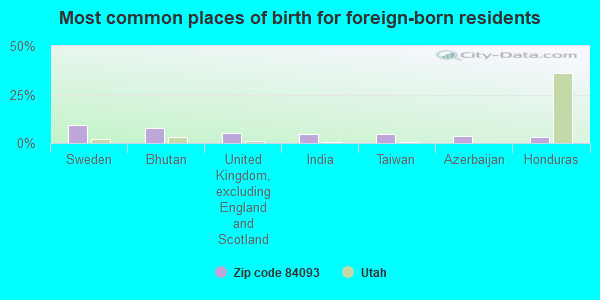
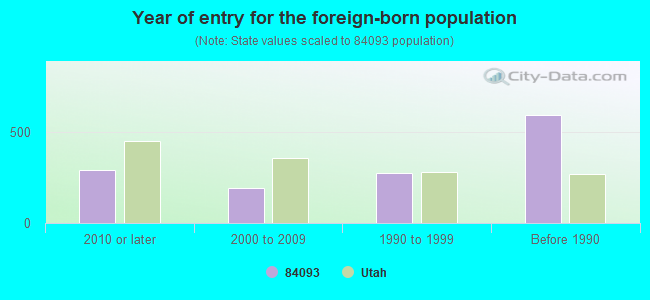
Foreign born population: 1,275 (5.1%) (68.7% of them are naturalized citizens)
Facilities with environmental interests located in this zip code:
ALBION MIDDLE SCHOOL (2755 E. NEWCASTLE DR. in SANDY, UT)
AIR MINOR (AIRS/AFS) STATE MASTER (Utah compliance and permitting operations) (Geographic Names Information System) (National Center for Education Statistics) - STATE ID-14 401 Business SIC classification: ELEMENTARY AND SECONDARY SCHOOLS Organizations: JORDAN SCHOOL DISTRICT (SCHOOL DISTRICT)
Alternative names: ALBION MIDDLE SCHOOL JORDAN MIDDLE
LITTLE COTTONWOOD WATER TREATMENT PLANT (9000 DANISH ROAD in SANDY, UT)
STATE MASTER (Utah compliance and permitting operations) - UST DATABASE-4, UNDERGROUND STORAGE TANK PROGRAM National Pollutant Discharge Elimination System NON-MAJOR (Tracking pollutant discharge elimination systems) - permit Business SIC classification: WATER SUPPLY Organizations: LITTLE COTTONWOOD WTP (CONTACT/OPERATOR)
, METROPOLITAN WATER DISTRICT (CONTACT/OWNER)
Alternative names: LITTLE COTTONWOOD TREATMENT, LITTLE COTTONWOOD WTP
BROOKWOOD ELEM SCH (8640 S SNOWBIRD DR in SANDY, UT)
(National Center for Education Statistics) - STATE ID-14 107 Organizations: JORDAN SCHOOL DISTRICT (SCHOOL DISTRICT)
CASTLE ROCK CONST. (1330 E 8085 S in SANDY, UT)
AIR MINOR (AIRS/AFS) Business SIC classification: CONCRETE BLOCK AND BRICK
HENRIES DRY CLEANING (2093 EAST 9400 SOUTH in SANDY, UT)
Conditionally Exempt Small Quantity Generators, less than 100 kg/month of hazardous waste (Resource Conservation and Recovery Act (tracking hazardous waste)) - notification Organizations: BOYD K. HENRIE (CONTACT/OWNER)
GREG & GARY CURTIS (8387 RED RIVER ROAD in SANDY, UT)
ENFORCEMENT/COMPLIANCE ACTIVITY (Integrated Compliance Information System)
Housing units lacking complete kitchen facilities: 0.5%
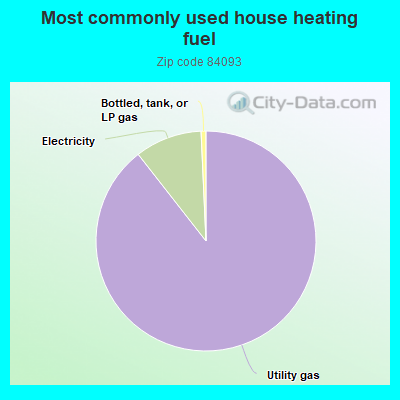
88.9%Utility gas
9.8%Electricity
0.7%Bottled, tank, or LP gas
Population in 1990: 26,702.
Place of birth for U.S.-born residents:
This state: 16,015
Northeast: 1,242
Midwest: 1,669
South: 1,124
West: 3,649
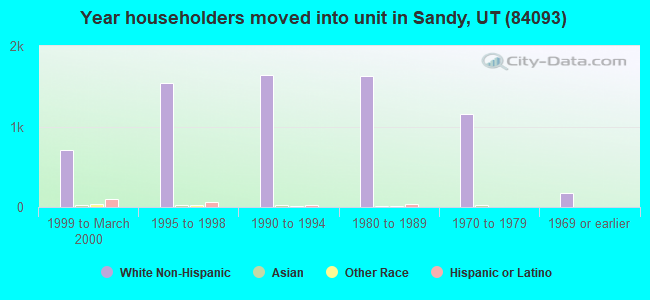
67% of the 84093 zip code residents lived in the same house 5 years ago. Out of people who lived in different houses, 63% lived in this county. Out of people who lived in different counties, 50% lived in Utah.
92% of the 84093 zip code residents lived in the same house 1 year ago. Out of people who lived in different houses, 69% moved from this county. Out of people who lived in different houses, 3% moved from different county within same state. Out of people who lived in different houses, 25% moved from different state. Out of people who lived in different houses, 2% moved from abroad.
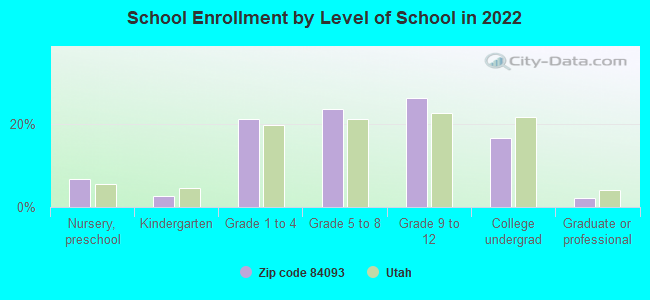
Private vs. public school enrollment:
Students in private schools in grades 1 to 8 (elementary and middle school): 315
Here:
10.3%
Utah:
7.2%
Students in private schools in grades 9 to 12 (high school): 159
Here:
8.9%
Utah:
5.3%
Students in private undergraduate colleges: 168
Here:
14.9%
Utah:
26.7%
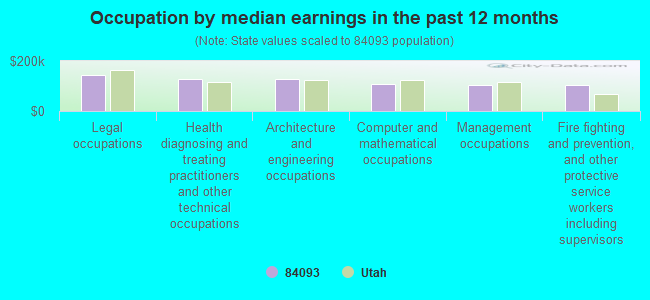
Occupation by median earnings in the past 12 months ($)
143,116Legal occupations
129,455Health diagnosing and treating practitioners and other technical occupations
127,037Architecture and engineering occupations
106,082Computer and mathematical occupations
105,498Management occupations
102,607Fire fighting and prevention, and other protective service workers including supervisors
Companies with federal contracts located in this zip code (SANDY, UT):
PARVOMEDICS INC (8152 S 1715 E; small business) : $433,656 in 19 contractsfrom 2001 to 2005
Contracts for Physical Properties Testing and Inspection, Replenishable Field Medical Sets, Kits, and Outfits, Medical and Surgical Instruments, Equipment, and Supplies, Navigational Instruments, and moreby Army, National Institutes of Health, Navy Signed by year:2000: $0; 2001: $46,800; 2002: $46,800; 2003: $95,610; 2004: $131,186; 2005: $113,260; 2006: $0.
Biggest contracts:
$46,800 with Army for Physical Properties Testing and Inspection. Signed on 2002-03-05. Completion date: 2002-04-10.
$46,800 with Army for Replenishable Field Medical Sets, Kits, and Outfits. Signed on 2001-02-12. Completion date: 2001-03-16.
$44,400 with National Institutes of Health for Medical and Surgical Instruments, Equipment, and Supplies. Signed on 2004-06-29. Effective on 2004-08-06. Completion date: 2004-09-13.
$41,560 with Army for Physical Properties Testing and Inspection. Signed on 2003-07-28. Completion date: 2003-08-29.
AMP COATING SOLUTIONS (1421 PLATA WAY; small business) : $174,394 in 7 contractsfrom 2001 to 2005
Contracts for Construction of Structures and Facilities -- Dining Facilities, Maintenance, Repair or Alteration of Real Property -- Office Buildings, Maintenance, Repair or Alteration of Real Property -- Maintenance Buildings by Navy, Air Force Signed by year:2000: $0; 2001: $29,028; 2002: $49,444; 2003: $0; 2004: $0; 2005: $95,922; 2006: $0.
Biggest contracts:
$72,500 with Navy for Construction of Structures and Facilities -- Dining Facilities. Taking place in IL. Signed on 2005-02-15. Completion date: 2005-04-11.
$51,994 with Air Force for Maintenance, Repair or Alteration of Real Property -- Office Buildings. Signed on 2002-09-30. Completion date: 2003-09-30.
$29,028 with Air Force for Maintenance, Repair or Alteration of Real Property -- Maintenance Buildings. Signed on 2001-09-29. Completion date: 2001-10-08.
$15,722 with Navy for Construction of Structures and Facilities -- Dining Facilities. Taking place in IL. Signed on 2005-03-29. Completion date: 2005-04-11.
LA TECH EQUIPMENT, INC (8188 HIGHLAND DR STE D2; small business) : $93,119 in 7 contractsfrom 2001 to 2006
Contracts for Laboratory Equipment and Supplies, Pressure, Temperature, and Humidity Measuring and Controlling Instruments, Compressors and Vacuum Pumps, Pipe, Tube and Rigid Tubing by Army Signed by year:2000: $0; 2001: $44,580; 2002: $2,960; 2003: $6,111; 2004: $16,538; 2005: $12,230; 2006: $10,700.
Biggest contracts:
$44,580 with Army for Laboratory Equipment and Supplies. Signed on 2001-04-24. Completion date: 2001-05-31.
$12,230 with Army for Pressure, Temperature, and Humidity Measuring and Controlling Instruments. Signed on 2005-06-16. Completion date: 2005-07-20.
$10,700 with Army for Compressors and Vacuum Pumps. Signed on 2006-03-08. Completion date: 2006-03-30.
$10,440 with Army for Pressure, Temperature, and Humidity Measuring and Controlling Instruments. Signed on 2004-01-21. Completion date: 2004-02-17.
ASHCROFT, ROBERT (1597 E PAULISTA WAY; small business) : $57,611 in 12 contractsfrom 2002 to 2005
Contracts for Other Education and Training Services, Education Services, Personnel Testing, Other Administrative Support Services by Army Signed by year:2000: $0; 2001: $0; 2002: $10,660; 2003: $44,834; 2004: $0; 2005: $2,117; 2006: $0.
Biggest contracts:
$25,704 with Army for Other Education and Training Services. Signed on 2003-10-30. Completion date: 2004-09-30.
$17,780 with Army for Education Services. Signed on 2003-01-23. Completion date: 2003-09-30.
$5,400 with Army for Personnel Testing. Signed on 2002-07-29. Completion date: 2002-09-30.
$5,330 with Army for Other Administrative Support Services. Signed on 2005-01-06. Completion date: 2005-09-30.
TECHNOLOGY SALES INC (1849 E MICHAEL WAY; small business)
$15,476 with Navy for Combination and Miscellaneous Instruments. Signed on 2005-09-08. Completion date: 2005-09-30.
PREMIERE INC (9009S 3605 E; small business)
$648 with Army for Recreational Services. Signed on 2002-04-02. Completion date: 2001-11-30.
Top industries in this zip code by the number of employees in 2005:
Health Care and Social Assistance: Residential Mental Retardation Facilities (100-249 employees: 1 establishment, 10-19 employees: 3 establishments, 5-9 employees: 1 establishment)
2002 - 2018 National Fire Incident Reporting System (NFIRS) incidents
According to the data from the years 2002 - 2018 the average number of fires per year is 27. The highest number of reported fire incidents - 47 took place in 2008, and the least - 12 in 2013. The data has a dropping trend.
When looking into fire subcategories, the most incidents belonged to: Structure Fires (47.8%), and Outside Fires (38.5%).
Fire incident types reported to NFIRS in Zip Code 84093
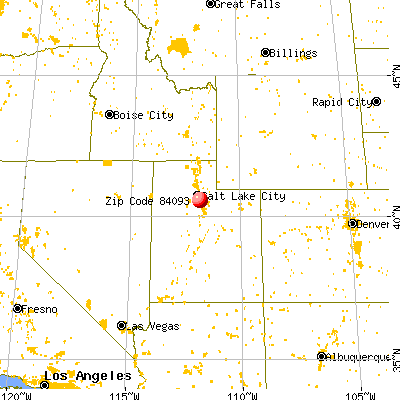


 Nearest zip codes: 84094, 84070, 84047, 84117, 84124, 84107.
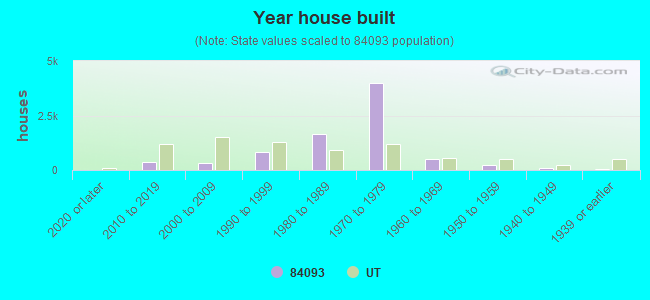


 According to the data from the years 2002 - 2018 the average number of fires per year is 27. The highest number of reported fire incidents - 47 took place in 2008, and the least - 12 in 2013. The data has a dropping trend.
 When looking into fire subcategories, the most incidents belonged to: Structure Fires (47.8%), and Outside Fires (38.5%).