Estimated zip code population in 2022: 28,797 Zip code population in 2010: 28,069 Zip code population in 2000: 28,234
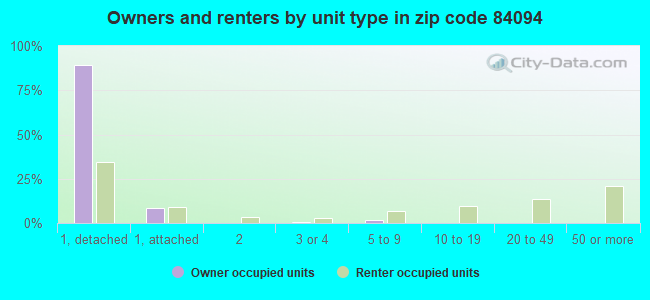
Houses and condos: 10,269 Renter-occupied apartments: 2,233
% of renters here:
22%
State:
29%
March 2022 cost of living index in zip code 84094: 94.0 (less than average, U.S. average is 100)
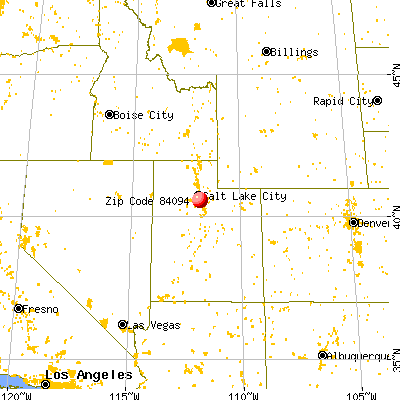
Land area: 5.1 sq. mi. Water area: 0.0 sq. mi.
Population density: 5,639 people per square mile
(average).
OSM Map
General Map
Google Map
MSN Map
OSM Map
General Map
Google Map
MSN Map
OSM Map
General Map
Google Map
MSN Map
OSM Map
General Map
Google Map
MSN Map
Please wait while loading the map...
Real estate property taxes paid for housing units in 2022:
This zip code:
0.5% ($2,607)
Utah:
0.5% ($2,376)
Median real estate property taxes paid for housing units with mortgages in 2022: $2,587 (0.5%) Median real estate property taxes paid for housing units with no mortgage in 2022: $2,654 (0.5%)
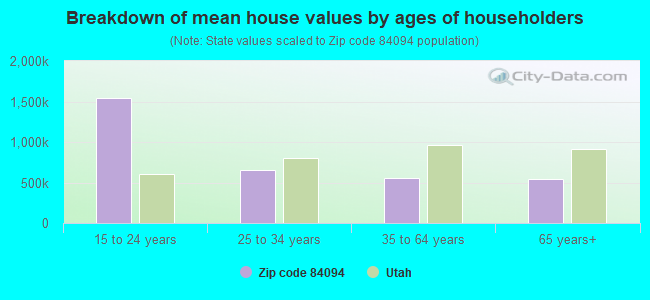
Estimated median house/condo value in 2022: $529,825
84094:
$529,825
Utah:
$499,500
According to our research of Utah and other state lists, there were 53 registered sex offenders living in 84094 zip code as of April 27, 2024. The ratio of all residents to sex offenders in zip code 84094 is 541 to 1. The ratio of registered sex offenders to all residents in this zip code is lower than the state average.
Median resident age:
This zip code:
36.7 years
Utah median age:
32.1 years
Average household size:
This zip code:
2.8 people
Utah:
3.0 people
Averages for the 2020 tax year for zip code 84094, filed in 2021:
Average Adjusted Gross Income (AGI) in 2020: $69,060 (Individual Income Tax Returns)
Here:
$69,060
State:
$81,660
Salary/wage: $62,796 (reported on 86.6% of returns)
Here:
$62,796
State:
$63,027
(% of AGI for various income ranges: 1254.1% for AGIs below $25k, 3932.9% for AGIs $25k-50k, 6986.9% for AGIs $50k-75k, 10695.2% for AGIs $75k-100k, 20945.0% for AGIs $100k-200k, 56154.0% for AGIs over 200k)
Taxable interest for individuals: $990 (reported on 29.9% of returns)
This zip code:
$990
Utah:
$2,255
(% of AGI for various income ranges: 15.8% for AGIs below $25k, 15.5% for AGIs $25k-50k, 25.1% for AGIs $50k-75k, 46.5% for AGIs $75k-100k, 74.1% for AGIs $100k-200k, 675.5% for AGIs over 200k)
Ordinary dividends: $2,234 (reported on 16.6% of returns)
Here:
$2,234
State:
$7,362
(% of AGI for various income ranges: 17.0% for AGIs below $25k, 21.7% for AGIs $25k-50k, 32.8% for AGIs $50k-75k, 56.2% for AGIs $75k-100k, 107.7% for AGIs $100k-200k, 766.5% for AGIs over 200k)
Net capital gain/loss in AGI: +$13,414 (reported on 16.3% of returns)
Here:
+$13,414
State:
+$43,433
(% of AGI for various income ranges: 5.3% for AGIs below $25k, 30.6% for AGIs $25k-50k, 74.5% for AGIs $50k-75k, 138.5% for AGIs $75k-100k, 462.5% for AGIs $100k-200k, 9950.0% for AGIs over 200k)
Profit/loss from business: +$8,865 (reported on 15.5% of returns)
Here:
+$8,865
State:
+$9,957
(% of AGI for various income ranges: 123.8% for AGIs below $25k, 133.0% for AGIs $25k-50k, 170.5% for AGIs $50k-75k, 287.6% for AGIs $75k-100k, 356.3% for AGIs $100k-200k, 914.5% for AGIs over 200k)
Taxable individual retirement arrangement distribution: $17,319 (reported on 7.2% of returns)
84094:
$17,319
Utah:
$21,167
(% of AGI for various income ranges: 52.3% for AGIs below $25k, 81.7% for AGIs $25k-50k, 148.7% for AGIs $50k-75k, 292.9% for AGIs $75k-100k, 432.8% for AGIs $100k-200k, 1278.5% for AGIs over 200k)
Total itemized deductions: $29,017 (reported on 13.0% of returns)
Here:
$29,017
State:
$41,056
(% of AGI for various income ranges: 33.1% for AGIs below $25k, 121.1% for AGIs $25k-50k, 409.5% for AGIs $50k-75k, 726.2% for AGIs $75k-100k, 1669.2% for AGIs $100k-200k, 5621.0% for AGIs over 200k)
Charity contributions: $12,199 (reported on 10.7% of returns)
Here:
$12,199
State:
$22,261
(% of AGI for various income ranges: 3.3% for AGIs below $25k, 17.9% for AGIs $25k-50k, 75.1% for AGIs $50k-75k, 185.2% for AGIs $75k-100k, 602.1% for AGIs $100k-200k, 3068.0% for AGIs over 200k)
Taxes paid: $7,513 (reported on 12.9% of returns)
84094:
$7,513
State:
$7,985
(% of AGI for various income ranges: 4.6% for AGIs below $25k, 25.6% for AGIs $25k-50k, 96.4% for AGIs $50k-75k, 190.3% for AGIs $75k-100k, 488.0% for AGIs $100k-200k, 1234.0% for AGIs over 200k)
Earned income credit: $1,852 (reported on 10.7% of returns)
Here:
$1,852
State:
$2,169
(% of AGI for various income ranges: 57.3% for AGIs below $25k, 47.7% for AGIs $25k-50k, 1.6% for AGIs $50k-75k)
Percentage of individuals using paid preparers for their 2020 taxes: 93.4%
Here:
93%
State:
94%
(% for various income ranges: 91.0% for AGIs below $25k, 94.6% for AGIs $25k-50k, 93.0% for AGIs $50k-75k, 94.9% for AGIs $75k-100k, 94.3% for AGIs $100k-200k, 94.4% for AGIs over 200k)
Averages for the 2012 tax year for zip code 84094, filed in 2013:
Average Adjusted Gross Income (AGI) in 2012: $54,293 (Individual Income Tax Returns)
Here:
$54,293
State:
$60,327
Salary/wage: $49,126 (reported on 89.5% of returns)
Here:
$49,126
State:
$48,762
(% of AGI for various income ranges: 80.1% for AGIs below $25k, 83.9% for AGIs $25k-50k, 84.9% for AGIs $50k-75k, 85.1% for AGIs $75k-100k, 82.8% for AGIs $100k-200k, 59.0% for AGIs over 200k)
Taxable interest for individuals: $642 (reported on 36.1% of returns)
This zip code:
$642
Utah:
$1,534
(% of AGI for various income ranges: 0.9% for AGIs below $25k, 0.3% for AGIs $25k-50k, 0.3% for AGIs $50k-75k, 0.4% for AGIs $75k-100k, 0.4% for AGIs $100k-200k, 0.7% for AGIs over 200k)
Ordinary dividends: $1,622 (reported on 15.2% of returns)
Here:
$1,622
State:
$5,711
(% of AGI for various income ranges: 0.8% for AGIs below $25k, 0.4% for AGIs $25k-50k, 0.3% for AGIs $50k-75k, 0.3% for AGIs $75k-100k, 0.5% for AGIs $100k-200k, 0.6% for AGIs over 200k)
Net capital gain/loss in AGI: +$7,093 (reported on 13.1% of returns)
Here:
+$7,093
State:
+$23,734
(% of AGI for various income ranges: 0.2% for AGIs $25k-50k, 0.3% for AGIs $50k-75k, 0.5% for AGIs $75k-100k, 1.0% for AGIs $100k-200k, 12.0% for AGIs over 200k)
Profit/loss from business: +$7,583 (reported on 15.0% of returns)
Here:
+$7,583
State:
+$8,845
(% of AGI for various income ranges: 6.2% for AGIs below $25k, 2.6% for AGIs $25k-50k, 1.4% for AGIs $50k-75k, 1.7% for AGIs $75k-100k, 1.8% for AGIs $100k-200k, 1.1% for AGIs over 200k)
Taxable individual retirement arrangement distribution: $11,747 (reported on 7.5% of returns)
84094:
$11,747
Utah:
$15,565
(% of AGI for various income ranges: 2.9% for AGIs below $25k, 1.4% for AGIs $25k-50k, 1.6% for AGIs $50k-75k, 1.5% for AGIs $75k-100k, 1.8% for AGIs $100k-200k, 0.9% for AGIs over 200k)
Total itemized deductions: $20,753 (23% of AGI, reported on 41.2% of returns)
Here:
$20,753
State:
$25,197
Here:
23.5% of AGI
State:
22.4% of AGI
(% of AGI for various income ranges: 9.3% for AGIs below $25k, 13.0% for AGIs $25k-50k, 18.0% for AGIs $50k-75k, 18.2% for AGIs $75k-100k, 17.0% for AGIs $100k-200k, 13.2% for AGIs over 200k)
Charity contributions: $5,559 (reported on 35.6% of returns)
Here:
$5,559
State:
$8,502
(% of AGI for various income ranges: 1.2% for AGIs below $25k, 2.1% for AGIs $25k-50k, 3.7% for AGIs $50k-75k, 4.5% for AGIs $75k-100k, 4.6% for AGIs $100k-200k, 3.7% for AGIs over 200k)
Taxes paid: $5,816 (reported on 41.2% of returns)
84094:
$5,816
State:
$7,001
(% of AGI for various income ranges: 1.5% for AGIs below $25k, 2.8% for AGIs $25k-50k, 4.3% for AGIs $50k-75k, 5.1% for AGIs $75k-100k, 5.6% for AGIs $100k-200k, 4.8% for AGIs over 200k)
Earned income credit: $2,031 (reported on 14.7% of returns)
Here:
$2,031
State:
$2,259
(% of AGI for various income ranges: 4.6% for AGIs below $25k, 1.2% for AGIs $25k-50k)
Percentage of individuals using paid preparers for their 2012 taxes: 46.6%
Here:
47%
State:
51%
(% for various income ranges: 43.2% for AGIs below $25k, 45.5% for AGIs $25k-50k, 47.8% for AGIs $50k-75k, 48.9% for AGIs $75k-100k, 51.3% for AGIs $100k-200k, 71.4% for AGIs over 200k)
Averages for the 2004 tax year for zip code 84094, filed in 2005:
Average Adjusted Gross Income (AGI) in 2004: $43,541 (Individual Income Tax Returns)
Here:
$43,541
State:
$45,498
Salary/wage: $41,213 (reported on 90.2% of returns)
Here:
$41,213
State:
$38,975
(% of AGI for various income ranges: 136.2% for AGIs below $10k, 81.4% for AGIs $10k-25k, 85.4% for AGIs $25k-50k, 88.1% for AGIs $50k-75k, 87.9% for AGIs $75k-100k, 79.3% for AGIs over 100k)
Taxable interest for individuals: $697 (reported on 48.8% of returns)
This zip code:
$697
Utah:
$1,445
(% of AGI for various income ranges: 2.8% for AGIs below $10k, 1.1% for AGIs $10k-25k, 0.8% for AGIs $25k-50k, 0.5% for AGIs $50k-75k, 0.5% for AGIs $75k-100k, 1.0% for AGIs over 100k)
Taxable dividends: $1,188 (reported on 17.7% of returns)
Here:
$1,188
State:
$3,152
(% of AGI for various income ranges: 1.9% for AGIs below $10k, 0.5% for AGIs $10k-25k, 0.4% for AGIs $25k-50k, 0.3% for AGIs $50k-75k, 0.4% for AGIs $75k-100k, 0.7% for AGIs over 100k)
Net capital gain/loss: +$3,813 (reported on 15.0% of returns)
Here:
+$3,813
State:
+$14,059
(% of AGI for various income ranges: 1.5% for AGIs below $10k, -0.4% for AGIs $10k-25k, 0.2% for AGIs $25k-50k, 0.3% for AGIs $50k-75k, 0.9% for AGIs $75k-100k, 4.1% for AGIs over 100k)
Profit/loss from business: +$5,698 (reported on 17.0% of returns)
Here:
+$5,698
State:
+$6,903
(% of AGI for various income ranges: 7.6% for AGIs below $10k, 5.5% for AGIs $10k-25k, 2.1% for AGIs $25k-50k, 1.9% for AGIs $50k-75k, 1.6% for AGIs $75k-100k, 1.7% for AGIs over 100k)
IRA payment deduction: $2,675 (reported on 2.6% of returns)
84094:
$2,675
Utah:
$2,970
(% of AGI for various income ranges: 0.1% for AGIs $10k-25k, 0.2% for AGIs $25k-50k, 0.1% for AGIs $50k-75k, 0.1% for AGIs $75k-100k, 0.1% for AGIs over 100k)
Self-employed pension: $11,217 (reported on 0.2% of returns)
Here:
$11,217
Utah:
$14,916
Total itemized deductions: $17,872 (26% of AGI, reported on 47.2% of returns)
Here:
$17,872
State:
$20,312
Here:
26.1% of AGI
State:
24.9% of AGI
(% of AGI for various income ranges: 12.1% for AGIs below $10k, 12.7% for AGIs $10k-25k, 19.4% for AGIs $25k-50k, 22.1% for AGIs $50k-75k, 21.0% for AGIs $75k-100k, 18.1% for AGIs over 100k)
Charity contributions deductions: $4,460 (6% of AGI, reported on 43.4% of returns)
Here:
$4,460
State:
$6,250
Here:
6.3% of AGI
State:
7.4% of AGI
(% of AGI for various income ranges: 0.9% for AGIs below $10k, 1.8% for AGIs $10k-25k, 3.6% for AGIs $25k-50k, 4.8% for AGIs $50k-75k, 5.3% for AGIs $75k-100k, 5.2% for AGIs over 100k)
Total tax: $4,944 (reported on 76.2% of returns)
84094:
$4,944
State:
$6,523
(% of AGI for various income ranges: 5.6% for AGIs below $10k, 4.4% for AGIs $10k-25k, 5.7% for AGIs $25k-50k, 6.9% for AGIs $50k-75k, 9.0% for AGIs $75k-100k, 14.3% for AGIs over 100k)
Earned income credit: $1,600 (reported on 11.0% of returns)
Here:
$1,600
State:
$1,703
Percentage of individuals using paid preparers for their 2004 taxes: 48.5%
Here:
49%
State:
53%
(% for various income ranges: 37.2% for AGIs below $10k, 47.7% for AGIs $10k-25k, 52.2% for AGIs $25k-50k, 51.6% for AGIs $50k-75k, 50.8% for AGIs $75k-100k, 55.5% for AGIs over 100k)
Likely homosexual households (counted as self-reported same-sex unmarried-partner households)
Lesbian couples: 0.2% of all households
Gay men: 0.3% of all households
Household received Food Stamps/SNAP in the past 12 months: 273 Household did not receive Food Stamps/SNAP in the past 12 months: 9,883
Women who had a birth in the past 12 months: 429 (419 now married, 15 unmarried) Women who did not have a birth in the past 12 months: 6,714 (3,404 now married, 3,306 unmarried)
Housing units in zip code 84094 with a mortgage: 5,633 (920 second mortgage, 12 home equity loan, 766 both second mortgage and home equity loan) Houses without a mortgage: 156
Median monthly owner costs for units with a mortgage: $1,850 Median monthly owner costs for units without a mortgage: $494
Residents with income below the poverty level in 2022:
This zip code:
5.3%
Whole state:
8.2%
Residents with income below 50% of the poverty level in 2022:
This zip code:
2.7%
Whole state:
4.3%
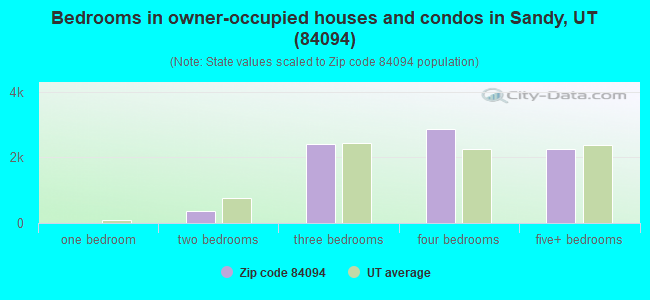
Median number of rooms in houses and condos:
Here:
7.7
State:
7.6
Median number of rooms in apartments:
Here:
4.7
State:
4.3
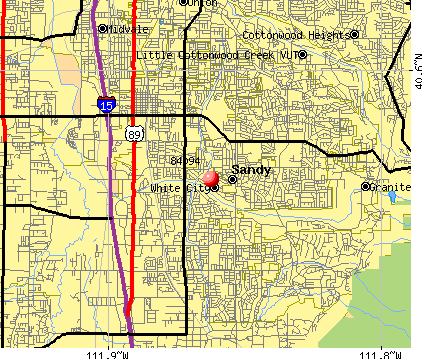
Notable locations in this zip code not listed on our city pages
Notable locations in zip code 84094: Country Square (A), Sandy City Fire Department Station 34 (B), Sandy City Fire Department Station 35 (C). Display/hide their locations on the map
Churches in zip code 84094 include: Alta Canyon Baptist Church (A), Hilltop United Methodist Church (B), The Church of Jesus Christ of Latter Day Saints (C). Display/hide their locations on the map
5,244 married couples with children.
1,110 single-parent households (419 men, 691 women).
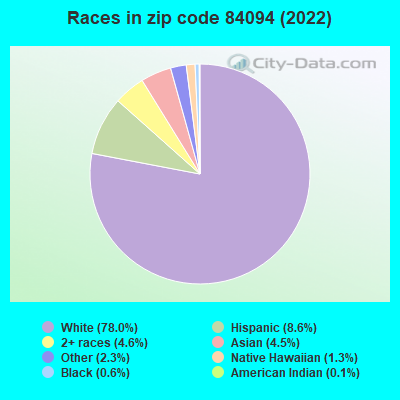
85.2% of residents of 84094 zip code speak English at home.
5.0% of residents speak Spanish at home (67% very well, 29% well, 2% not well, 1% not at all).
5.8% of residents speak other Indo-European language at home (79% very well, 11% well, 9% not well).
3.2% of residents speak Asian or Pacific Island language at home (55% very well, 15% well, 18% not well, 12% not at all).
0.7% of residents speak other language at home (88% very well, 12% well).
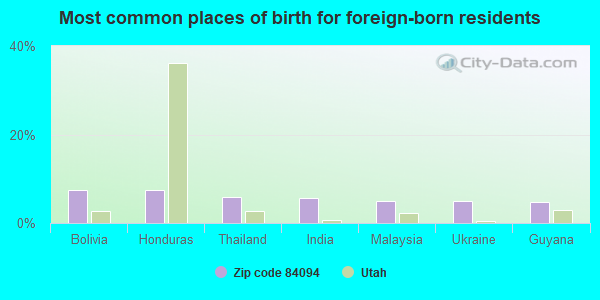
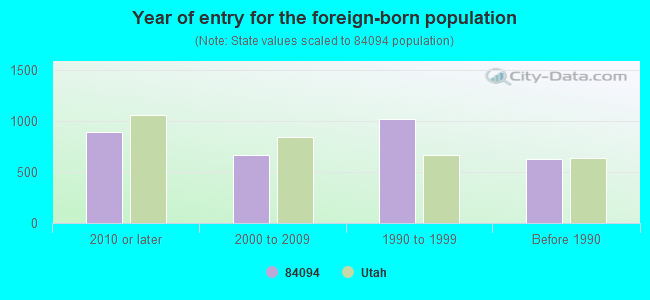
Foreign born population: 2,977 (10.3%) (61.0% of them are naturalized citizens)
Major facilities with environmental interests located in this zip code:
ALTA HIGH SCHOOL (11055 S 1000 E in SANDY, UT)
STATE MASTER (Utah compliance and permitting operations) - UST DATABASE-4, UNDERGROUND STORAGE TANK PROGRAM (National Center for Education Statistics) - STATE ID-14 702 Small Quantity Generators, between 100 kg and 1000 kg of hazardous waste/month (Resource Conservation and Recovery Act (tracking hazardous waste)) - notification Organizations: JORDAN SCHOOL DIST (CONTACT/OWNER)
, JORDAN SCHOOL DISTRICT (SCHOOL DISTRICT)
EDGEMONT ELEM SCH (1085 E 9800 S in SANDY, UT)
COMPLIANCE ACTIVITY (Tracking inspections of insecticide, fungicide, and rodenticide, and toxic substances) (National Center for Education Statistics) - STATE ID-14 124 Organizations: JORDAN SCHOOL DISTRICT (SCHOOL DISTRICT)
Alternative names: EDGEMONT ELEMENTARY SCHOOL
ALTA VIEW ELEMENTARY SCHOOL (10333 CROCUS STREET in SANDY, UT)
COMPLIANCE ACTIVITY (Tracking inspections of insecticide, fungicide, and rodenticide, and toxic substances) (National Center for Education Statistics) - STATE ID-14 104 Organizations: JORDAN SCHOOL DISTRICT (SCHOOL DISTRICT)
Alternative names: ALTA ELEMENTARY SCHOOL
ALTARA ELEMENTARY SCHOOL (800 E 11000 S in SANDY, UT)
STATE MASTER (Utah compliance and permitting operations) (National Center for Education Statistics) - STATE ID-14 103 Organizations: JORDAN SCHOOL DISTRICT (SCHOOL DISTRICT)
CANYON VIEW CLEANERS (717 E 9400 S in SANDY, UT)
STATE MASTER (Utah compliance and permitting operations) - SQG DATABASE-7, CESQG Conditionally Exempt Small Quantity Generators, less than 100 kg/month of hazardous waste (Resource Conservation and Recovery Act (tracking hazardous waste)) - notification Organizations: KEN WADE (CONTACT/OWNER)
EASTMONT MIDDLE SCHOOL (10100 S 1300 E in SANDY, UT)
(Geographic Names Information System) (National Center for Education Statistics) - STATE ID-14 403 Organizations: JORDAN SCHOOL DISTRICT (SCHOOL DISTRICT)
MISTER DRYCLEANER (8528 SOUTH 1300 EAST in SANDY, UT)
STATE MASTER (Utah compliance and permitting operations) - SQG DATABASE-7, CESQG Conditionally Exempt Small Quantity Generators, less than 100 kg/month of hazardous waste (Resource Conservation and Recovery Act (tracking hazardous waste)) - notification Organizations: HELEN DOHERTY (CONTACT/OWNER)
Alternative names: MR DRY CLEANERS, MR. DRYCLEANERS INC.
BELL VIEW ELEM SCH (9800 S 800 E in SANDY, UT)
(National Center for Education Statistics) - STATE ID-14 105 Organizations: JORDAN SCHOOL DISTRICT (SCHOOL DISTRICT)
EAST SANDY ELEM SCH (8295 S 870 E in SANDY, UT)
(National Center for Education Statistics) - STATE ID-14 123 Organizations: JORDAN SCHOOL DISTRICT (SCHOOL DISTRICT)
INDIAN HILLS MIDDLE (1180 E SANDERS RD in SANDY, UT)
(National Center for Education Statistics) - STATE ID-14 405 Organizations: JORDAN SCHOOL DISTRICT (SCHOOL DISTRICT)
DUMP OF ANTIFREEZE INTO GUTTER (967 E PLATINUM WAY in SANDY, UT)
National Pollutant Discharge Elimination System NON-MAJOR (Tracking pollutant discharge elimination systems) - permit Business SIC classification: NONCLASSIFIABLE ESTABLISHMENTS
LONE PEAK VILLAGE (11400 SOUTH 1000 EAST in SANDY, UT)
National Pollutant Discharge Elimination System NON-MAJOR (Tracking pollutant discharge elimination systems) - permit Business SIC classification: GENERAL CONTRACTORS-SINGLE-FAMILY HOUSES
8334 COLLEEN DRIVE (8334 COLLEEN DRIVE in SANDY, UT)
ENFORCEMENT/COMPLIANCE ACTIVITY (Integrated Compliance Information System)
Housing units lacking complete plumbing facilities: 0.9% Housing units lacking complete kitchen facilities: 1.0%
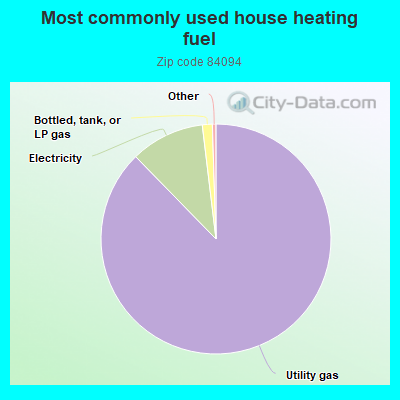
87.8%Utility gas
10.4%Electricity
1.4%Bottled, tank, or LP gas
Population in 1990: 26,375. Population change in the 1990s: +1,859 (+7.0%).
Place of birth for U.S.-born residents:
This state: 17,734
Northeast: 1,099
Midwest: 1,204
South: 1,130
West: 4,433
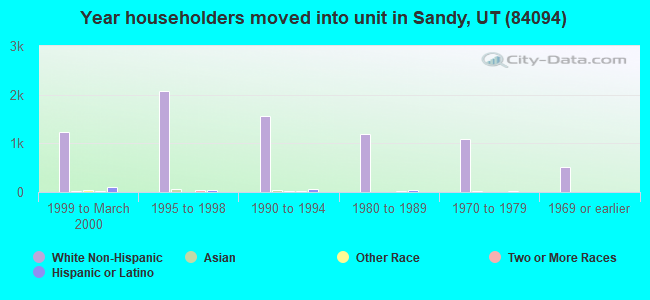
60% of the 84094 zip code residents lived in the same house 5 years ago. Out of people who lived in different houses, 68% lived in this county. Out of people who lived in different counties, 50% lived in Utah.
91% of the 84094 zip code residents lived in the same house 1 year ago. Out of people who lived in different houses, 72% moved from this county. Out of people who lived in different houses, 12% moved from different county within same state. Out of people who lived in different houses, 12% moved from different state. Out of people who lived in different houses, 5% moved from abroad.
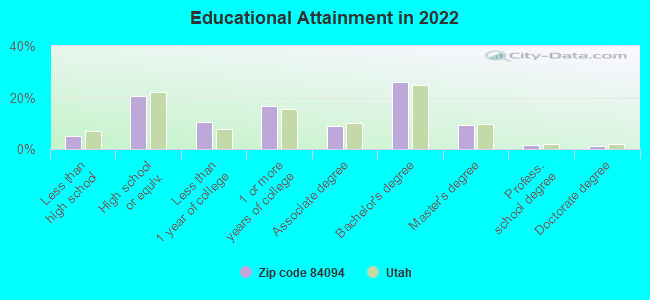
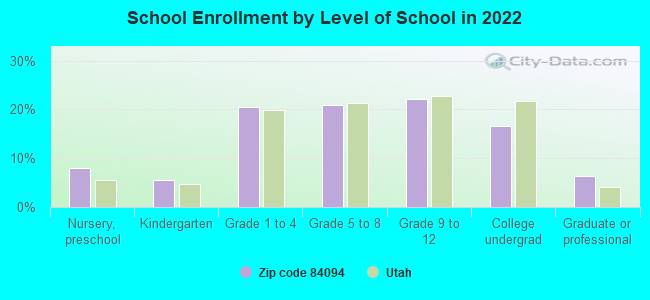
Private vs. public school enrollment:
Students in private schools in grades 1 to 8 (elementary and middle school): 207
Here:
7.8%
Utah:
7.2%
Students in private schools in grades 9 to 12 (high school): 59
Here:
4.2%
Utah:
5.3%
Students in private undergraduate colleges: 181
Here:
16.8%
Utah:
26.7%
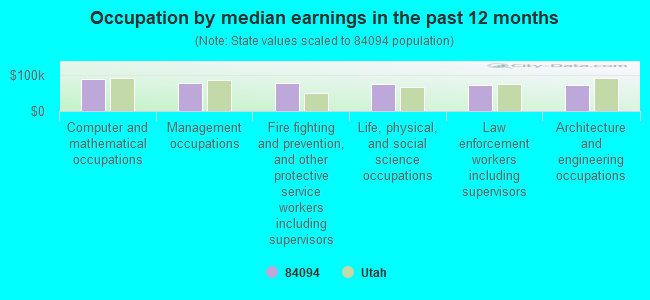
Occupation by median earnings in the past 12 months ($)
90,920Computer and mathematical occupations
77,966Management occupations
77,958Fire fighting and prevention, and other protective service workers including supervisors
74,879Life, physical, and social science occupations
73,624Law enforcement workers including supervisors
72,223Architecture and engineering occupations
Companies with federal contracts located in this zip code (SANDY, UT):
H E CRAMER COMPANY, INC (8249 SHANGRILA CIRCLE; small business) : $3,914,386 in 81 contractsfrom 2000 to 2006
Contracts for Other Research and Development -- Basic Research (R&D), Miscellaneous Defense Hard Goods -- Advanced Development (R&D) by Army Signed by year:2000: $253,566; 2001: $133,854; 2002: $351,028; 2003: $1,041,895; 2004: $1,089,236; 2005: $854,514; 2006: $190,293.
Biggest contracts:
$295,458 with Army for Other Research and Development -- Basic Research (R&D). Signed on 2005-02-24. Completion date: 2005-05-31.
$205,478, same as above.Signed on 2005-05-18. Completion date: 2006-02-28.
$204,998, same as above.Signed on 2004-12-08. Completion date: 2005-11-30.
$200,000, same as above.Signed on 2004-08-01. Completion date: 2005-05-31.
PEAK SOFTWARE SYSTEMS INC (870 E 9400 S STE 201; small business) : $422,745 in 24 contractsfrom 2001 to 2006
Contracts for Programming Services by Army Signed by year:2000: $0; 2001: $66,574; 2002: $14,280; 2003: $118,155; 2004: $124,125; 2005: $69,911; 2006: $29,700.
Biggest contracts:
$63,475 with Army for Programming Services. Signed on 2004-01-14. Completion date: 2004-09-30.
$52,375, same as above.Signed on 2001-10-17. Completion date: 2002-09-30.
$45,000, same as above.Signed on 2005-08-11. Completion date: 2006-12-31.
$38,000, same as above.Signed on 2003-07-10. Completion date: 2004-09-30.
KELLIE SUPPLY COMPANY (8031 S 865 E; small business) : $164,068 in 15 contractsfrom 2004 to 2006
Contracts for Miscellaneous Items, Valves, Nonpowered, Pipe, Tube and Rigid Tubing, Miscellaneous Vehicular Components by Defense Logistics Agency Signed by year:2000: $0; 2001: $0; 2002: $0; 2003: $0; 2004: $132,567; 2005: $14,705; 2006: $16,796.
Biggest contracts:
$36,960 with Defense Logistics Agency for Miscellaneous Items. Taking place in MI. Signed on 2004-12-19. Completion date: 2005-06-17.
$23,344 with Defense Logistics Agency for Valves, Nonpowered. Signed on 2004-10-29. Completion date: 2005-01-30.
$13,709, same as above.Signed on 2004-12-22. Completion date: 2005-03-25.
$13,200, same as above.Signed on 2006-01-20. Completion date: 2006-07-22.
LIN CHEN (1242 SANDERS HILL CIR; small business) : $55,890 in 10 contractsfrom 2003 to 2005
Contracts for Other Education and Training Services by Navy Signed by year:2000: $0; 2001: $0; 2002: $0; 2003: $0; 2004: $43,740; 2005: $12,150; 2006: $0.
Biggest contracts:
$16,200 with Navy for Other Education and Training Services. Signed on 2004-11-26. Completion date: 2005-09-30.
$11,340, same as above.Signed on 2004-05-21. Completion date: 2004-09-30.
$4,050 with Navy for Other Education and Training Services. Taking place in TX. Signed on 2005-06-02. Completion date: 2005-06-23.
$4,050, same as above.Signed on 2004-06-10. Completion date: 2004-07-29.
PEOPLESMART SOLUTIONS (11357 S HAWKWOOD DR; small business) : $52,993 in 2 contractsfrom 2005 to 2006
$37,275 with Air Force for Miscellaneous Items. Signed on 2005-01-10. Completion date: 2005-01-18.
$15,718 with Air Force for Communication Training Devices. Signed on 2006-04-24. Completion date: 2006-04-28.
PRECISION TESTING TECHNOLOGIES (11149 SANDY GULCH ROAD; small business) : $23,900 in 2 contractsfrom 2001 to 2004
$16,020 with Army for Facilities Operations Support Services. Signed on 2004-10-21. Completion date: 2004-12-15.
$7,880 with Army for Other Housekeeping Services. Signed on 2001-10-03. Completion date: 2001-10-31.
ACM SUPPLY (8031 S 865 E; small business)
$15,675 with Defense Logistics Agency for Hose and Flexible Tubing. Taking place in NJ. Signed on 2004-11-03. Completion date: 2005-02-06.
CRANDALL, LAWRENCE, (12125 S CRESTRIDGE CR; small business)
$3,694 with Army for Other Social Services. Signed on 2003-03-20. Completion date: 2003-04-30.
Top industries in this zip code by the number of employees in 2005:
Health Care and Social Assistance: General Medical and Surgical Hospitals (500-999 employees: 1 establishment)
Health Care and Social Assistance: Offices of Physicians (except Mental Health Specialists) (50-99: 1, 20-49: 1, 10-19: 14, 5-9: 14, 1-4: 17)
Health Care and Social Assistance: Specialty (except Psychiatric and Substance Abuse) Hospitals (250-499: 1)
Arts, Entertainment, and Recreation: Fitness and Recreational Sports Centers (100-249: 1, 50-99: 1, 10-19: 2, 1-4: 2)
2002 - 2018 National Fire Incident Reporting System (NFIRS) incidents
Based on the data from the years 2002 - 2018 the average number of fire incidents per year is 32. The highest number of reported fires - 51 took place in 2002, and the least - 14 in 2013. The data has a decreasing trend.
When looking into fire subcategories, the most incidents belonged to: Structure Fires (43.0%), and Outside Fires (34.9%).
Fire incident types reported to NFIRS in Zip Code 84094


 Nearest zip codes: 84070, 84093, 84047, 84020, 84107, 84117.


 Based on the data from the years 2002 - 2018 the average number of fire incidents per year is 32. The highest number of reported fires - 51 took place in 2002, and the least - 14 in 2013. The data has a decreasing trend.
 When looking into fire subcategories, the most incidents belonged to: Structure Fires (43.0%), and Outside Fires (34.9%).