Estimated zip code population in 2022: 5,454 Zip code population in 2010: 3,918 Zip code population in 2000: 2,715
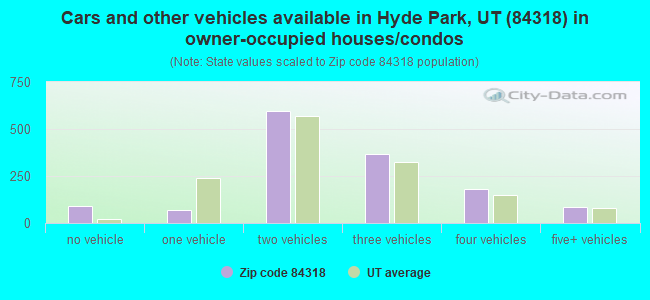
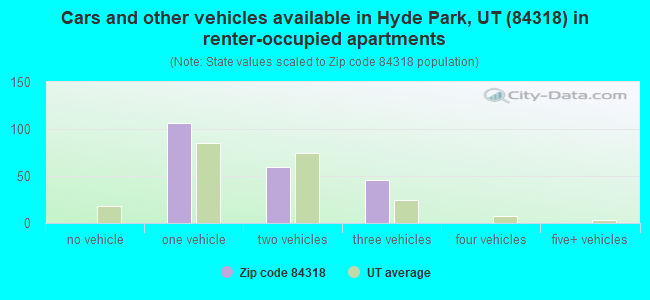
Houses and condos: 1,616 Renter-occupied apartments: 209
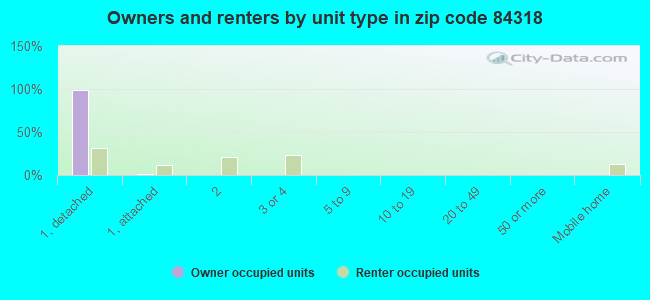
% of renters here:
13%
State:
29%
March 2022 cost of living index in zip code 84318: 90.8 (less than average, U.S. average is 100)
Land area: 4.6 sq. mi. Water area: 0.0 sq. mi.
Population density: 1,198 people per square mile
(low).
OSM Map
General Map
Google Map
MSN Map
OSM Map
General Map
Google Map
MSN Map
OSM Map
General Map
Google Map
MSN Map
OSM Map
General Map
Google Map
MSN Map
Please wait while loading the map...
Real estate property taxes paid for housing units in 2022:
This zip code:
0.5% ($2,313)
Utah:
0.5% ($2,376)
Median real estate property taxes paid for housing units with mortgages in 2022: $2,366 (0.4%) Median real estate property taxes paid for housing units with no mortgage in 2022: $2,233 (0.5%)
Business Search- 14 Million verified businesses
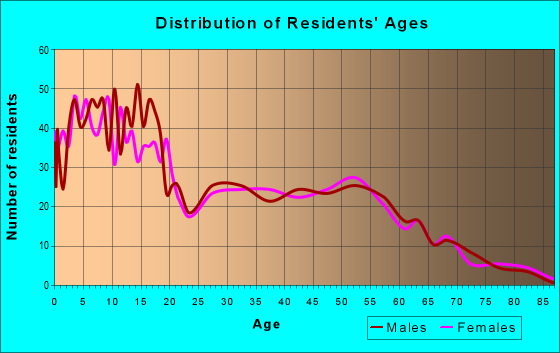
Males: 2,699
(49.5%)
Females: 2,755
(50.5%)
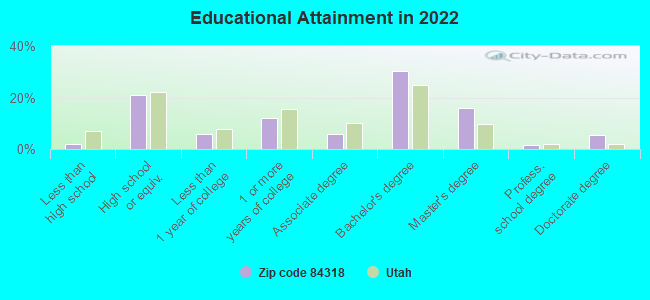
For population 25 years and over in 84318:
High school or higher: 99.2%
Bachelor's degree or higher: 53.8%
Graduate or professional degree: 23.1%
Unemployed: 2.7%
Mean travel time to work (commute): 16.4 minutes
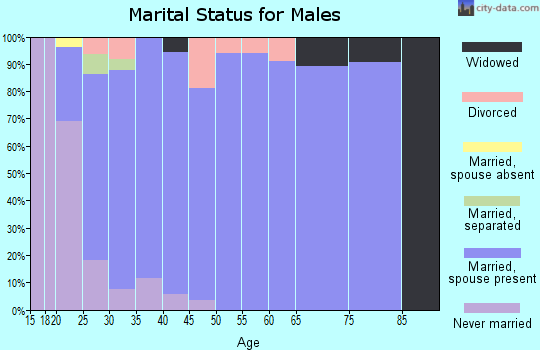
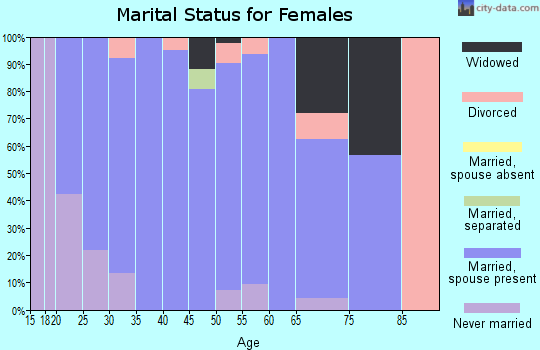
For population 15 years and over in 84318:
Never married: 25.5%
Now married: 66.9%
Separated: 0.6%
Widowed: 4.3%
Divorced: 2.7%
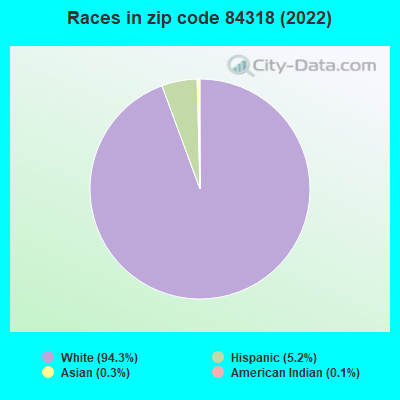
Zip code 84318 compared to state average:
Black race population percentage significantly below state average.
Hispanic race population percentage below state average.
Foreign-born population percentage significantly below state average.
Renting percentage below state average.
Length of stay since moving in significantly above state average.
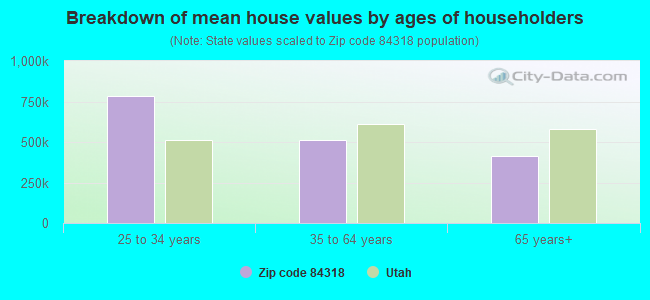
Estimated median house/condo value in 2022: $507,326
84318:
$507,326
Utah:
$499,500
According to our research of Utah and other state lists, there were 5 registered sex offenders living in 84318 zip code as of April 28, 2024. The ratio of all residents to sex offenders in zip code 84318 is 880 to 1. The ratio of registered sex offenders to all residents in this zip code is lower than the state average.
Median resident age:
This zip code:
29.3 years
Utah median age:
32.1 years
Average household size:
This zip code:
3.4 people
Utah:
3.0 people
Averages for the 2020 tax year for zip code 84318, filed in 2021:
Average Adjusted Gross Income (AGI) in 2020: $89,728 (Individual Income Tax Returns)
Here:
$89,728
State:
$81,660
Salary/wage: $65,923 (reported on 85.6% of returns)
Here:
$65,923
State:
$63,027
(% of AGI for various income ranges: 1252.8% for AGIs below $25k, 3630.7% for AGIs $25k-50k, 6802.5% for AGIs $50k-75k, 9813.3% for AGIs $75k-100k, 18759.6% for AGIs $100k-200k, 52354.0% for AGIs over 200k)
Taxable interest for individuals: $1,250 (reported on 38.4% of returns)
This zip code:
$1,250
Utah:
$2,255
(% of AGI for various income ranges: 20.2% for AGIs below $25k, 22.4% for AGIs $25k-50k, 26.0% for AGIs $50k-75k, 55.2% for AGIs $75k-100k, 155.4% for AGIs $100k-200k, 678.0% for AGIs over 200k)
Ordinary dividends: $3,085 (reported on 21.0% of returns)
Here:
$3,085
State:
$7,362
(% of AGI for various income ranges: 16.7% for AGIs below $25k, 40.7% for AGIs $25k-50k, 61.0% for AGIs $50k-75k, 41.4% for AGIs $75k-100k, 162.5% for AGIs $100k-200k, 1244.0% for AGIs over 200k)
Net capital gain/loss in AGI: +$21,921 (reported on 21.0% of returns)
Here:
+$21,921
State:
+$43,433
(% of AGI for various income ranges: 10.7% for AGIs below $25k, 32.4% for AGIs $25k-50k, 191.0% for AGIs $50k-75k, 133.3% for AGIs $75k-100k, 617.5% for AGIs $100k-200k, 15976.0% for AGIs over 200k)
Profit/loss from business: +$10,224 (reported on 16.2% of returns)
Here:
+$10,224
State:
+$9,957
(% of AGI for various income ranges: 54.1% for AGIs below $25k, 206.2% for AGIs $25k-50k, 273.5% for AGIs $50k-75k, 87.6% for AGIs $75k-100k, 602.1% for AGIs $100k-200k, 1038.0% for AGIs over 200k)
Taxable individual retirement arrangement distribution: $24,005 (reported on 9.2% of returns)
84318:
$24,005
Utah:
$21,167
(% of AGI for various income ranges: 39.3% for AGIs below $25k, 76.2% for AGIs $25k-50k, 286.5% for AGIs $50k-75k, 395.2% for AGIs $75k-100k, 1155.7% for AGIs $100k-200k)
Total itemized deductions: $41,100 (reported on 19.7% of returns)
Here:
$41,100
State:
$41,056
(% of AGI for various income ranges: 778.5% for AGIs $50k-75k, 709.5% for AGIs $75k-100k, 2677.1% for AGIs $100k-200k, 15904.0% for AGIs over 200k)
Charity contributions: $23,974 (reported on 18.8% of returns)
Here:
$23,974
State:
$22,261
(% of AGI for various income ranges: 247.0% for AGIs $50k-75k, 253.3% for AGIs $75k-100k, 1246.8% for AGIs $100k-200k, 11584.0% for AGIs over 200k)
Taxes paid: $8,131 (reported on 19.7% of returns)
84318:
$8,131
State:
$7,985
(% of AGI for various income ranges: 140.0% for AGIs $50k-75k, 166.7% for AGIs $75k-100k, 712.5% for AGIs $100k-200k, 2068.0% for AGIs over 200k)
Earned income credit: $2,289 (reported on 7.9% of returns)
Here:
$2,289
State:
$2,169
(% of AGI for various income ranges: 39.3% for AGIs below $25k, 79.7% for AGIs $25k-50k)
Percentage of individuals using paid preparers for their 2020 taxes: 94.8%
Here:
95%
State:
94%
(% for various income ranges: 93.8% for AGIs below $25k, 94.7% for AGIs $25k-50k, 93.3% for AGIs $50k-75k, 96.8% for AGIs $75k-100k, 94.2% for AGIs $100k-200k, 100.0% for AGIs over 200k)
Averages for the 2012 tax year for zip code 84318, filed in 2013:
Average Adjusted Gross Income (AGI) in 2012: $63,178 (Individual Income Tax Returns)
Here:
$63,178
State:
$60,327
Salary/wage: $49,469 (reported on 88.8% of returns)
Here:
$49,469
State:
$48,762
(% of AGI for various income ranges: 80.4% for AGIs below $25k, 76.2% for AGIs $25k-50k, 81.6% for AGIs $50k-75k, 75.9% for AGIs $75k-100k, 76.7% for AGIs $100k-200k, 37.7% for AGIs over 200k)
Taxable interest for individuals: $730 (reported on 46.7% of returns)
This zip code:
$730
Utah:
$1,534
(% of AGI for various income ranges: 0.5% for AGIs below $25k, 0.7% for AGIs $25k-50k, 0.4% for AGIs $50k-75k, 0.5% for AGIs $75k-100k, 0.8% for AGIs $100k-200k, 0.2% for AGIs over 200k)
Ordinary dividends: $3,260 (reported on 17.8% of returns)
Here:
$3,260
State:
$5,711
(% of AGI for various income ranges: 0.5% for AGIs below $25k, 0.3% for AGIs $25k-50k, 0.6% for AGIs $50k-75k, 0.4% for AGIs $75k-100k, 1.5% for AGIs $100k-200k, 1.5% for AGIs over 200k)
Net capital gain/loss in AGI: +$7,048 (reported on 14.8% of returns)
Here:
+$7,048
State:
+$23,734
(% of AGI for various income ranges: 0.7% for AGIs below $25k, 0.2% for AGIs $50k-75k, 0.4% for AGIs $75k-100k, 1.8% for AGIs $100k-200k, 5.1% for AGIs over 200k)
Profit/loss from business: +$4,959 (reported on 18.9% of returns)
Here:
+$4,959
State:
+$8,845
(% of AGI for various income ranges: 7.0% for AGIs below $25k, 3.7% for AGIs $25k-50k, 1.5% for AGIs $50k-75k, 1.6% for AGIs $75k-100k, 0.4% for AGIs $100k-200k)
Taxable individual retirement arrangement distribution: $14,553 (reported on 8.9% of returns)
84318:
$14,553
Utah:
$15,565
(% of AGI for various income ranges: 1.8% for AGIs below $25k, 3.0% for AGIs $25k-50k, 1.5% for AGIs $50k-75k, 3.5% for AGIs $75k-100k, 2.6% for AGIs $100k-200k)
Total itemized deductions: $23,452 (23% of AGI, reported on 47.9% of returns)
Here:
$23,452
State:
$25,197
Here:
23.1% of AGI
State:
22.4% of AGI
(% of AGI for various income ranges: 10.4% for AGIs below $25k, 15.9% for AGIs $25k-50k, 19.8% for AGIs $50k-75k, 21.4% for AGIs $75k-100k, 20.6% for AGIs $100k-200k, 12.3% for AGIs over 200k)
Charity contributions: $9,513 (reported on 45.0% of returns)
Here:
$9,513
State:
$8,502
(% of AGI for various income ranges: 1.6% for AGIs below $25k, 4.6% for AGIs $25k-50k, 7.3% for AGIs $50k-75k, 8.2% for AGIs $75k-100k, 8.2% for AGIs $100k-200k, 5.8% for AGIs over 200k)
Taxes paid: $5,799 (reported on 47.9% of returns)
84318:
$5,799
State:
$7,001
(% of AGI for various income ranges: 1.2% for AGIs below $25k, 2.6% for AGIs $25k-50k, 3.9% for AGIs $50k-75k, 5.1% for AGIs $75k-100k, 5.7% for AGIs $100k-200k, 4.4% for AGIs over 200k)
Earned income credit: $2,218 (reported on 13.0% of returns)
Here:
$2,218
State:
$2,259
(% of AGI for various income ranges: 4.8% for AGIs below $25k, 1.7% for AGIs $25k-50k)
Percentage of individuals using paid preparers for their 2012 taxes: 52.7%
Here:
53%
State:
51%
(% for various income ranges: 42.9% for AGIs below $25k, 57.6% for AGIs $25k-50k, 56.7% for AGIs $50k-75k, 52.2% for AGIs $75k-100k, 59.1% for AGIs $100k-200k, 80.0% for AGIs over 200k)
Averages for the 2004 tax year for zip code 84318, filed in 2005:
Average Adjusted Gross Income (AGI) in 2004: $45,457 (Individual Income Tax Returns)
Here:
$45,457
State:
$45,498
Salary/wage: $39,561 (reported on 90.4% of returns)
Here:
$39,561
State:
$38,975
(% of AGI for various income ranges: 109.1% for AGIs below $10k, 79.8% for AGIs $10k-25k, 83.7% for AGIs $25k-50k, 86.5% for AGIs $50k-75k, 83.7% for AGIs $75k-100k, 63.8% for AGIs over 100k)
Taxable interest for individuals: $884 (reported on 52.5% of returns)
This zip code:
$884
Utah:
$1,445
(% of AGI for various income ranges: 1.7% for AGIs below $10k, 1.5% for AGIs $10k-25k, 0.7% for AGIs $25k-50k, 1.2% for AGIs $50k-75k, 0.5% for AGIs $75k-100k, 1.2% for AGIs over 100k)
Taxable dividends: $1,435 (reported on 20.9% of returns)
Here:
$1,435
State:
$3,152
(% of AGI for various income ranges: 2.0% for AGIs below $10k, 0.3% for AGIs $10k-25k, 0.6% for AGIs $25k-50k, 0.1% for AGIs $50k-75k, 0.5% for AGIs $75k-100k, 1.2% for AGIs over 100k)
Net capital gain/loss: +$4,790 (reported on 17.4% of returns)
Here:
+$4,790
State:
+$14,059
(% of AGI for various income ranges: -0.7% for AGIs below $10k, 0.4% for AGIs $10k-25k, -0.1% for AGIs $25k-50k, 0.3% for AGIs $50k-75k, 0.5% for AGIs $75k-100k, 5.5% for AGIs over 100k)
Profit/loss from business: +$2,927 (reported on 16.5% of returns)
Here:
+$2,927
State:
+$6,903
(% of AGI for various income ranges: 1.7% for AGIs below $10k, 6.9% for AGIs $10k-25k, 2.3% for AGIs $25k-50k, -0.3% for AGIs $50k-75k, 0.2% for AGIs $75k-100k, 0.7% for AGIs over 100k)
IRA payment deduction: $3,926 (reported on 2.0% of returns)
84318:
$3,926
Utah:
$2,970
Total itemized deductions: $19,444 (27% of AGI, reported on 49.0% of returns)
Here:
$19,444
State:
$20,312
Here:
26.6% of AGI
State:
24.9% of AGI
(% of AGI for various income ranges: 9.5% for AGIs below $10k, 15.2% for AGIs $10k-25k, 19.6% for AGIs $25k-50k, 23.5% for AGIs $50k-75k, 22.1% for AGIs $75k-100k, 21.1% for AGIs over 100k)
Charity contributions deductions: $7,802 (10% of AGI, reported on 46.4% of returns)
Here:
$7,802
State:
$6,250
Here:
10.5% of AGI
State:
7.4% of AGI
(% of AGI for various income ranges: 0.9% for AGIs below $10k, 4.1% for AGIs $10k-25k, 5.9% for AGIs $25k-50k, 8.0% for AGIs $50k-75k, 9.0% for AGIs $75k-100k, 9.8% for AGIs over 100k)
Total tax: $4,953 (reported on 71.9% of returns)
84318:
$4,953
State:
$6,523
(% of AGI for various income ranges: 2.9% for AGIs below $10k, 4.3% for AGIs $10k-25k, 4.1% for AGIs $25k-50k, 5.2% for AGIs $50k-75k, 7.7% for AGIs $75k-100k, 13.3% for AGIs over 100k)
Earned income credit: $1,642 (reported on 9.3% of returns)
Here:
$1,642
State:
$1,703
Percentage of individuals using paid preparers for their 2004 taxes: 51.3%
Here:
51%
State:
53%
(% for various income ranges: 42.2% for AGIs below $10k, 47.1% for AGIs $10k-25k, 56.8% for AGIs $25k-50k, 53.8% for AGIs $50k-75k, 47.4% for AGIs $75k-100k, 70.7% for AGIs over 100k)
Likely homosexual households (counted as self-reported same-sex unmarried-partner households)
Lesbian couples: 0.6% of all households
Gay men: 0.0% of all households
Household received Food Stamps/SNAP in the past 12 months: 17 Household did not receive Food Stamps/SNAP in the past 12 months: 1,580
Women who had a birth in the past 12 months: 87 (88 now married, 0 unmarried) Women who did not have a birth in the past 12 months: 1,140 (682 now married, 454 unmarried)
Housing units in zip code 84318 with a mortgage: 795 (51 second mortgage, 48 both second mortgage and home equity loan) Median monthly owner costs for units with a mortgage: $1,937 Median monthly owner costs for units without a mortgage: $469
Residents with income below the poverty level in 2022:
This zip code:
7.1%
Whole state:
8.2%
Residents with income below 50% of the poverty level in 2022:
This zip code:
1.8%
Whole state:
4.3%
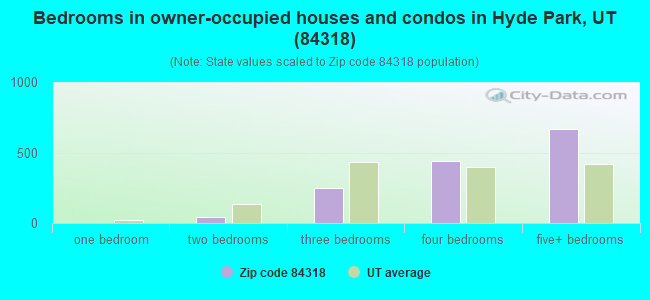
Median number of rooms in houses and condos:
Here:
10.0
State:
7.6
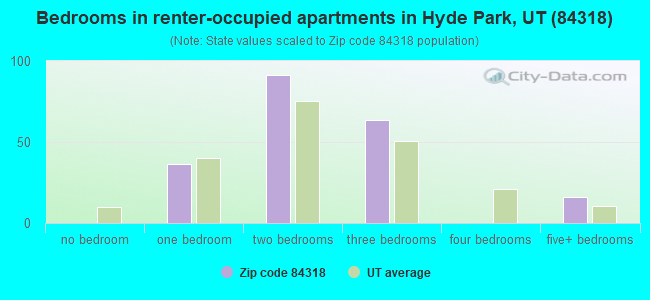
Median number of rooms in apartments:
Here:
4.3
State:
4.3
Notable locations in this zip code not listed on our city pages
In group quarters: 6 (-1 institutionalized population)
Size of family households: 503 2-persons, 162 3-persons, 177 4-persons, 181 5-persons, 161 6-persons, 132 7-or-more-persons
Size of nonfamily households: 205 1-person, 58 2-persons
1,656 married couples with children.
83 single-parent households (23 men, 60 women).
93.2% of residents of 84318 zip code speak English at home.
4.7% of residents speak Spanish at home (69% very well, 23% well, 8% not well).
1.3% of residents speak other Indo-European language at home (94% very well, 6% well).
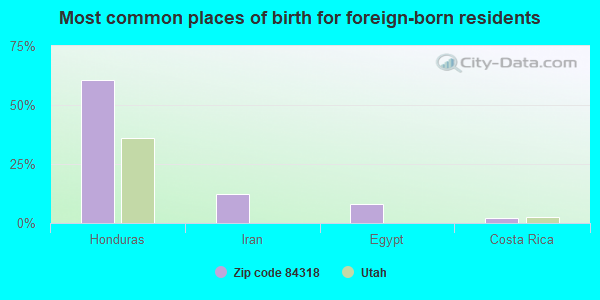
Foreign born population: 171 (3.1%) (51.9% of them are naturalized citizens)
This zip code:
3.1%
Whole state:
8.6%
60%Honduras
12%Iran
8%Egypt
2%Costa Rica
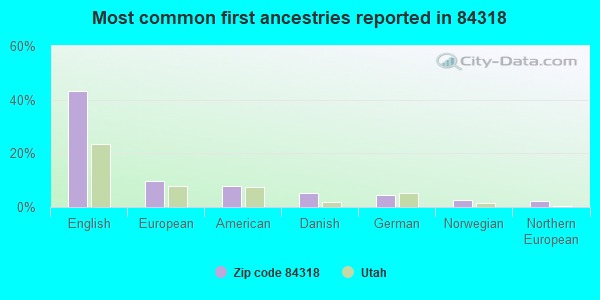
43%English
10%European
8%American
5%Danish
4%German
3%Norwegian
2%Northern European
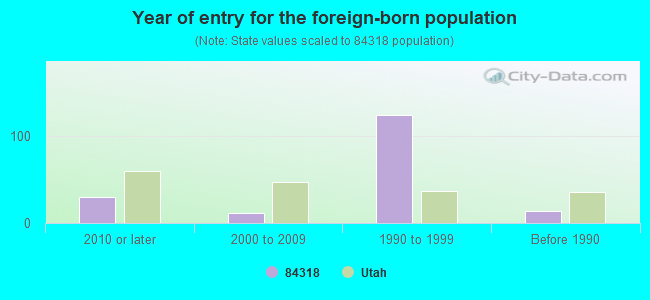
Year of entry for the foreign-born population
302010 or later
122000 to 2009
1241990 to 1999
14Before 1990
Facilities with environmental interests located in this zip code:
CEDAR RIDGE MIDDLE (65 N 200 W in HYDE PARK, UT)
(National Center for Education Statistics) - STATE ID-04 310 Organizations: CACHE SCHOOL DISTRICT (SCHOOL DISTRICT)
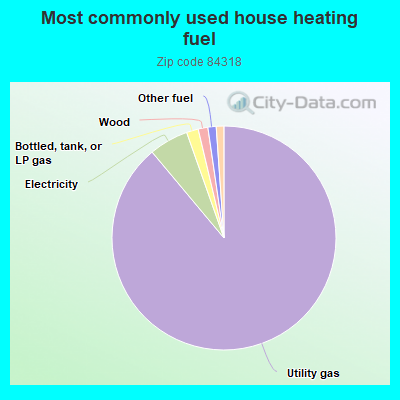
89.0%Utility gas
5.7%Electricity
1.7%Bottled, tank, or LP gas
1.4%Wood
1.2%Other fuel
0.6%Coal or coke
0.5%Solar energy
Place of birth for U.S.-born residents:
This state: 3,268
Northeast: 162
Midwest: 264
South: 119
West: 1,458
66% of the 84318 zip code residents lived in the same house 5 years ago. Out of people who lived in different houses, 62% lived in this county. Out of people who lived in different counties, 50% lived in Utah.
89% of the 84318 zip code residents lived in the same house 1 year ago. Out of people who lived in different houses, 65% moved from this county. Out of people who lived in different houses, 2% moved from different county within same state. Out of people who lived in different houses, 25% moved from different state. Out of people who lived in different houses, 6% moved from abroad.
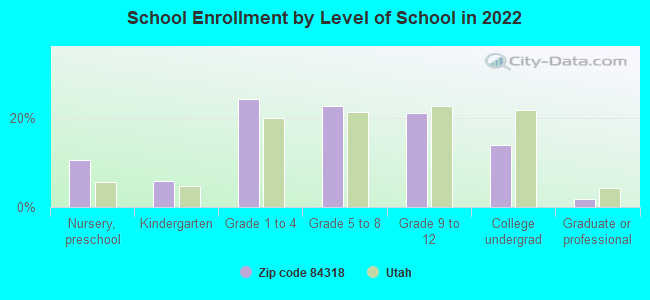
Private vs. public school enrollment:
Students in private schools in grades 1 to 8 (elementary and middle school): 17
Here:
2.1%
Utah:
7.2%
Students in private schools in grades 9 to 12 (high school): 7
Here:
1.9%
Utah:
5.3%
Students in private undergraduate colleges: 15
Here:
6.1%
Utah:
26.7%
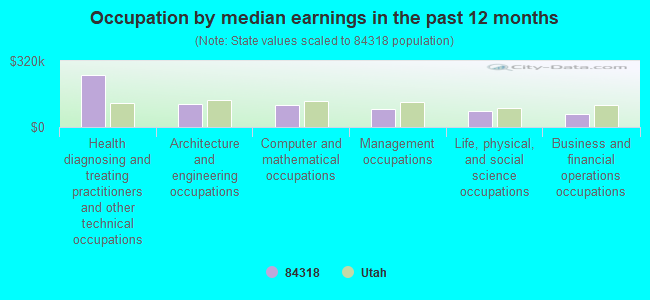
Occupation by median earnings in the past 12 months ($)
249,754Health diagnosing and treating practitioners and other technical occupations
112,375Architecture and engineering occupations
106,432Computer and mathematical occupations
89,152Management occupations
76,717Life, physical, and social science occupations
62,905Business and financial operations occupations
Companies with federal contracts located in this zip code:
INTEGRATED MANAGEMENT TECHNOLO (47N 300E in HYDE PARK, CA; small business) : $257,261 in 18 contractsfrom 1999 to 2005
Contracts for Laundry and DryCleaning Services by Air Force Signed by year:2000: $29,826; 2001: $29,827; 2002: $35,878; 2003: $58,424; 2004: $40,183; 2005: $37,175; 2006: $0.
Biggest contracts:
$60,000 with Air Force for Laundry and DryCleaning Services. Taking place in CA. Signed on 2005-10-07. Completion date: 2006-09-30.
$58,424, same as above.Signed on 2004-10-12. Completion date: 2005-09-30.
$58,424, same as above.Signed on 2003-10-01. Completion date: 2004-09-30.
$35,878, same as above.Signed on 2002-10-01. Completion date: 2003-09-30.
MOUNTAIN TOPPERS (4000 N HIGHWAY 91 in HYDE PARK, UT; small business) : $171,344 in 5 contractsfrom 2003 to 2006
Contracts for Prefabricated and Portable Buildings, Trailers, Combat, Assault, and Tactical Vehicles, Tracked by Air Force, Army Signed by year:2000: $0; 2001: $0; 2002: $0; 2003: $153,275; 2004: $0; 2005: $6,726; 2006: $11,343.
Biggest contracts:
$88,063 with Air Force for Prefabricated and Portable Buildings. Taking place in MD. Signed on 2003-09-30. Completion date: 2004-10-30.
$33,917 with Air Force for Trailers. Signed on 2003-09-10. Completion date: 2003-11-01.
$31,295 with Army for Combat, Assault, and Tactical Vehicles, Tracked. Signed on 2003-09-18. Completion date: 2003-09-25.
$11,343 with Army for Trailers. Signed on 2006-03-16. Completion date: 2006-09-30.
JM Mechainical ( in Hyde Park, UT; small business)
$427 with Agricultural Research Service for Maintenance, Repair or Alteration of Real Property -- Government-Owned Contractor-Operated (GOCO) R&D Facilities. Signed on 2005-04-18. Completion date: 2005-04-18.
Top industries in this zip code by the number of employees in 2005:
Construction: New Single-Family Housing Construction (except Operative Builders) (10-19 employees: 2 establishments, 5-9 employees: 1 establishment, 1-4 employees: 7 establishments)
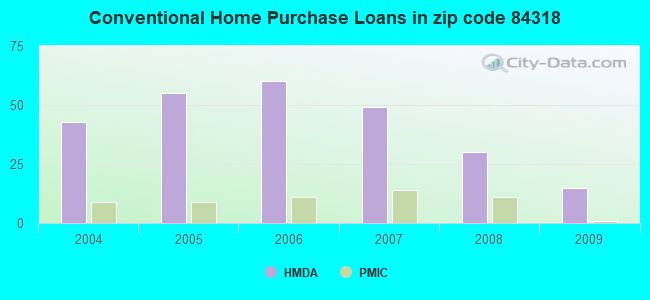
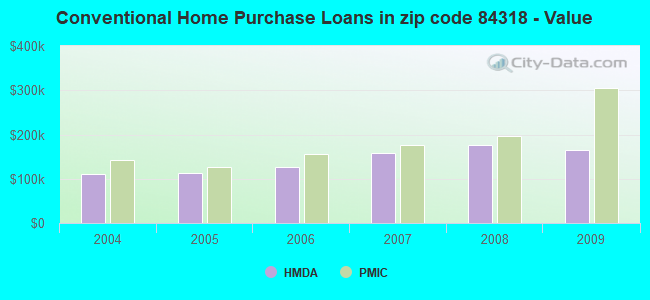
Detailed PMIC statistics for the following Tracts:0004.03
2002 - 2018 National Fire Incident Reporting System (NFIRS) incidents
According to the data from the years 2002 - 2018 the average number of fires per year is 7. The highest number of fire incidents - 15 took place in 2005, and the least - 1 in 2011. The data has an increasing trend.
When looking into fire subcategories, the most reports belonged to: Structure Fires (47.4%), and Outside Fires (31.9%).
Fire incident types reported to NFIRS in Zip Code 84318


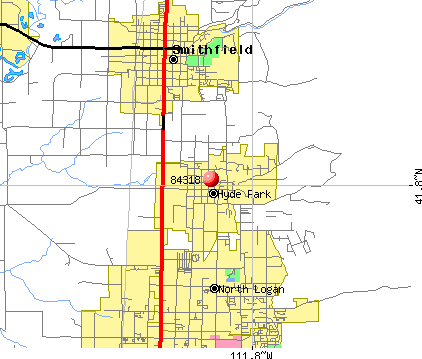 Nearest zip codes: 84341, 84335, 84321, 84332, 84333, 84326.
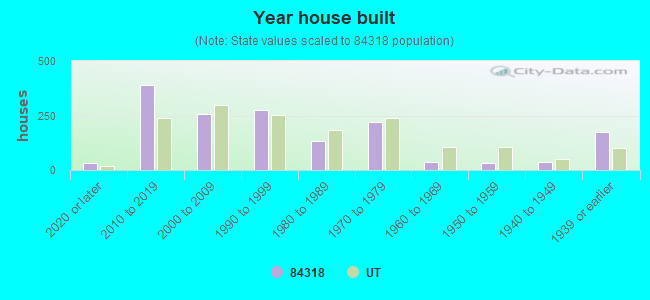


 According to the data from the years 2002 - 2018 the average number of fires per year is 7. The highest number of fire incidents - 15 took place in 2005, and the least - 1 in 2011. The data has an increasing trend.
 When looking into fire subcategories, the most reports belonged to: Structure Fires (47.4%), and Outside Fires (31.9%).