Estimated zip code population in 2022: 33,016 Zip code population in 2010: 31,486 Zip code population in 2000: 27,299
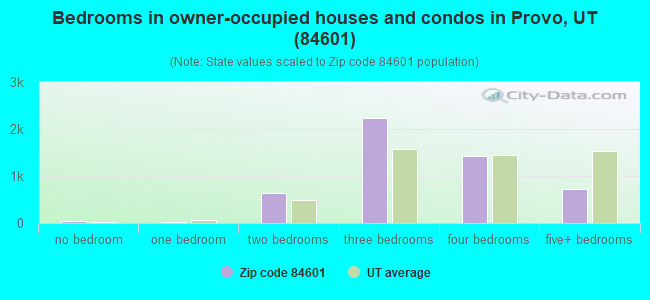
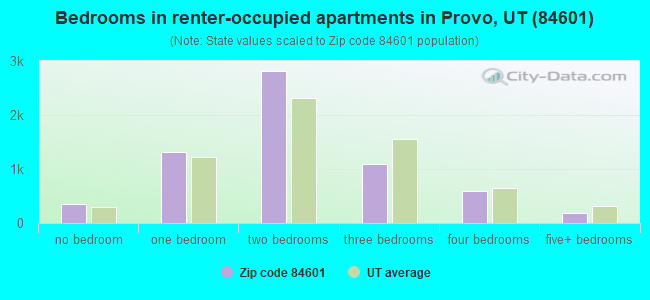
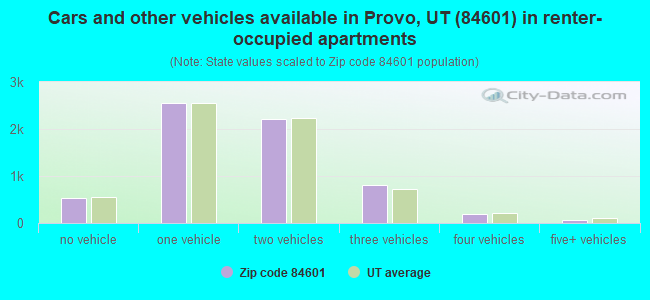
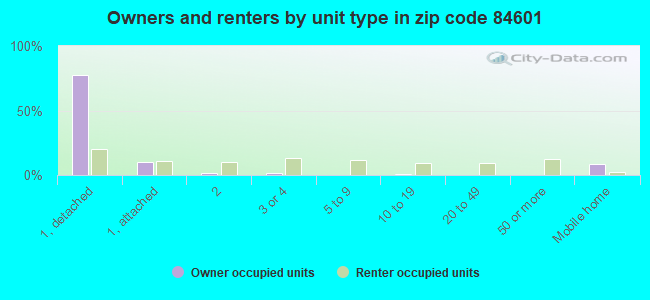
Houses and condos: 12,003 Renter-occupied apartments: 6,368
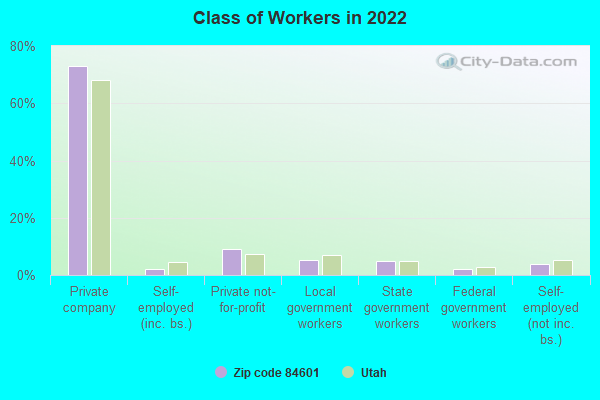
% of renters here:
55%
State:
29%
March 2022 cost of living index in zip code 84601: 90.0 (less than average, U.S. average is 100)
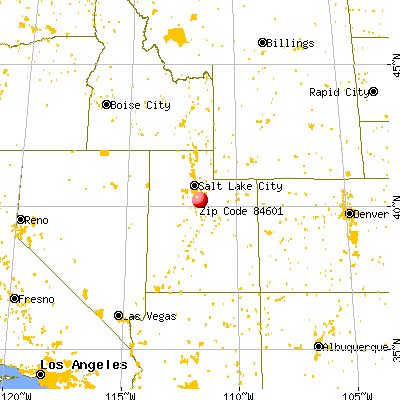
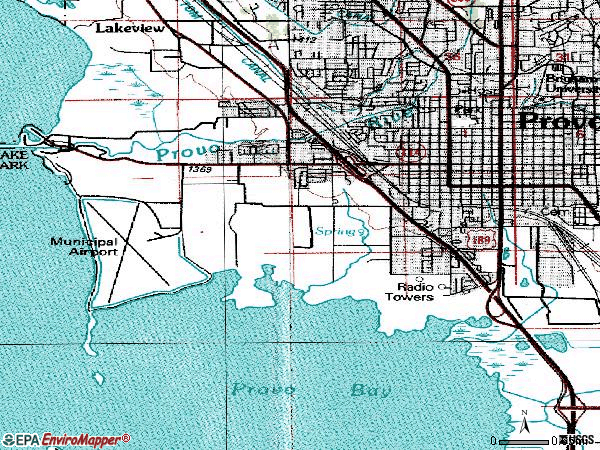
Land area: 14.0 sq. mi. Water area: 0.0 sq. mi.
Population density: 2,362 people per square mile
(low).
OSM Map
General Map
Google Map
MSN Map
OSM Map
General Map
Google Map
MSN Map
OSM Map
General Map
Google Map
MSN Map
OSM Map
General Map
Google Map
MSN Map
Please wait while loading the map...
Real estate property taxes paid for housing units in 2022:
This zip code:
0.4% ($1,688)
Utah:
0.5% ($2,376)
Median real estate property taxes paid for housing units with mortgages in 2022: $1,750 (0.4%) Median real estate property taxes paid for housing units with no mortgage in 2022: $1,484 (0.4%)
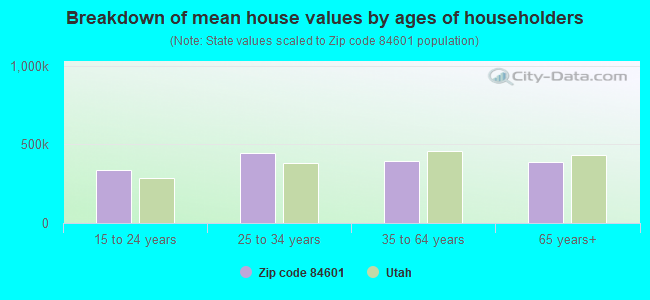
Estimated median house/condo value in 2022: $418,064
84601:
$418,064
Utah:
$499,500
According to our research of Utah and other state lists, there were 76 registered sex offenders living in 84601 zip code as of April 27, 2024. The ratio of all residents to sex offenders in zip code 84601 is 460 to 1. The ratio of registered sex offenders to all residents in this zip code is lower than the state average.
Median resident age:
This zip code:
26.0 years
Utah median age:
32.1 years
Average household size:
This zip code:
2.8 people
Utah:
3.0 people
Averages for the 2020 tax year for zip code 84601, filed in 2021:
Average Adjusted Gross Income (AGI) in 2020: $48,090 (Individual Income Tax Returns)
Here:
$48,090
State:
$81,660
Salary/wage: $42,885 (reported on 91.5% of returns)
Here:
$42,885
State:
$63,027
(% of AGI for various income ranges: 1358.0% for AGIs below $25k, 4087.9% for AGIs $25k-50k, 7196.4% for AGIs $50k-75k, 10766.5% for AGIs $75k-100k, 18031.6% for AGIs $100k-200k, 48837.1% for AGIs over 200k)
Taxable interest for individuals: $794 (reported on 16.2% of returns)
This zip code:
$794
Utah:
$2,255
(% of AGI for various income ranges: 4.5% for AGIs below $25k, 6.7% for AGIs $25k-50k, 19.9% for AGIs $50k-75k, 31.7% for AGIs $75k-100k, 59.0% for AGIs $100k-200k, 602.9% for AGIs over 200k)
Ordinary dividends: $1,432 (reported on 8.3% of returns)
Here:
$1,432
State:
$7,362
(% of AGI for various income ranges: 3.6% for AGIs below $25k, 6.7% for AGIs $25k-50k, 18.4% for AGIs $50k-75k, 23.1% for AGIs $75k-100k, 67.1% for AGIs $100k-200k, 511.4% for AGIs over 200k)
Net capital gain/loss in AGI: +$9,863 (reported on 9.4% of returns)
Here:
+$9,863
State:
+$43,433
(% of AGI for various income ranges: 3.5% for AGIs below $25k, 16.4% for AGIs $25k-50k, 45.9% for AGIs $50k-75k, 80.4% for AGIs $75k-100k, 471.3% for AGIs $100k-200k, 11170.0% for AGIs over 200k)
Profit/loss from business: +$6,849 (reported on 15.9% of returns)
Here:
+$6,849
State:
+$9,957
(% of AGI for various income ranges: 92.3% for AGIs below $25k, 126.8% for AGIs $25k-50k, 143.8% for AGIs $50k-75k, 146.9% for AGIs $75k-100k, 399.9% for AGIs $100k-200k, 1402.9% for AGIs over 200k)
Taxable individual retirement arrangement distribution: $14,373 (reported on 2.6% of returns)
84601:
$14,373
Utah:
$21,167
(% of AGI for various income ranges: 12.1% for AGIs below $25k, 22.8% for AGIs $25k-50k, 36.0% for AGIs $50k-75k, 78.1% for AGIs $75k-100k, 413.7% for AGIs $100k-200k)
Total itemized deductions: $30,716 (reported on 7.3% of returns)
Here:
$30,716
State:
$41,056
(% of AGI for various income ranges: 9.2% for AGIs below $25k, 68.3% for AGIs $25k-50k, 247.2% for AGIs $50k-75k, 597.1% for AGIs $75k-100k, 2039.6% for AGIs $100k-200k, 8855.7% for AGIs over 200k)
Charity contributions: $14,238 (reported on 6.6% of returns)
Here:
$14,238
State:
$22,261
(% of AGI for various income ranges: 19.4% for AGIs $25k-50k, 67.5% for AGIs $50k-75k, 211.3% for AGIs $75k-100k, 917.9% for AGIs $100k-200k, 5031.4% for AGIs over 200k)
Taxes paid: $6,801 (reported on 7.3% of returns)
84601:
$6,801
State:
$7,985
(% of AGI for various income ranges: 0.9% for AGIs below $25k, 10.8% for AGIs $25k-50k, 51.1% for AGIs $50k-75k, 139.0% for AGIs $75k-100k, 510.6% for AGIs $100k-200k, 1665.7% for AGIs over 200k)
Earned income credit: $2,244 (reported on 17.0% of returns)
Here:
$2,244
State:
$2,169
(% of AGI for various income ranges: 72.5% for AGIs below $25k, 67.4% for AGIs $25k-50k, 2.5% for AGIs $50k-75k)
Percentage of individuals using paid preparers for their 2020 taxes: 93.8%
Here:
94%
State:
94%
(% for various income ranges: 92.9% for AGIs below $25k, 94.0% for AGIs $25k-50k, 93.9% for AGIs $50k-75k, 94.9% for AGIs $75k-100k, 94.8% for AGIs $100k-200k, 100.0% for AGIs over 200k)
Averages for the 2012 tax year for zip code 84601, filed in 2013:
Average Adjusted Gross Income (AGI) in 2012: $34,993 (Individual Income Tax Returns)
Here:
$34,993
State:
$60,327
Salary/wage: $32,699 (reported on 92.6% of returns)
Here:
$32,699
State:
$48,762
(% of AGI for various income ranges: 88.3% for AGIs below $25k, 90.6% for AGIs $25k-50k, 88.2% for AGIs $50k-75k, 86.5% for AGIs $75k-100k, 82.4% for AGIs $100k-200k, 60.5% for AGIs over 200k)
Taxable interest for individuals: $400 (reported on 20.0% of returns)
This zip code:
$400
Utah:
$1,534
(% of AGI for various income ranges: 0.3% for AGIs below $25k, 0.1% for AGIs $25k-50k, 0.2% for AGIs $50k-75k, 0.2% for AGIs $75k-100k, 0.3% for AGIs $100k-200k, 0.4% for AGIs over 200k)
Ordinary dividends: $1,372 (reported on 6.0% of returns)
Here:
$1,372
State:
$5,711
(% of AGI for various income ranges: 0.3% for AGIs below $25k, 0.1% for AGIs $25k-50k, 0.2% for AGIs $50k-75k, 0.2% for AGIs $75k-100k, 0.5% for AGIs $100k-200k)
Net capital gain/loss in AGI: +$8,175 (reported on 5.0% of returns)
Here:
+$8,175
State:
+$23,734
(% of AGI for various income ranges: 0.1% for AGIs $25k-50k, 0.2% for AGIs $50k-75k, 0.5% for AGIs $75k-100k, 0.6% for AGIs $100k-200k, 18.6% for AGIs over 200k)
Profit/loss from business: +$6,054 (reported on 14.3% of returns)
Here:
+$6,054
State:
+$8,845
(% of AGI for various income ranges: 6.1% for AGIs below $25k, 2.7% for AGIs $25k-50k, 1.0% for AGIs $50k-75k, 1.4% for AGIs $75k-100k, 1.1% for AGIs $100k-200k)
Taxable individual retirement arrangement distribution: $8,995 (reported on 3.1% of returns)
84601:
$8,995
Utah:
$15,565
(% of AGI for various income ranges: 0.8% for AGIs below $25k, 0.6% for AGIs $25k-50k, 0.7% for AGIs $50k-75k, 1.1% for AGIs $75k-100k, 1.4% for AGIs $100k-200k)
Total itemized deductions: $19,059 (27% of AGI, reported on 23.0% of returns)
Here:
$19,059
State:
$25,197
Here:
26.9% of AGI
State:
22.4% of AGI
(% of AGI for various income ranges: 3.8% for AGIs below $25k, 9.1% for AGIs $25k-50k, 17.1% for AGIs $50k-75k, 19.6% for AGIs $75k-100k, 18.7% for AGIs $100k-200k, 12.5% for AGIs over 200k)
Charity contributions: $6,471 (reported on 20.5% of returns)
Here:
$6,471
State:
$8,502
(% of AGI for various income ranges: 0.6% for AGIs below $25k, 2.1% for AGIs $25k-50k, 4.9% for AGIs $50k-75k, 6.5% for AGIs $75k-100k, 7.1% for AGIs $100k-200k, 5.5% for AGIs over 200k)
Taxes paid: $4,130 (reported on 22.9% of returns)
84601:
$4,130
State:
$7,001
(% of AGI for various income ranges: 0.4% for AGIs below $25k, 1.5% for AGIs $25k-50k, 3.5% for AGIs $50k-75k, 4.6% for AGIs $75k-100k, 5.1% for AGIs $100k-200k, 4.6% for AGIs over 200k)
Earned income credit: $2,424 (reported on 26.6% of returns)
Here:
$2,424
State:
$2,259
(% of AGI for various income ranges: 7.0% for AGIs below $25k, 1.8% for AGIs $25k-50k)
Percentage of individuals using paid preparers for their 2012 taxes: 50.7%
Here:
51%
State:
51%
(% for various income ranges: 48.5% for AGIs below $25k, 54.0% for AGIs $25k-50k, 53.2% for AGIs $50k-75k, 47.6% for AGIs $75k-100k, 48.8% for AGIs $100k-200k, 60.0% for AGIs over 200k)
Averages for the 2004 tax year for zip code 84601, filed in 2005:
Average Adjusted Gross Income (AGI) in 2004: $32,502 (Individual Income Tax Returns)
Here:
$32,502
State:
$45,498
Salary/wage: $28,036 (reported on 93.3% of returns)
Here:
$28,036
State:
$38,975
(% of AGI for various income ranges: 126.0% for AGIs below $10k, 91.2% for AGIs $10k-25k, 92.7% for AGIs $25k-50k, 89.4% for AGIs $50k-75k, 88.7% for AGIs $75k-100k, 34.6% for AGIs over 100k)
Taxable interest for individuals: $572 (reported on 28.8% of returns)
This zip code:
$572
Utah:
$1,445
(% of AGI for various income ranges: 1.6% for AGIs below $10k, 0.6% for AGIs $10k-25k, 0.4% for AGIs $25k-50k, 0.4% for AGIs $50k-75k, 0.3% for AGIs $75k-100k, 0.6% for AGIs over 100k)
Taxable dividends: $9,787 (reported on 8.1% of returns)
Here:
$9,787
State:
$3,152
(% of AGI for various income ranges: 1.0% for AGIs below $10k, 0.3% for AGIs $10k-25k, 0.2% for AGIs $25k-50k, 0.2% for AGIs $50k-75k, 0.1% for AGIs $75k-100k, 11.1% for AGIs over 100k)
Net capital gain/loss: +$11,090 (reported on 7.4% of returns)
Here:
+$11,090
State:
+$14,059
(% of AGI for various income ranges: -0.9% for AGIs below $10k, -0.1% for AGIs $10k-25k, 0.2% for AGIs $25k-50k, 0.3% for AGIs $50k-75k, 1.5% for AGIs $75k-100k, 11.5% for AGIs over 100k)
Profit/loss from business: +$2,618 (reported on 14.1% of returns)
Here:
+$2,618
State:
+$6,903
(% of AGI for various income ranges: 4.2% for AGIs below $10k, 2.6% for AGIs $10k-25k, 1.2% for AGIs $25k-50k, 1.2% for AGIs $50k-75k, 0.1% for AGIs $75k-100k, -0.3% for AGIs over 100k)
IRA payment deduction: $2,523 (reported on 0.9% of returns)
84601:
$2,523
Utah:
$2,970
(% of AGI for various income ranges: 0.0% for AGIs $10k-25k, 0.1% for AGIs $25k-50k, 0.1% for AGIs $50k-75k, 0.2% for AGIs $75k-100k)
Total itemized deductions: $19,845 (30% of AGI, reported on 28.8% of returns)
Here:
$19,845
State:
$20,312
Here:
29.8% of AGI
State:
24.9% of AGI
(% of AGI for various income ranges: 8.3% for AGIs below $10k, 6.8% for AGIs $10k-25k, 23.7% for AGIs $25k-50k, 22.0% for AGIs $50k-75k, 22.1% for AGIs $75k-100k, 13.0% for AGIs over 100k)
Charity contributions deductions: $5,590 (8% of AGI, reported on 26.0% of returns)
Here:
$5,590
State:
$6,250
Here:
8.0% of AGI
State:
7.4% of AGI
(% of AGI for various income ranges: 0.9% for AGIs below $10k, 1.3% for AGIs $10k-25k, 3.6% for AGIs $25k-50k, 6.6% for AGIs $50k-75k, 6.9% for AGIs $75k-100k, 5.9% for AGIs over 100k)
Total tax: $4,065 (reported on 55.3% of returns)
84601:
$4,065
State:
$6,523
(% of AGI for various income ranges: 2.2% for AGIs below $10k, 2.6% for AGIs $10k-25k, 3.7% for AGIs $25k-50k, 5.9% for AGIs $50k-75k, 7.3% for AGIs $75k-100k, 17.0% for AGIs over 100k)
Earned income credit: $1,844 (reported on 22.9% of returns)
Here:
$1,844
State:
$1,703
Percentage of individuals using paid preparers for their 2004 taxes: 55.6%
Here:
56%
State:
53%
(% for various income ranges: 47.6% for AGIs below $10k, 59.9% for AGIs $10k-25k, 58.3% for AGIs $25k-50k, 52.5% for AGIs $50k-75k, 50.6% for AGIs $75k-100k, 59.9% for AGIs over 100k)
Likely homosexual households (counted as self-reported same-sex unmarried-partner households)
Lesbian couples: 0.1% of all households
Gay men: 0.1% of all households
Household received Food Stamps/SNAP in the past 12 months: 879 Household did not receive Food Stamps/SNAP in the past 12 months: 10,674
Women who had a birth in the past 12 months: 666 (546 now married, 116 unmarried) Women who did not have a birth in the past 12 months: 9,425 (5,108 now married, 4,300 unmarried)
Housing units in zip code 84601 with a mortgage: 3,542 (445 second mortgage, 4 home equity loan, 359 both second mortgage and home equity loan) Houses without a mortgage: 50
Median monthly owner costs for units with a mortgage: $1,669 Median monthly owner costs for units without a mortgage: $471
Residents with income below the poverty level in 2022:
This zip code:
15.4%
Whole state:
8.2%
Residents with income below 50% of the poverty level in 2022:
This zip code:
10.4%
Whole state:
4.3%
Median number of rooms in houses and condos:
Here:
6.4
State:
7.6
Median number of rooms in apartments:
Here:
4.1
State:
4.3
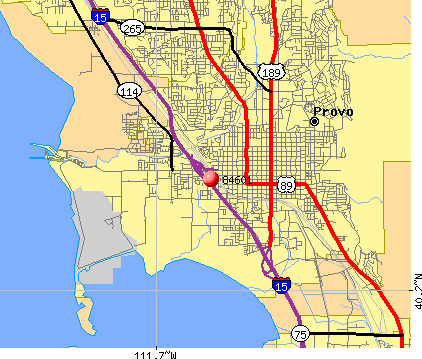
Notable locations in this zip code not listed on our city pages
Notable locations in zip code 84601: Silver Fox Campground (A), Provo Town Square (B), Lakeside Campground (C), KOA Campground (D), Continental Plaza (E), Provo Fire and Rescue Station 4 (F), Utah Valley University Utah Fire and Rescue Academy (G), Provo Fire and Rescue Station 1 (H). Display/hide their locations on the map
Churches in zip code 84601 include: Church of the Nazarene (A), Community Congregational Church (B), Harvest Bible Fellowship (C), Saint Francis Catholic Church (D), Saint Marys Episcopal Church (E), The Church of Jesus Christ of Latter Day Saints (F), Kingdom Hall of Jehovahs Witnesses (G), Provo United Pentacostal Church (H). Display/hide their locations on the map
5,589 married couples with children.
1,500 single-parent households (485 men, 1,015 women).
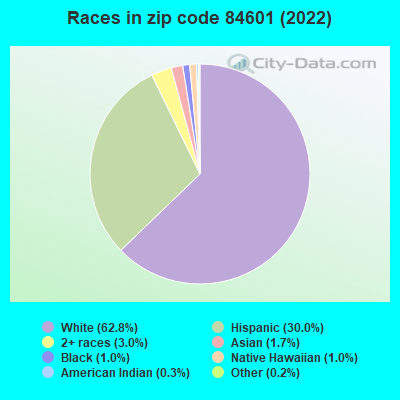
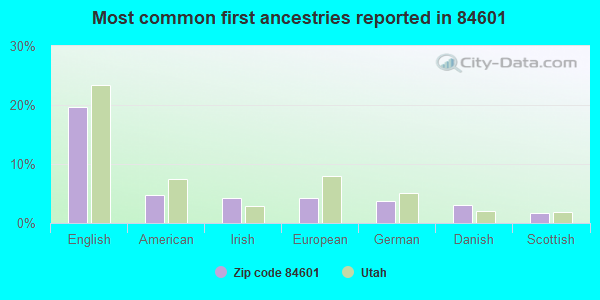
67.7% of residents of 84601 zip code speak English at home.
26.0% of residents speak Spanish at home (61% very well, 21% well, 10% not well, 8% not at all).
2.9% of residents speak other Indo-European language at home (86% very well, 4% well, 8% not well, 2% not at all).
3.2% of residents speak Asian or Pacific Island language at home (65% very well, 26% well, 8% not well).
0.1% of residents speak other language at home (66% very well, 34% well).
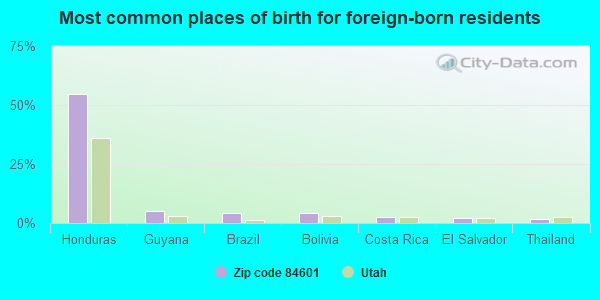
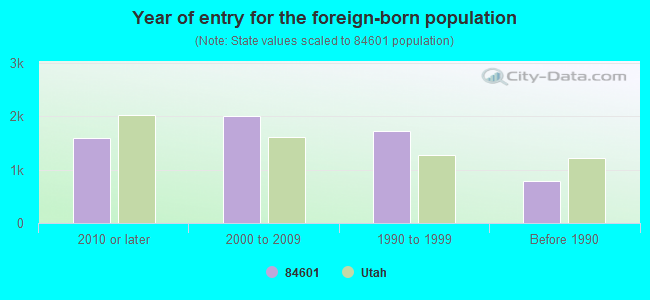
Foreign born population: 5,768 (17.5%) (38.7% of them are naturalized citizens)
Major facilities with environmental interests located in this zip code:
ACTION TARGET INC (1281 WEST 200 NORTH in PROVO, UT)
(Integrated Compliance Information System) - ICIS-08-2005-0137, ENFORCEMENT/COMPLIANCE ACTIVITY FORMAL ENFORCEMENT ACTION (Integrated Compliance Information System) - ICIS-08-2005-0137, ENFORCEMENT/COMPLIANCE ACTIVITY TRI REPORTER (Tracking of toxic chemicals releasing facilities) Business SIC classification: FABRICATED STRUCTURAL METAL; FABRICATED METAL PRODUCTS
COMMUNITY PRESS (5600 N UNIVERSITY AVE in PROVO, UT)
STATE MASTER (Utah compliance and permitting operations) - SQG DATABASE-7, CESQG Small Quantity Generators, between 100 kg and 1000 kg of hazardous waste/month (Resource Conservation and Recovery Act (tracking hazardous waste)) - notification Organizations: JOHN C. REVILL (CONTACT/OWNER)
MODERN CLEANERS (44 S 200 W in PROVO, UT)
STATE MASTER (Utah compliance and permitting operations) - SQG DATABASE-7, CESQG Small Quantity Generators, between 100 kg and 1000 kg of hazardous waste/month (Resource Conservation and Recovery Act (tracking hazardous waste)) - notification Organizations: PATRICIA COLLINS (CONTACT/OWNER)
AMELIA EARHART ELEM SCH (2585 W 200 S in PROVO, UT)
(National Center for Education Statistics) - STATE ID-38 100 Organizations: PROVO SCHOOL DISTRICT (SCHOOL DISTRICT)
FRANKLIN ELEM SCH (350 S 600 W in PROVO, UT)
(National Center for Education Statistics) - STATE ID-38 104 Organizations: PROVO SCHOOL DISTRICT (SCHOOL DISTRICT)
INDEPENDENCE HIGH (636 N INDEPENDENCE AVE in PROVO, UT)
(National Center for Education Statistics) - STATE ID-38 730 Organizations: PROVO SCHOOL DISTRICT (SCHOOL DISTRICT)
HOME DEPOT (1550 SOUTH UNIVERSITY AVENUE in PROVO, UT)
ENFORCEMENT/COMPLIANCE ACTIVITY (Integrated Compliance Information System) National Pollutant Discharge Elimination System NON-MAJOR (Tracking pollutant discharge elimination systems) - permit Conditionally Exempt Small Quantity Generators, less than 100 kg/month of hazardous waste (Resource Conservation and Recovery Act (tracking hazardous waste)) Business SIC classification: GENERAL CONTRACTORS-NONRESIDENTIAL BUILDINGS, OTHER THAN INDUSTRIAL BUILDINGS AND WAREHOUSES Organizations: THE HOME DEPOT USA (CONTACT/OPERATOR)
Alternative names: ESI GENERAL CONTRACTORS, THE HOME DEPOT #4416, Home Depot Provo
I CENTRAL (225 N UNIVERSITY in PROVO, UT)
(Integrated Compliance Information System) - ICIS-08-1999-0102, FORMAL ENFORCEMENT ACTION
LIBERTY SAFE (316 WEST 700 SOUTH in PROVO, UT)
AIR MINOR (AIRS/AFS) CRITERIA AND HAZARDOUS AIR POLLUTANT INVENTORY (Inventory of air pollution sources) Small Quantity Generators, between 100 kg and 1000 kg of hazardous waste/month (Resource Conservation and Recovery Act (tracking hazardous waste)) - notification TRI REPORTER (Tracking of toxic chemicals releasing facilities) Business SIC classification: FABRICATED METAL PRODUCTS Organizations: GAIUS CROSBY (CONTACT/OWNER)
Alternative names: LIBERTY SAFE & SECURITY INC., LIBERTY SAFE PROVO, LIBERTY SAFES, WEST PROVO
BACKMAN FOUNDRY (565 SOUTH 900 WEST in PROVO, UT)
AIR MINOR (AIRS/AFS) COMPLIANCE ACTIVITY (Tracking inspections of insecticide, fungicide, and rodenticide, and toxic substances) Business SIC classification: GRAY AND DUCTILE IRON FOUNDRIES Alternative names: BACKMAN FOUNDRY MACHINE INC
EXPRESSLINE CLEANERS (2250 NORTH UNIVERSITY PKWY in PROVO, UT)
Conditionally Exempt Small Quantity Generators, less than 100 kg/month of hazardous waste (Resource Conservation and Recovery Act (tracking hazardous waste)) - notification Conditionally Exempt Small Quantity Generators, less than 100 kg/month of hazardous waste (Resource Conservation and Recovery Act (tracking hazardous waste)) - notification Organizations: CANDA MORTENSON (CONTACT/OWNER)
, JOHN OR RUTH PRATT (CONTACT/OWNER)
Alternative names: LAUNDRY PLUS
HAULMARK INDUSTRIES INCORPORATED (1111 W 100 S in PROVO, UT)
AIR MINOR (AIRS/AFS) STATE MASTER (Utah compliance and permitting operations) Business SIC classification: TRUCK TRAILERS
DURFEY EXTRA CARE DRYCLEANERS INC. (445 NORTH 900 EAST in PROVO, UT)
Small Quantity Generators, between 100 kg and 1000 kg of hazardous waste/month (Resource Conservation and Recovery Act (tracking hazardous waste)) - notification Organizations: DURFEY CARE DRYCLEANERS (CONTACT/OWNER)
Housing units lacking complete plumbing facilities: 0.2% Housing units lacking complete kitchen facilities: 0.5%
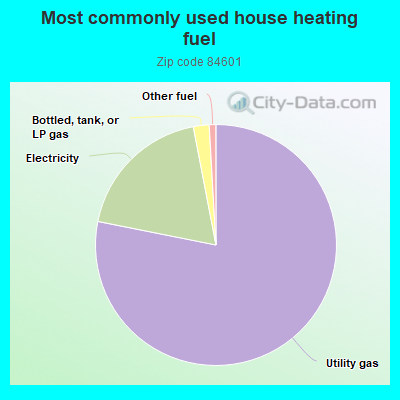
77.9%Utility gas
18.8%Electricity
2.1%Bottled, tank, or LP gas
0.9%Other fuel
Population in 1990: 20,121. Population change in the 1990s: +7,178 (+35.7%).
Place of birth for U.S.-born residents:
This state: 15,596
Northeast: 527
Midwest: 1,480
South: 1,630
West: 7,748
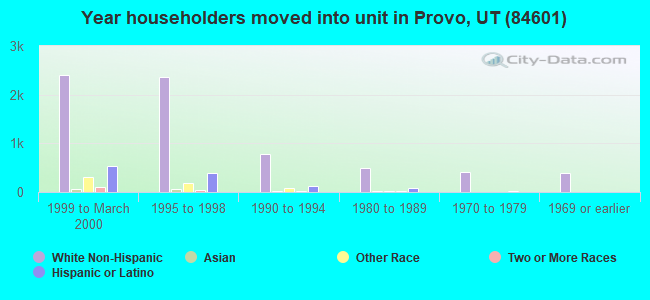
35% of the 84601 zip code residents lived in the same house 5 years ago. Out of people who lived in different houses, 60% lived in this county. Out of people who lived in different counties, 50% lived in Utah.
84% of the 84601 zip code residents lived in the same house 1 year ago. Out of people who lived in different houses, 71% moved from this county. Out of people who lived in different houses, 9% moved from different county within same state. Out of people who lived in different houses, 13% moved from different state. Out of people who lived in different houses, 4% moved from abroad.
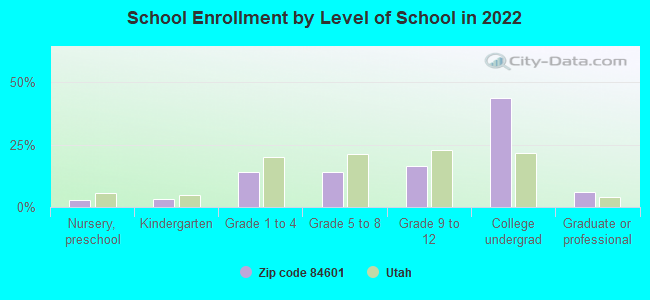
Private vs. public school enrollment:
Students in private schools in grades 1 to 8 (elementary and middle school): 191
Here:
6.1%
Utah:
7.2%
Students in private schools in grades 9 to 12 (high school): 85
Here:
4.6%
Utah:
5.3%
Students in private undergraduate colleges: 2,549
Here:
53.1%
Utah:
26.7%
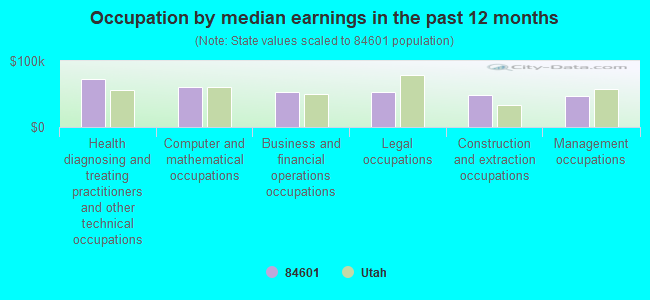
Occupation by median earnings in the past 12 months ($)
73,302Health diagnosing and treating practitioners and other technical occupations
60,868Computer and mathematical occupations
53,314Business and financial operations occupations
52,951Legal occupations
47,826Construction and extraction occupations
47,657Management occupations
Companies with federal contracts located in this zip code (PROVO, UT):
RMA VENTURES, CALIFORNIA (800 N 190 W; small business) : $7,075,567 in 40 contractsfrom 1999 to 2005
Contracts for Lease or Rental of Facilities -- Office Buildings by Public Buildings Service Signed by year:2000: $1,076,000; 2001: $1,080,000; 2002: $1,358,718; 2003: $2,556,305; 2004: $275,829; 2005: $459,715; 2006: $0.
Biggest contracts:
$274,741 with Public Buildings Service for Lease or Rental of Facilities -- Office Buildings. Taking place in CA. Signed on 2003-06-15. Completion date: 2003-06-15.
$274,741, same as above.Signed on 2003-09-15. Completion date: 2003-09-15.
$272,359, same as above.Signed on 2002-12-15. Completion date: 2002-12-15.
$272,359, same as above.Signed on 2003-09-15. Completion date: 2003-09-15.
GROUP VIII TECHNOLOGY INC (1652 WEST 820 NORTH; small business) : $400,641 in 7 contractsfrom 1999 to 2001
Contracts for Data Collection Services by Department of Defense Signed by year:2000: $236,389; 2001: $110,169; 2002: $0; 2003: $0; 2004: $0; 2005: $0; 2006: $0.
Biggest contracts:
$110,169 with Department of Defense for Data Collection Services. Taking place in OH. Signed on 2001-03-01. Completion date: 2001-04-10.
$79,539 with Department of Defense for Data Collection Services. Signed on 2000-05-15. Completion date: 2000-05-31.
$63,453, same as above.Signed on 2000-06-15. Completion date: 2000-07-24.
$54,083, same as above.Signed on 1999-10-06. Completion date: 1999-10-25.
LARSON DAVIS INCORPORATED (1681 WEST 820 NORTH; small business) : $289,193 in 22 contractsfrom 2001 to 2006
Contracts for Maintenance, Repair and Rebuilding of Equipment -- Instruments and Laboratory Equipment, Electrical and Electronic Properties Measuring and Testing Instruments, Maintenance, Repair and Rebuilding of Equipment -- Miscellaneous, Maintenance, Repair and Rebuilding of Equipment -- Electrical and Electronic Equipment Components, and moreby Army Signed by year:2000: $0; 2001: $31,980; 2002: $27,000; 2003: $97,178; 2004: $59,964; 2005: $59,858; 2006: $13,213.
Biggest contracts:
$49,964 with Army for Maintenance, Repair and Rebuilding of Equipment -- Instruments and Laboratory Equipment. Signed on 2005-12-20. Completion date: 2006-09-30.
$46,964, same as above.Signed on 2003-12-03. Completion date: 2004-09-30.
$45,964, same as above.Signed on 2004-10-25. Completion date: 2005-09-30.
$45,964, same as above.Signed on 2003-03-04. Completion date: 2003-09-30.
CENTRAL UTAH AVIATION INC. (PROVO AIRPORT; small business) 7 employees, $0 revenue. : $16,627 in 5 contractsfrom 2001 to 2003
Contracts for Lease or Rental of Facilities -- Other Airfield Structures by Forest Service (disused code: now 12C2), Forest Service Signed by year:2000: $0; 2001: $8,000; 2002: $4,950; 2003: $3,677; 2004: $0; 2005: $0; 2006: $0.
Biggest contracts:
$5,000 with Forest Service (disused code: now 12C2) for Lease or Rental of Facilities -- Other Airfield Structures. Signed on 2001-10-15. Completion date: 2002-09-15.
$4,950 with Forest Service for Lease or Rental of Facilities -- Other Airfield Structures. Signed on 2002-10-15. Completion date: 2003-09-15.
$3,677, same as above.Signed on 2003-09-15. Completion date: 2003-09-15.
$3,000 with Forest Service (disused code: now 12C2) for Lease or Rental of Facilities -- Other Airfield Structures. Signed on 2001-05-15. Completion date: 2001-09-15.
RB&G ENGINEERING, INC (1435 WEST 820 NORTH; small business) : $8,338 in 4 contractsfrom 2005 to 2006
$8,839 with National Park Service for Other Architect and Engineering Services. Signed on 2005-07-27. Completion date: 2005-07-27.
$2,250 with Army for Other Quality Control, Testing and Inspection Services -- Miscellaneous. Signed on 2005-09-07. Completion date: 2005-10-31.
$300, same as above.Signed on 2006-01-31. Completion date: 2005-10-31.
-$3,051 with Army for Other Environmental Services, Studies, and Analytical Support. Signed on 2005-09-22. Completion date: 2005-09-22.
FAYCO (711 S 500 W; small business) : $4,560 in 2 contractsin 2003
$4,560 with Army for Custodial Janitorial Services. Signed on 2003-12-04. Completion date: 2004-09-30.
$0, same as above.Signed on 2003-12-04. Completion date: 2004-09-30.
Top industries in this zip code by the number of employees in 2005:
2002 - 2018 National Fire Incident Reporting System (NFIRS) incidents
Based on the data from the years 2002 - 2018 the average number of fires per year is 112. The highest number of reported fire incidents - 229 took place in 2002, and the least - 38 in 2007. The data has a decreasing trend.
When looking into fire subcategories, the most incidents belonged to: Outside Fires (46.7%), and Structure Fires (20.0%).
Fire incident types reported to NFIRS in Zip Code 84601


 Nearest zip codes: 84058, 84606, 84097, 84057, 84660, 84042.


 Based on the data from the years 2002 - 2018 the average number of fires per year is 112. The highest number of reported fire incidents - 229 took place in 2002, and the least - 38 in 2007. The data has a decreasing trend.
 When looking into fire subcategories, the most incidents belonged to: Outside Fires (46.7%), and Structure Fires (20.0%).