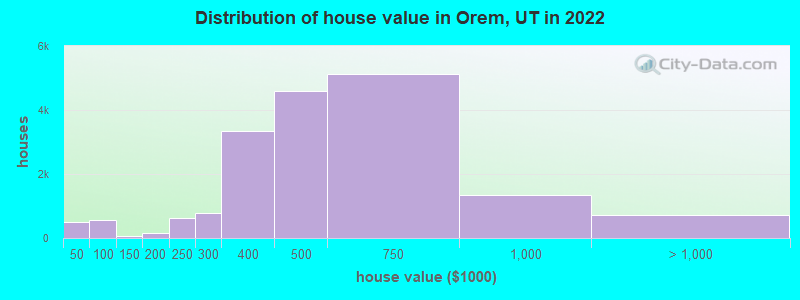
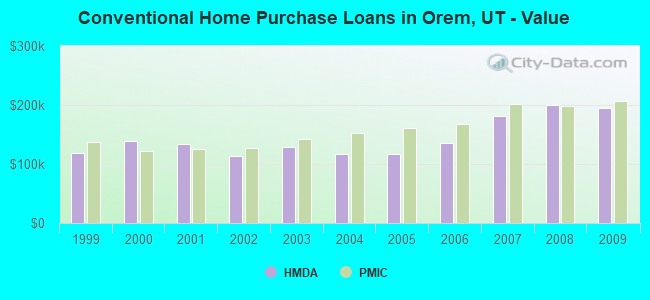
Estimated median house or condo value in 2022: $485,100 (it was $150,800 in 2000)
Orem:
$485,100
UT:
$499,500
Mean prices in 2022:all housing units: $497,423; detached houses: $541,674; townhouses or other attached units: $387,422; in 2-unit structures: $313,812; in 3-to-4-unit structures: $269,853; in 5-or-more-unit structures: $254,225; mobile homes: $128,666
Median gross rent in 2022: $1,428.
March 2022 cost of living index in Orem: 88.9 (less than average, U.S. average is 100)
Percentage of residents living in poverty in 2022: 9.6%
(9.1% for White Non-Hispanic residents, 22.8% for Black residents, 13.3% for Hispanic or Latino residents, 3.5% for American Indian residents, 5.1% for Native Hawaiian and other Pacific Islander residents, 18.3% for other race residents, 7.9% for two or more races residents)
According to our research of Utah and other state lists, there were 156 registered sex offenders living in Orem, Utah as of April 27, 2024. The ratio of all residents to sex offenders in Orem is 625 to 1. The ratio of registered sex offenders to all residents in this city is lower than the state average.
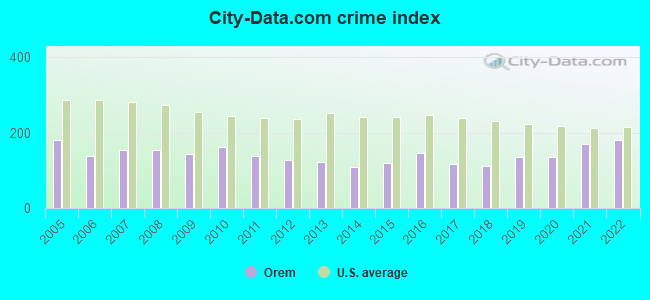
Crime rates in Orem by year
Type
2009
2010
2011
2012
2013
2014
2015
2016
2017
2018
2019
2020
2021
2022
Murders (per 100,000)
1 (1.1)
1 (1.1)
0 (0.0)
2 (2.2)
2 (2.2)
0 (0.0)
1 (1.1)
0 (0.0)
0 (0.0)
1 (1.0)
2 (2.0)
0 (0.0)
6 (6.0)
6 (6.2)
Rapes (per 100,000)
14 (14.9)
19 (21.5)
20 (22.2)
11 (12.0)
13 (14.2)
9 (9.7)
8 (8.6)
26 (27.2)
14 (14.1)
20 (20.2)
37 (37.5)
27 (27.3)
78 (78.0)
90 (92.4)
Robberies (per 100,000)
22 (23.5)
17 (19.2)
10 (11.1)
21 (22.8)
7 (7.7)
15 (16.2)
14 (15.1)
18 (18.8)
22 (22.2)
12 (12.1)
11 (11.1)
15 (15.2)
9 (9.0)
10 (10.3)
Assaults (per 100,000)
13 (13.9)
31 (35.1)
15 (16.7)
7 (7.6)
11 (12.0)
16 (17.3)
17 (18.4)
21 (22.0)
33 (33.3)
36 (36.3)
39 (39.5)
65 (65.7)
84 (83.9)
76 (78.0)
Burglaries (per 100,000)
220 (234.6)
240 (271.7)
166 (184.4)
203 (220.8)
192 (210.0)
162 (175.3)
196 (211.7)
209 (218.5)
191 (192.8)
152 (153.2)
156 (158.1)
195 (197.2)
161 (160.9)
129 (132.4)
Thefts (per 100,000)
2,184 (2,329)
2,204 (2,495)
2,069 (2,298)
1,887 (2,052)
1,789 (1,957)
1,693 (1,832)
1,784 (1,927)
2,116 (2,212)
1,696 (1,712)
1,576 (1,588)
1,673 (1,695)
1,672 (1,691)
1,346 (1,345)
1,363 (1,399)
Auto thefts (per 100,000)
116 (123.7)
109 (123.4)
87 (96.6)
78 (84.8)
98 (107.2)
97 (105.0)
123 (132.9)
122 (127.6)
129 (130.2)
99 (99.8)
141 (142.9)
173 (174.9)
146 (145.9)
150 (154.0)
Arson (per 100,000)
1 (1.1)
2 (2.3)
5 (5.6)
0 (0.0)
0 (0.0)
3 (3.2)
2 (2.2)
3 (3.1)
2 (2.0)
0 (0.0)
5 (5.1)
2 (2.0)
2 (2.0)
4 (4.1)
City-Data.com crime index
143.3
161.0
137.0
126.6
122.0
110.1
119.8
145.8
117.0
111.3
135.6
135.0
170.6
182.4
The City-Data.com crime index weighs serious crimes and violent crimes more heavily. Higher means more crime, U.S. average is 246.1. It adjusts for the number of visitors and daily workers commuting into cities.
- means the value is smaller than the state average. - means the value is about the same as the state average. - means the value is bigger than the state average. - means the value is much bigger than the state average.
Latest news from Orem, UT collected exclusively by city-data.com from local newspapers, TV, and radio stations
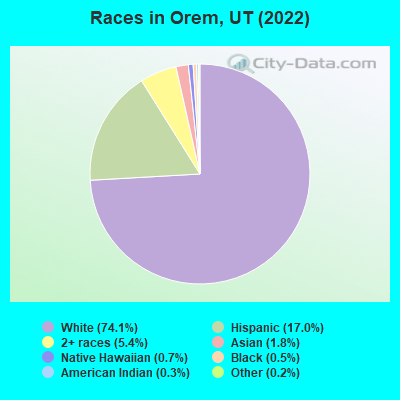
Ancestries: English (23.4%), European (9.0%), American (6.5%), German (4.4%), Italian (2.1%), British (1.6%).
Current Local Time: MST time zone
Incorporated in 1919
Elevation: 4756 feet
Land area: 18.4 square miles.
Population density: 5,201 people per square mile (average).
12,385 residents are foreign born (8.8% Latin America, 1.4% Asia).
This city:
12.1%
Utah:
8.4%
Median real estate property taxes paid for housing units with mortgages in 2022: $1,718 (0.3%) Median real estate property taxes paid for housing units with no mortgage in 2022: $1,865 (0.4%)
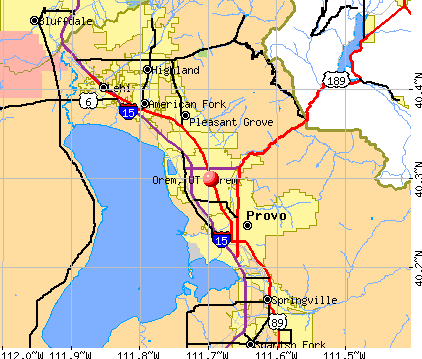
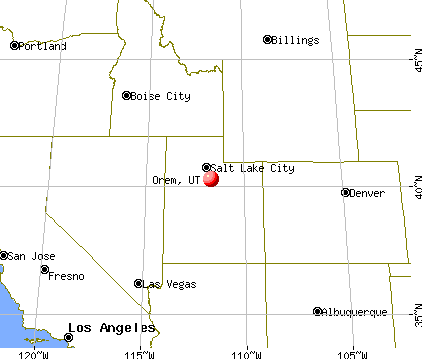
Nearest city with pop. 200,000+: Las Vegas, NV (342.4 miles , pop. 478,434).
Nearest city with pop. 1,000,000+: Phoenix, AZ (468.8 miles , pop. 1,321,045).
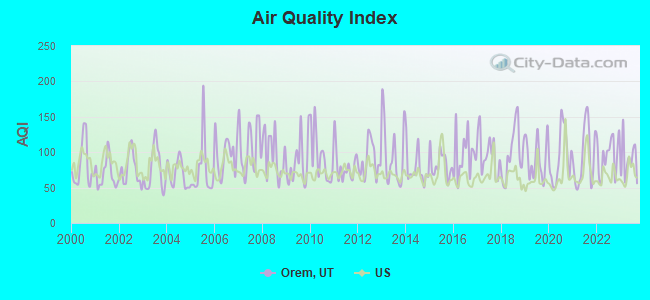
Air Quality Index (AQI) level in 2023 was 88.7. This is worse than average.
City:
88.7
U.S.:
72.6
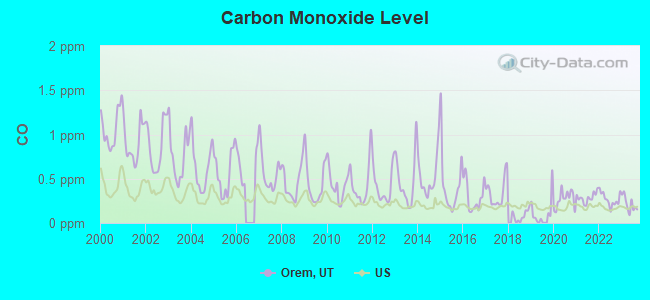
Carbon Monoxide (CO) [ppm] level in 2023 was 0.213. This is about average.Closest monitor was 0.9 miles away from the city center.
City:
0.213
U.S.:
0.251
Nitrogen Dioxide (NO2) [ppb] level in 2023 was 7.13. This is worse than average.Closest monitor was 3.1 miles away from the city center.
City:
7.13
U.S.:
5.11
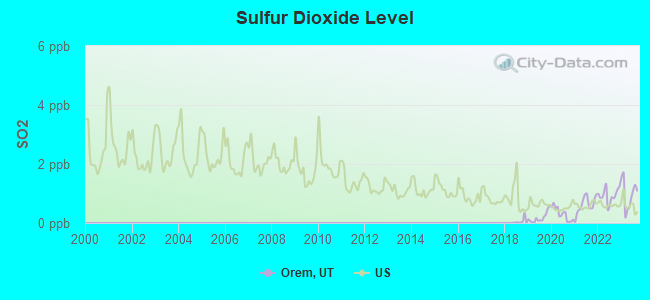
Sulfur Dioxide (SO2) [ppb] level in 2023 was 0.979. This is significantly better than average.Closest monitor was 3.1 miles away from the city center.
City:
0.979
U.S.:
1.515
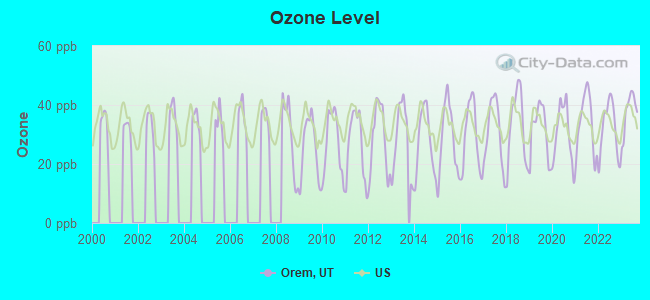
Ozone [ppb] level in 2023 was 37.7. This is about average.Closest monitor was 3.1 miles away from the city center.
City:
37.7
U.S.:
33.3
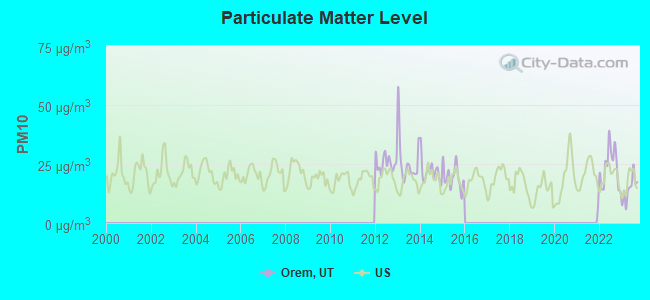
Particulate Matter (PM10) [µg/m3] level in 2023 was 14.5. This is better than average.Closest monitor was 1.4 miles away from the city center.
City:
14.5
U.S.:
19.2
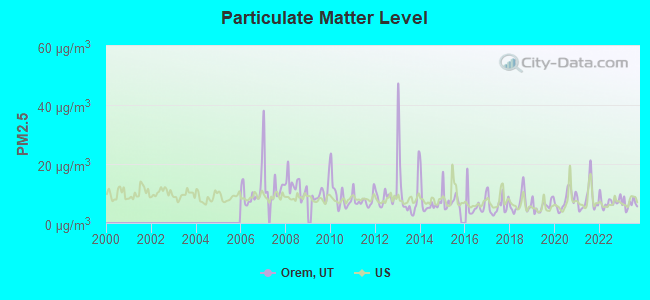
Particulate Matter (PM2.5) [µg/m3] level in 2023 was 6.47. This is better than average.Closest monitor was 3.1 miles away from the city center.
City:
6.47
U.S.:
8.11
Earthquake activity:
Orem-area historical earthquake activity is significantly above Utah state average. It is 2203% greater than the overall U.S. average.
On 8/18/1959 at 06:37:13, a magnitude 7.7 (7.7 UK, Class: Major, Intensity: VIII - XII) earthquake occurred 299.9 miles away from the city center, causing $26,000,000 total damage On 10/3/1915 at 06:52:48, a magnitude 7.6 (7.6 UK) earthquake occurred 306.0 miles away from Orem center On 10/28/1983 at 14:06:06, a magnitude 7.3 (6.2 MB, 7.3 MS, 7.0 MW) earthquake occurred 282.7 miles away from the city center, causing 2 deaths (2 shaking deaths) and 3 injuries, causing $15,000,000 total damage On 3/28/1975 at 02:31:05, a magnitude 6.2 (6.1 MB, 6.0 MS, 6.2 ML, Class: Strong, Intensity: VII - IX) earthquake occurred 125.2 miles away from Orem center On 3/18/2020 at 13:09:31, a magnitude 5.7 (5.7 MW, Depth: 7.4 mi, Class: Moderate, Intensity: VI - VII) earthquake occurred 37.2 miles away from the city center On 12/21/1932 at 06:10:09, a magnitude 7.2 (7.2 UK) earthquake occurred 363.0 miles away from Orem center Magnitude types: body-wave magnitude (MB), local magnitude (ML), surface-wave magnitude (MS), moment magnitude (MW)
Natural disasters:
The number of natural disasters in Utah County (7) is smaller than the US average (15). Major Disasters (Presidential) Declared: 3 Emergencies Declared: 1
Causes of natural disasters: Floods: 3, Fires: 2, Landslides: 2, Storms: 2, Hurricane: 1, Mudslide: 1, Other: 1 (Note: some incidents may be assigned to more than one category).
Main business address for: IMERGENT INC (SERVICES-COMPUTER INTEGRATED SYSTEMS DESIGN), Q COMM INTERNATIONAL INC (TELEPHONE COMMUNICATIONS (NO RADIO TELEPHONE)), MITY ENTERPRISES INC (OFFICE FURNITURE (NO WOOD)).
Hospitals in Orem:
FIRST CHOICE HOSPICE (1365 WEST 1250 SOUTH)
HIDDEN HOLLOW CARE CENTER (261 WEST 2000 SOUTH)
MESA VISTA, INC (394 WEST 400 NORTH)
OREM COMMUNITY HOSPITAL (Voluntary non-profit - Private, 331 NORTH 400 WEST)
TIMPANOGOS REGIONAL HOSPITAL (Proprietary, 750 WEST 800 NORTH)
TOPHAMS TINY TOTS CARE CENTER (247 NORTH 100 EAST)
Home Health Centers in Orem:
A - PLUS HOME CARE (1443 NORTH 1200 WEST)
ALPHA HOME HEALTH CARE LLC (250 WEST CENTER STREET)
ENVISION HOME HEALTH (31 SOUTH 400 WEST)
FREEDOM HOME HEALTH, LLC (1376 WEST CENTER STREET)
HEALTH WATCH PROVO, INC (1485 EAST 840 NORTH)
HOME CARE SPECIALISTS (495 SOUTH OREM BOULEVARD)
HOME HEALTH OF UTAH INC (1156 S STATE SUITE 201)
HORIZON HOME HEALTH (204 WEST 540 NORTH)
OLSTEN HEALTH SERVICES-OREM (1591 SOUTH STATE STREET)
RHEMA HEALTH SYSTEMS, INC (223 WEST 520 NORTH)
Nursing Homes in Orem:
BERKSHIRE REHAB AND COMFORT CARE (370 WEST 500 NORTH)
ORCHARD PARK CARE CENTER (740 NORTH 300 EAST)
OREM REHABILITATION AND NURSING CENTER (575 EAST 1400 SOUTH)
OREM PUBLIC LIBRARY (Operating income: $3,377,093; Location: 58 NORTH STATE STREET; 225,917 books; 206 e-books; 39,135 audio materials; 29,239 video materials; 50 local licensed databases; 39 state licensed databases; 251 print serial subscriptions; 2 electronic serial subscriptions)
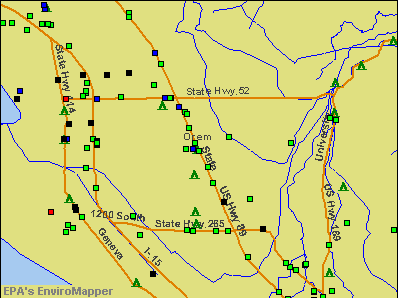
Notable locations in Orem: Orem City Water Reclamation Facility (A), Riverside Plaza (B), Parkway Center (C), Orem Plaza Center Street (D), Orem Fire Station 2 (E), Orem Fire Station 3 (F), Orem Fire Station 1 (G). Display/hide their locations on the map
Churches in Orem include: The Church of Jesus Christ of Latter Day Saints (A), Evangelical Free Church (B), Grace Baptist Church (C), Orem Community Church (D). Display/hide their locations on the map
Tourist attractions: Uvsc Woodbury Art Museum (Univ Mall North # 250) (1), Orem City Golf Course-Cascade Golf Center (Amusement & Theme Parks; 1313 East 800 North) (2), Nickelcade (Amusement & Theme Parks; 170 South State Street) (3), Middle America Tours (Tours & Charters; 289 North 1000 East) (4). Display/hide their approximate locations on the map
Hotels: LA Quinta (521 West University Parkway) (1), Hampton Inn & Suites Provo/Orem (851 West 1250 South) (2), L & L Motel (963 North State Street) (3), Laquinta Inn (1100 West 780 North) (4). Display/hide their approximate locations on the map
Courts: Utah State - Courts- Fourth Judicial District Court- Orem Department (97 East Center Street) (1), Utah State - Courts- Juvenile Court- Probation Offices (235 Mountainlands Drive) (2), Utah State - Orem- Courts- Juvenile Court (99 East Center Street) (3). Display/hide their approximate locations on the map
Birthplace of: LaVell Edwards - Football player and coach, Ben Cahoon - Player of and football, Bert McCracken - Male singer, Gary Crowton - Football coach, Rex D. Pinegar - Mormon missionary, Tai Wesley - Basketball player, Danny Johnson - College basketball player (Idaho State Bengals), Erik Freeman - College football player (BYU Cougars), Erin Thorn - WNBA player (New York Liberty, born: May 19, 1981), Jeff Gardner - College basketball player (Idaho State Bengals).
Utah County has a predicted average indoor radon screening level between 2 and 4 pCi/L (pico curies per liter) - Moderate Potential
Drinking water stations with addresses in Orem and their reported violations in the past:
OREM CITY WATER SYSTEM (Population served: 94,025, Purch surface water):
Past monitoring violations:
9 regular monitoring violations
FRENCH MEADOWS SOUTH SHORE (Serves CA,Population served: 500, Groundwater):
ZIP TRAVEL CENTER (Address: 1441 S 550 E , Serves AZ,Population served: 200, Groundwater):
Past monitoring violations:
One regular monitoring violation
ASPEN COVE ASSOCIATION (Population served: 151, Groundwater):
Past health violations:
MCL, Monthly (TCR) - In AUG-2013, Contaminant: Coliform. Follow-up actions: St Formal NOV issued (OCT-06-2013), St Public Notif requested (OCT-06-2013)
MCL, Monthly (TCR) - In AUG-2009, Contaminant: Coliform. Follow-up actions: St Compliance achieved (SEP-29-2009), St Public Notif requested (OCT-02-2009), St Formal NOV issued (OCT-02-2009)
Past monitoring violations:
3 routine major monitoring violations
DEER CREEK PARK (Population served: 150, Groundwater):
Past monitoring violations:
Failure To Address Deficiency - In FEB-28-2013, Contaminant: GROUNDWATER RULE. Follow-up actions: St Formal NOV issued (JAN-30-2014), St Public Notif requested (JAN-30-2014)
Monitoring, Repeat Major (TCR) - In OCT-2007, Contaminant: Coliform (TCR). Follow-up actions: St Compliance achieved (JAN-01-2010)
6 routine major monitoring violations
One regular monitoring violation
CHESTER PARK WATER SYSTEM (Population served: 120, Groundwater):
Past health violations:
MCL, Monthly (TCR) - In OCT-2012, Contaminant: Coliform. Follow-up actions: St Formal NOV issued (DEC-08-2012), St Public Notif requested (DEC-08-2012)
MCL, Average - Between APR-2012 and JUN-2012, Contaminant: Arsenic
MCL, Monthly (TCR) - In AUG-2011, Contaminant: Coliform. Follow-up actions: St Public Notif requested (OCT-08-2011), St AO (w/o penalty) issued (OCT-25-2011), St Public Notif received (NOV-12-2011)
MCL, Monthly (TCR) - In OCT-2010, Contaminant: Coliform. Follow-up actions: St Public Notif requested (DEC-10-2010), St Formal NOV issued (DEC-10-2010), St AO (w/o penalty) issued (OCT-25-2011)
MCL, Monthly (TCR) - In SEP-2010, Contaminant: Coliform. Follow-up actions: St Public Notif requested (NOV-06-2010), St Formal NOV issued (NOV-06-2010), St AO (w/o penalty) issued (OCT-25-2011)
MCL, Monthly (TCR) - In JUN-2007, Contaminant: Coliform. Follow-up actions: St Violation/Reminder Notice (JUL-26-2007), St Public Notif requested (JUL-26-2007), St Compliance achieved (JAN-01-2008), Fed FAO issued (JUN-29-2009), Fed Compliance achieved (NOV-22-2010)
MCL, Monthly (TCR) - In MAR-2007, Contaminant: Coliform. Follow-up actions: St Violation/Reminder Notice (APR-23-2007), St Public Notif requested (APR-23-2007), St Compliance achieved (JAN-01-2008), Fed FAO issued (JUN-29-2009), Fed Compliance achieved (NOV-22-2010)
Past monitoring violations:
Monitoring, Source Water (GWR) - In SEP-01-2010, Contaminant: E. COLI. Follow-up actions: St Compliance achieved (DEC-08-2010), St Public Notif requested (DEC-11-2010), St Formal NOV issued (DEC-11-2010)
Monitoring, Repeat Major (TCR) - In AUG-2007, Contaminant: Coliform (TCR). Follow-up actions: St Compliance achieved (JAN-01-2008), Fed FAO issued (JUN-29-2009), Fed Compliance achieved (NOV-22-2010)
Follow-up Or Routine LCR Tap M/R - In JAN-01-2006, Contaminant: Lead and Copper Rule. Follow-up actions: St Violation/Reminder Notice (FEB-15-2006), St Compliance achieved (FEB-15-2006), St Public Notif requested (FEB-15-2006), Fed FAO issued (JUN-29-2009), Fed Compliance achieved (NOV-22-2010), St Compliance achieved (2 times from FEB-14-2011 to MAY-02-2011)
Monitoring, Repeat Major (TCR) - In SEP-2005, Contaminant: Coliform (TCR). Follow-up actions: St Violation/Reminder Notice (NOV-10-2005), St Public Notif requested (2 times from NOV-10-2005 to NOV-10-2005), St Violation/Reminder Notice (NOV-10-2005), Fed FAO issued (JUN-29-2009), St Compliance achieved (JAN-01-2010), Fed Compliance achieved (NOV-22-2010)
Follow-up Or Routine LCR Tap M/R - In JAN-01-2003, Contaminant: Lead and Copper Rule. Follow-up actions: Fed FAO issued (JUN-29-2009), Fed Compliance achieved (NOV-22-2010)
2 routine major monitoring violations
3 minor monitoring violations
6 regular monitoring violations
Drinking water stations with addresses in Orem that have no violations reported:
FRENCH MEADOWS NORTH SHORE (Serves CA, Population served: 1,000,Primary Water Source Type: Groundwater)
WHITNEY PORTAL (Serves CA, Population served: 500,Primary Water Source Type: Groundwater)
ROCK CREEK LAKE CAMPGROUND (Serves CA, Population served: 210,Primary Water Source Type: Groundwater)
ROCK CREEK LAKE BOAT DOCK & GROUP CAMP (Serves CA, Population served: 50,Primary Water Source Type: Groundwater)
LONE PINE CAMPGROUND (Serves CA, Population served: 45,Primary Water Source Type: Groundwater)
Average household size:
This city:
3.4 people
Utah:
3.1 people
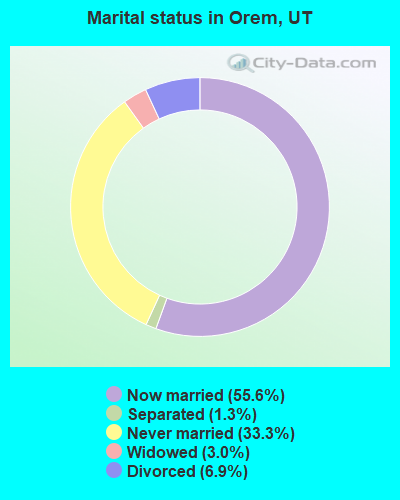
Percentage of family households:
This city:
78.9%
Whole state:
75.2%
Percentage of households with unmarried partners:
This city:
2.3%
Whole state:
4.6%
Likely homosexual households (counted as self-reported same-sex unmarried-partner households)
Lesbian couples: 0.2% of all households
Gay men: 0.2% of all households
People in group quarters in Orem in 2010:
1,266 people in college/university student housing
301 people in nursing facilities/skilled-nursing facilities
84 people in residential treatment centers for juveniles (non-correctional)
51 people in workers' group living quarters and job corps centers
40 people in mental (psychiatric) hospitals and psychiatric units in other hospitals
31 people in correctional facilities intended for juveniles
11 people in group homes intended for adults
5 people in group homes for juveniles (non-correctional)
People in group quarters in Orem in 2000:
301 people in nursing homes
214 people in residential treatment centers for emotionally disturbed children
70 people in other nonhousehold living situations
52 people in schools, hospitals, or wards for the intellectually disabled
43 people in unknown juvenile institutions
34 people in other noninstitutional group quarters
17 people in other group homes
14 people in training schools for juvenile delinquents
5 people in homes for the mentally retarded
Banks with most branches in Orem (2011 data):
Wells Fargo Bank, National Association: University Mall Branch, Provo Satellite Branch, Geneva Branch, Albertson's North Orem Branch, Orem Branch. Info updated 2011/04/05: Bank assets: $1,161,490.0 mil, Deposits: $905,653.0 mil, headquarters in Sioux Falls, SD, positive income, 6395 total offices, Holding Company: Wells Fargo & Company
Zions First National Bank: Zmc Orem Branch, Orem Branch, Wasatch Branch. Info updated 2006/11/03: Bank assets: $17,531.3 mil, Deposits: $14,905.3 mil, headquarters in Salt Lake City, UT, positive income, Commercial Lending Specialization, 151 total offices, Holding Company: Zions Bancorporation
U.S. Bank National Association: Orem Branch at 1220 South State Street, branch established on 2011/01/31; Orem Smith's Branch at 45 South State Street, branch established on 2009/02/17. Info updated 2012/01/30: Bank assets: $330,470.8 mil, Deposits: $236,091.5 mil, headquarters in Cincinnati, OH, positive income, 3121 total offices, Holding Company: U.S. Bancorp
AmericanWest Bank: North Orem Branch at 1020 East 800 North, branch established on 2000/10/27; Orem Branch at 1534 South State Street, branch established on 1986/10/15. Info updated 2011/12/12: Bank assets: $2,274.6 mil, Deposits: $1,889.1 mil, headquarters in Spokane, WA, positive income, Commercial Lending Specialization, 76 total offices, Holding Company: Skbhc Holdings Llc
KeyBank National Association: Orem Branch at 185 South State Street, branch established on 1957/12/30; Parkway Branch at 1245 South 800 East, branch established on 2001/07/09. Info updated 2008/03/03: Bank assets: $86,198.8 mil, Deposits: $64,214.8 mil, headquarters in Cleveland, OH, positive income, Commercial Lending Specialization, 1067 total offices, Holding Company: Keycorp
JPMorgan Chase Bank, National Association: Orem Banking Branch at 1115 South 800 East, branch established on 2002/12/09. Info updated 2011/11/10: Bank assets: $1,811,678.0 mil, Deposits: $1,190,738.0 mil, headquarters in Columbus, OH, positive income, International Specialization, 5577 total offices, Holding Company: Jpmorgan Chase & Co.
Central Bank: Orem Branch at 415 North State St, branch established on 1982/10/01. Info updated 2006/11/03: Bank assets: $662.1 mil, Deposits: $508.4 mil, headquarters in Springville, UT, positive income, Commercial Lending Specialization, 10 total offices, Holding Company: Central Bancorporation
Rock Canyon Bank: at 1376 North State Street, branch established on 1991/12/09. Info updated 2011/04/14: Bank assets: $129.1 mil, Deposits: $113.3 mil, local headquarters, positive income, Commercial Lending Specialization, 2 total offices, Holding Company: Community Bancorporation
Bank of American Fork: Orem Branch at 1344 South 800 East, Suite 2, branch established on 1993/10/04. Info updated 2006/11/03: Bank assets: $890.2 mil, Deposits: $781.2 mil, headquarters in American Fork, UT, positive income, Commercial Lending Specialization, 13 total offices, Holding Company: People's Utah Bancorp
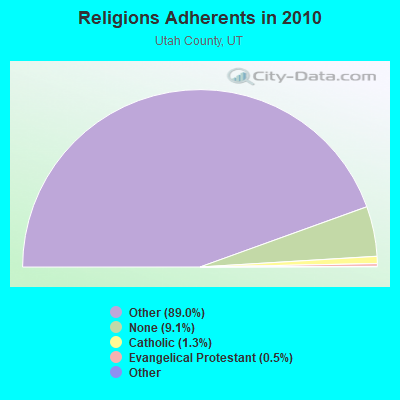
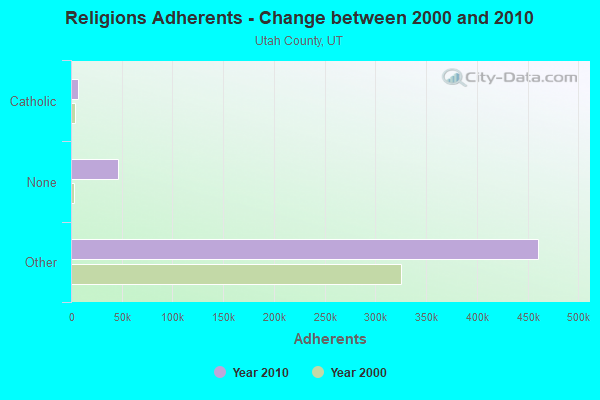
Religion statistics for Orem, UT (based on Utah County data)
Religion
Adherents
Congregations
Other
459,847
1,303
Catholic
6,792
4
Evangelical Protestant
2,540
26
Mainline Protestant
423
6
Black Protestant
211
1
None
46,751
-
Source: Clifford Grammich, Kirk Hadaway, Richard Houseal, Dale E.Jones, Alexei Krindatch, Richie Stanley and Richard H.Taylor. 2012. 2010 U.S.Religion Census: Religious Congregations & Membership Study. Association of Statisticians of American Religious Bodies. Jones, Dale E., et al. 2002. Congregations and Membership in the United States 2000. Nashville, TN: Glenmary Research Center. Graphs represent county-level data
2002 - 2018 National Fire Incident Reporting System (NFIRS) incidents
According to the data from the years 2002 - 2018 the average number of fires per year is 138. The highest number of reported fires - 239 took place in 2007, and the least - 1 in 2010. The data has an increasing trend.
When looking into fire subcategories, the most reports belonged to: Structure Fires (39.5%), and Outside Fires (30.9%).
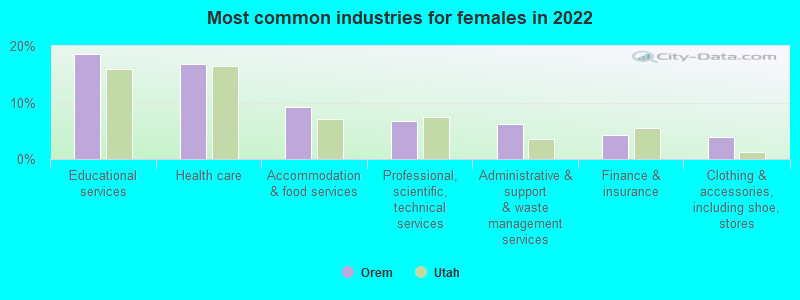
#2 on the list of "Top 101 cities with largest percentage of females in industries: administrative and support and waste management services (population 50,000+)"
#3 on the list of "Top 101 cities with the smallest percentage of unmarried partner households (population 50,000+)"
#3 on the list of "Top 101 cities with the lowest number of assaults per 100,000 residents (population 50,000+)"
#5 on the list of "Top 101 cities with the smallest percentage of likely homosexual households (counted as self-reported same-sex unmarried-partner households) (population 50,000+)"
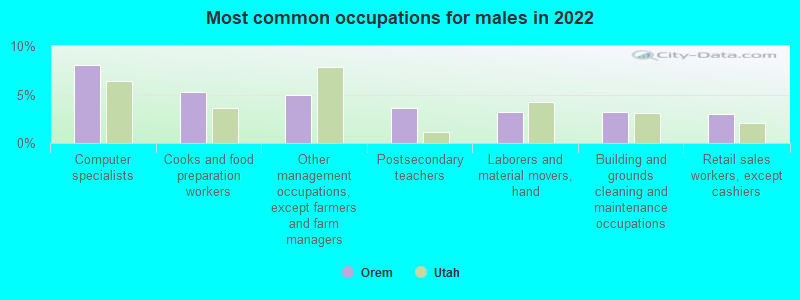
#13 on the list of "Top 101 cities with largest percentage of males in occupations: healthcare support occupations (population 50,000+)"
#14 on the list of "Top 101 cities with largest percentage of males in occupations: arts, design, entertainment, sports, and media occupations (population 50,000+)"
#20 on the list of "Top 101 cities with the lowest number of arson incidents per 100,000 residents (population 50,000+)"
#21 on the list of "Top 101 cities with the most cars per house, population 50,000+"
#23 on the list of "Top 100 highest located cities (pop. 50,000+)"
#27 on the list of "Top 101 cities with the smallest percentage of elementary and middle school students in private schools (5,000+ students)"
#31 on the list of "Top 100 cities with youngest residents (pop. 50,000+)"
#32 on the list of "Top 101 cities with the lowest number of burglaries per 100,000 residents (population 50,000+)"
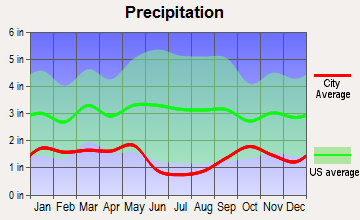
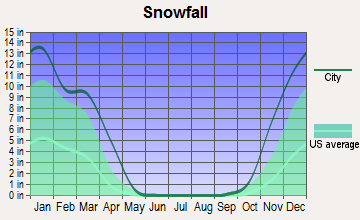
#38 on the list of "Top 101 cities with the smallest precipitation differences during a year (population 50,000+)"
#39 on the list of "Top 101 cities with largest percentage of females in occupations: healthcare support occupations (population 50,000+)"
#45 on the list of "Top 101 cities with largest percentage of males in industries: information (population 50,000+)"
#45 on the list of "Top 101 cities with the lowest number of police officers per 1000 residents (population 50,000+)"
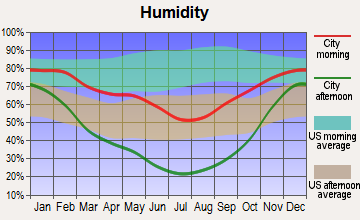
#46 on the list of "Top 101 cities with the lowest minimum monthly morning or afternoon humidity (population 50,000+)"
#46 on the list of "Top 101 cities with largest percentage of males in industries: administrative and support and waste management services (population 50,000+)"
#59 on the list of "Top 101 cities with the lowest city-data.com crime index (population 50,000+)"
#60 on the list of "Top 100 cities with biggest houses (pop. 50,000+)"
#8 (84097) on the list of "Top 101 zip codes with the largest charity contributions deductions as a percentage of AGI in 2012 (pop 5,000+)"
#10 (84097) on the list of "Top 101 zip codes with the largest percentage of Danish first ancestries (pop 5,000+)"
#21 (84097) on the list of "Top 101 zip codes with the largest percentage of English first ancestries (pop 5,000+)"
#28 (84097) on the list of "Top 101 zip codes with the largest percentage of Scottish first ancestries (pop 5,000+)"
#38 (84097) on the list of "Top 101 zip codes with the most Internet business establishments in 2005"
#77 (84057) on the list of "Top 101 zip codes with the largest percentage of Welsh first ancestries (pop 5,000+)"
#1 on the list of "Top 101 counties with the lowest percentage of residents that smoked 100+ cigarettes in their lives"
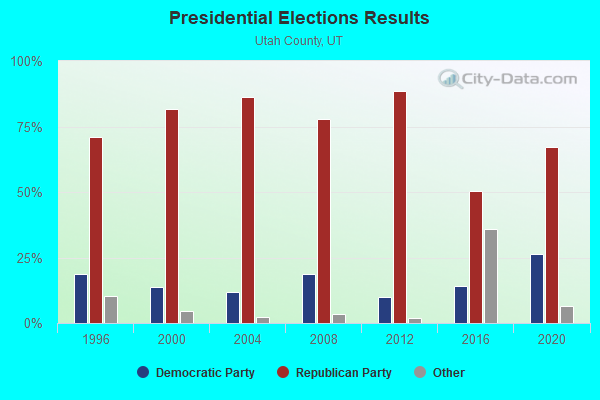
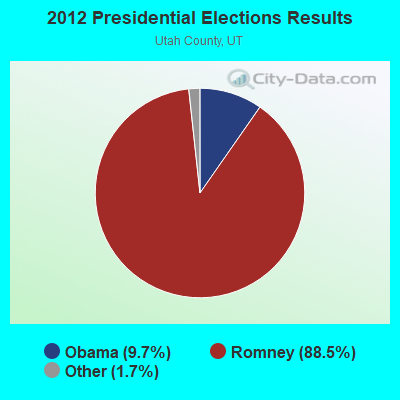
#1 on the list of "Top 101 counties with highest percentage of residents voting for Romney (Republican) in the 2012 Presidential Election (pop. 50,000+)"
#1 on the list of "Top 101 counties with the highest number of births per 1000 residents 2007-2013"
#2 on the list of "Top 101 counties with the most Other adherents"
#2 on the list of "Top 101 counties with the most Other congregations"


 Recent articles from our blog. Our writers, many of them Ph.D. graduates or candidates, create easy-to-read articles on a wide variety of topics.

 (342.4 miles


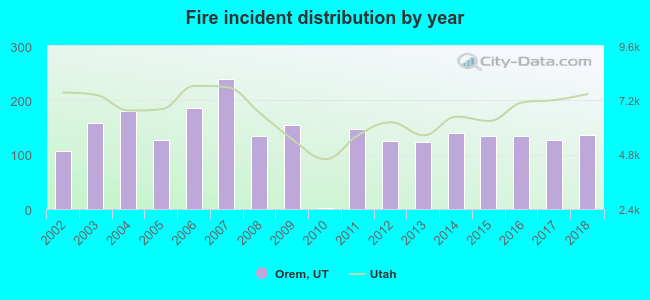 According to the data from the years 2002 - 2018 the average number of fires per year is 138. The highest number of reported fires - 239 took place in 2007, and the least - 1 in 2010. The data has an increasing trend.
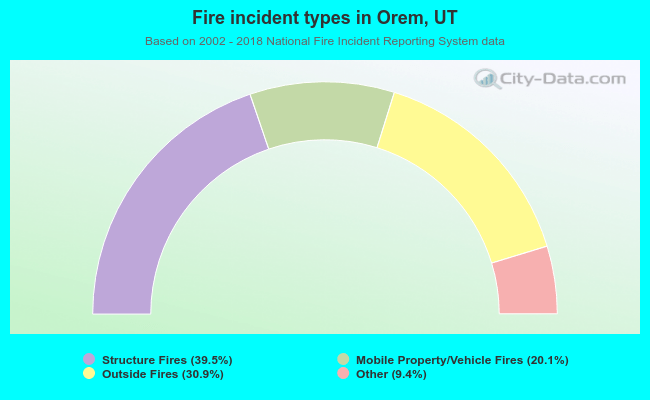 When looking into fire subcategories, the most reports belonged to: Structure Fires (39.5%), and Outside Fires (30.9%).