Lindon, Utah Submit your own pictures of this city and show them to the world
OSM Map
General Map
Google Map
MSN Map
OSM Map
General Map
Google Map
MSN Map
OSM Map
General Map
Google Map
MSN Map
OSM Map
General Map
Google Map
MSN Map
Please wait while loading the map...
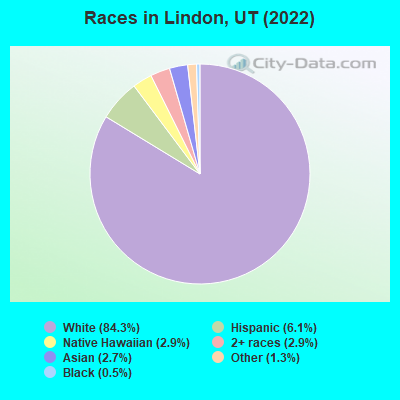
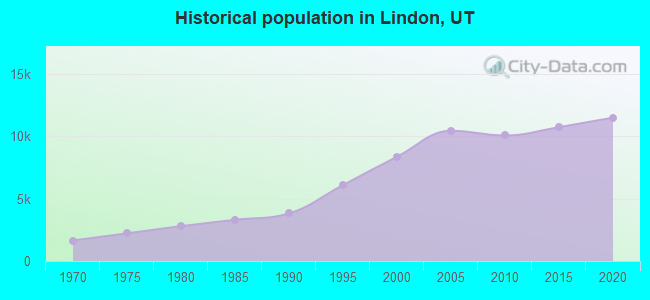
Population in 2022: 11,704 (100% urban, 0% rural). Population change since 2000: +39.9%Males: 6,289 Females: 5,415
March 2022 cost of living index in Lindon: 89.1 (less than average, U.S. average is 100) Percentage of residents living in poverty in 2022: 5.7%for White Non-Hispanic residents , 24.0% for Black residents , 4.5% for Hispanic or Latino residents , 76.2% for other race residents )
Profiles of local businesses
Business Search - 14 Million verified businesses
Data:
Median household income ($)
Median household income (% change since 2000)
Household income diversity
Ratio of average income to average house value (%)
Ratio of average income to average rent
Median household income ($) - White
Median household income ($) - Black or African American
Median household income ($) - Asian
Median household income ($) - Hispanic or Latino
Median household income ($) - American Indian and Alaska Native
Median household income ($) - Multirace
Median household income ($) - Other Race
Median household income for houses/condos with a mortgage ($)
Median household income for apartments without a mortgage ($)
Races - White alone (%)
Races - White alone (% change since 2000)
Races - Black alone (%)
Races - Black alone (% change since 2000)
Races - American Indian alone (%)
Races - American Indian alone (% change since 2000)
Races - Asian alone (%)
Races - Asian alone (% change since 2000)
Races - Hispanic (%)
Races - Hispanic (% change since 2000)
Races - Native Hawaiian and Other Pacific Islander alone (%)
Races - Native Hawaiian and Other Pacific Islander alone (% change since 2000)
Races - Two or more races (%)
Races - Two or more races (% change since 2000)
Races - Other race alone (%)
Races - Other race alone (% change since 2000)
Racial diversity
Unemployment (%)
Unemployment (% change since 2000)
Unemployment (%) - White
Unemployment (%) - Black or African American
Unemployment (%) - Asian
Unemployment (%) - Hispanic or Latino
Unemployment (%) - American Indian and Alaska Native
Unemployment (%) - Multirace
Unemployment (%) - Other Race
Population density (people per square mile)
Population - Males (%)
Population - Females (%)
Population - Males (%) - White
Population - Males (%) - Black or African American
Population - Males (%) - Asian
Population - Males (%) - Hispanic or Latino
Population - Males (%) - American Indian and Alaska Native
Population - Males (%) - Multirace
Population - Males (%) - Other Race
Population - Females (%) - White
Population - Females (%) - Black or African American
Population - Females (%) - Asian
Population - Females (%) - Hispanic or Latino
Population - Females (%) - American Indian and Alaska Native
Population - Females (%) - Multirace
Population - Females (%) - Other Race
Coronavirus confirmed cases (Apr 27, 2024)
Deaths caused by coronavirus (Apr 27, 2024)
Coronavirus confirmed cases (per 100k population) (Apr 27, 2024)
Deaths caused by coronavirus (per 100k population) (Apr 27, 2024)
Daily increase in number of cases (Apr 27, 2024)
Weekly increase in number of cases (Apr 27, 2024)
Cases doubled (in days) (Apr 27, 2024)
Hospitalized patients (Apr 18, 2022)
Negative test results (Apr 18, 2022)
Total test results (Apr 18, 2022)
COVID Vaccine doses distributed (per 100k population) (Sep 19, 2023)
COVID Vaccine doses administered (per 100k population) (Sep 19, 2023)
COVID Vaccine doses distributed (Sep 19, 2023)
COVID Vaccine doses administered (Sep 19, 2023)
Likely homosexual households (%)
Likely homosexual households (% change since 2000)
Likely homosexual households - Lesbian couples (%)
Likely homosexual households - Lesbian couples (% change since 2000)
Likely homosexual households - Gay men (%)
Likely homosexual households - Gay men (% change since 2000)
Cost of living index
Median gross rent ($)
Median contract rent ($)
Median monthly housing costs ($)
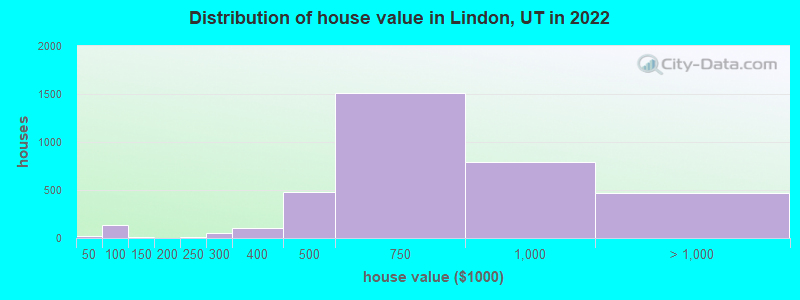
Median house or condo value ($)
Median house or condo value ($ change since 2000)
Mean house or condo value by units in structure - 1, detached ($)
Mean house or condo value by units in structure - 1, attached ($)
Mean house or condo value by units in structure - 2 ($)
Mean house or condo value by units in structure by units in structure - 3 or 4 ($)
Mean house or condo value by units in structure - 5 or more ($)
Mean house or condo value by units in structure - Boat, RV, van, etc. ($)
Mean house or condo value by units in structure - Mobile home ($)
Median house or condo value ($) - White
Median house or condo value ($) - Black or African American
Median house or condo value ($) - Asian
Median house or condo value ($) - Hispanic or Latino
Median house or condo value ($) - American Indian and Alaska Native
Median house or condo value ($) - Multirace
Median house or condo value ($) - Other Race
Median resident age
Resident age diversity
Median resident age - Males
Median resident age - Females
Median resident age - White
Median resident age - Black or African American
Median resident age - Asian
Median resident age - Hispanic or Latino
Median resident age - American Indian and Alaska Native
Median resident age - Multirace
Median resident age - Other Race
Median resident age - Males - White
Median resident age - Males - Black or African American
Median resident age - Males - Asian
Median resident age - Males - Hispanic or Latino
Median resident age - Males - American Indian and Alaska Native
Median resident age - Males - Multirace
Median resident age - Males - Other Race
Median resident age - Females - White
Median resident age - Females - Black or African American
Median resident age - Females - Asian
Median resident age - Females - Hispanic or Latino
Median resident age - Females - American Indian and Alaska Native
Median resident age - Females - Multirace
Median resident age - Females - Other Race
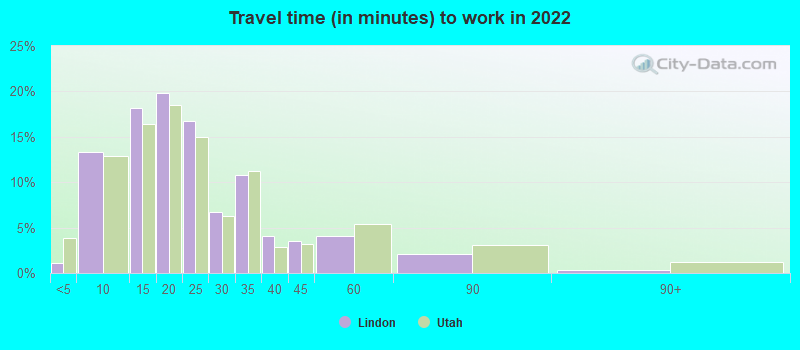
Commute - mean travel time to work (minutes)
Travel time to work - Less than 5 minutes (%)
Travel time to work - Less than 5 minutes (% change since 2000)
Travel time to work - 5 to 9 minutes (%)
Travel time to work - 5 to 9 minutes (% change since 2000)
Travel time to work - 10 to 19 minutes (%)
Travel time to work - 10 to 19 minutes (% change since 2000)
Travel time to work - 20 to 29 minutes (%)
Travel time to work - 20 to 29 minutes (% change since 2000)
Travel time to work - 30 to 39 minutes (%)
Travel time to work - 30 to 39 minutes (% change since 2000)
Travel time to work - 40 to 59 minutes (%)
Travel time to work - 40 to 59 minutes (% change since 2000)
Travel time to work - 60 to 89 minutes (%)
Travel time to work - 60 to 89 minutes (% change since 2000)
Travel time to work - 90 or more minutes (%)
Travel time to work - 90 or more minutes (% change since 2000)
Marital status - Never married (%)
Marital status - Now married (%)
Marital status - Separated (%)
Marital status - Widowed (%)
Marital status - Divorced (%)
Median family income ($)
Median family income (% change since 2000)
Median non-family income ($)
Median non-family income (% change since 2000)
Median per capita income ($)
Median per capita income (% change since 2000)
Median family income ($) - White
Median family income ($) - Black or African American
Median family income ($) - Asian
Median family income ($) - Hispanic or Latino
Median family income ($) - American Indian and Alaska Native
Median family income ($) - Multirace
Median family income ($) - Other Race
Median year house/condo built
Median year apartment built
Year house built - Built 2005 or later (%)
Year house built - Built 2000 to 2004 (%)
Year house built - Built 1990 to 1999 (%)
Year house built - Built 1980 to 1989 (%)
Year house built - Built 1970 to 1979 (%)
Year house built - Built 1960 to 1969 (%)
Year house built - Built 1950 to 1959 (%)
Year house built - Built 1940 to 1949 (%)
Year house built - Built 1939 or earlier (%)
Average household size
Household density (households per square mile)
Average household size - White
Average household size - Black or African American
Average household size - Asian
Average household size - Hispanic or Latino
Average household size - American Indian and Alaska Native
Average household size - Multirace
Average household size - Other Race
Occupied housing units (%)
Vacant housing units (%)
Owner occupied housing units (%)
Renter occupied housing units (%)
Vacancy status - For rent (%)
Vacancy status - For sale only (%)
Vacancy status - Rented or sold, not occupied (%)
Vacancy status - For seasonal, recreational, or occasional use (%)
Vacancy status - For migrant workers (%)
Vacancy status - Other vacant (%)
Residents with income below the poverty level (%)
Residents with income below 50% of the poverty level (%)
Children below poverty level (%)
Poor families by family type - Married-couple family (%)
Poor families by family type - Male, no wife present (%)
Poor families by family type - Female, no husband present (%)
Poverty status for native-born residents (%)
Poverty status for foreign-born residents (%)
Poverty among high school graduates not in families (%)
Poverty among people who did not graduate high school not in families (%)
Residents with income below the poverty level (%) - White
Residents with income below the poverty level (%) - Black or African American
Residents with income below the poverty level (%) - Asian
Residents with income below the poverty level (%) - Hispanic or Latino
Residents with income below the poverty level (%) - American Indian and Alaska Native
Residents with income below the poverty level (%) - Multirace
Residents with income below the poverty level (%) - Other Race
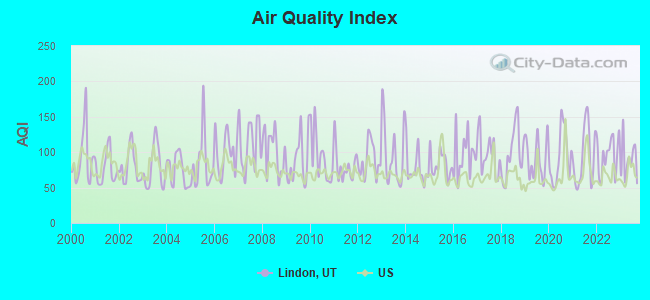
Air pollution - Air Quality Index (AQI)
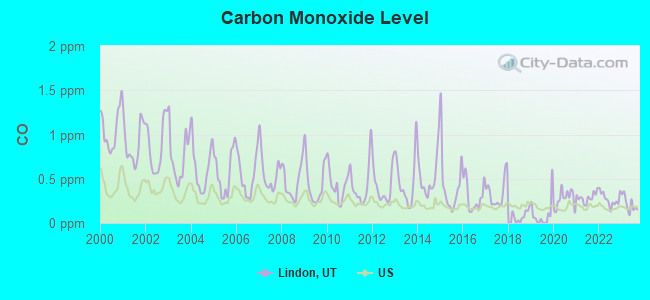
Air pollution - CO
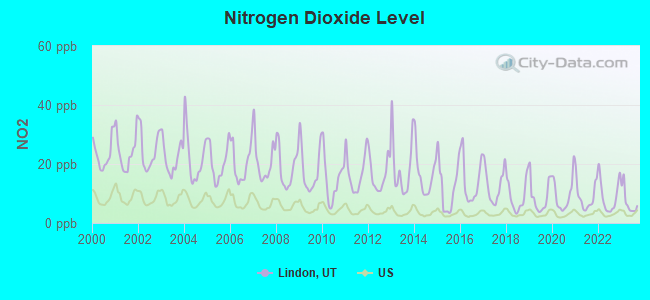
Air pollution - NO2
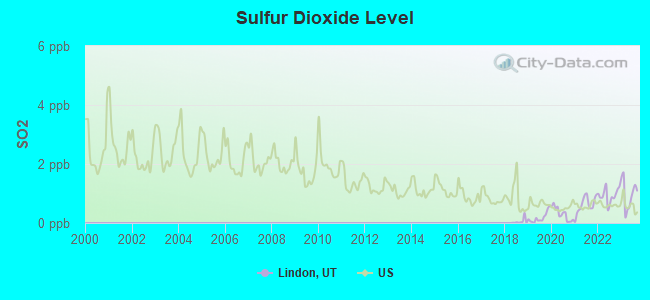
Air pollution - SO2
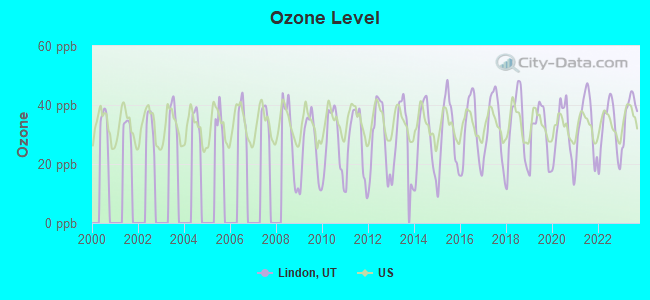
Air pollution - Ozone
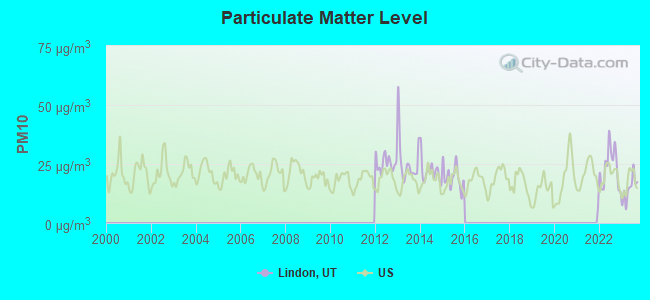
Air pollution - PM10
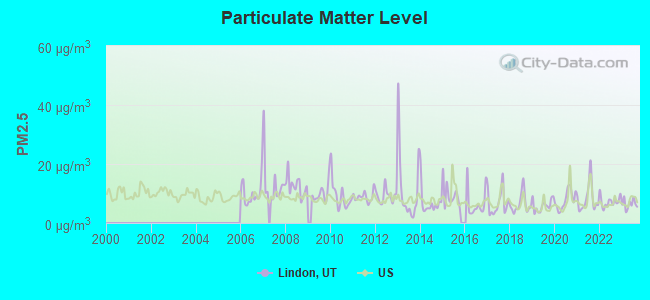
Air pollution - PM25
Air pollution - Pb
Crime - Murders per 100,000 population
Crime - Rapes per 100,000 population
Crime - Robberies per 100,000 population
Crime - Assaults per 100,000 population
Crime - Burglaries per 100,000 population
Crime - Thefts per 100,000 population
Crime - Auto thefts per 100,000 population
Crime - Arson per 100,000 population
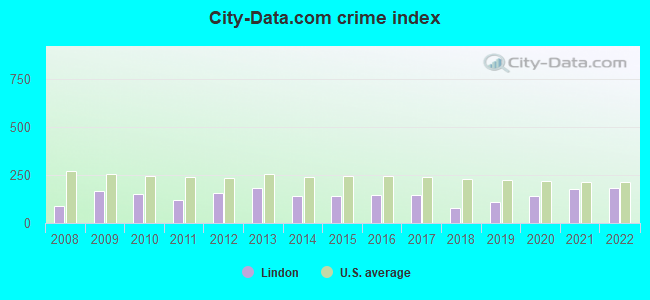
Crime - City-data.com crime index
Crime - Violent crime index
Crime - Property crime index
Crime - Murders per 100,000 population (5 year average)
Crime - Rapes per 100,000 population (5 year average)
Crime - Robberies per 100,000 population (5 year average)
Crime - Assaults per 100,000 population (5 year average)
Crime - Burglaries per 100,000 population (5 year average)
Crime - Thefts per 100,000 population (5 year average)
Crime - Auto thefts per 100,000 population (5 year average)
Crime - Arson per 100,000 population (5 year average)
Crime - City-data.com crime index (5 year average)
Crime - Violent crime index (5 year average)
Crime - Property crime index (5 year average)
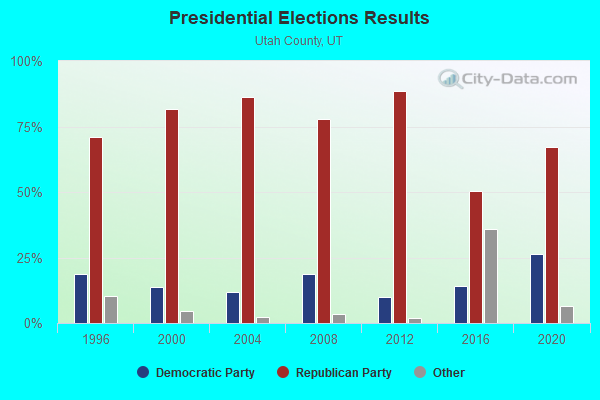
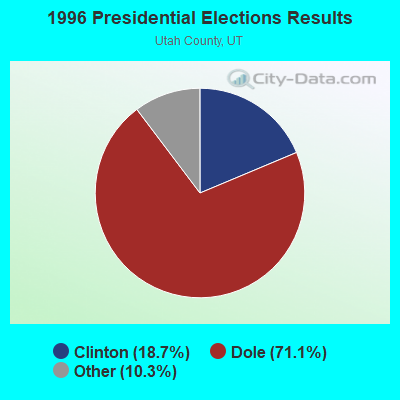
1996 Presidential Elections Results (%) - Democratic Party (Clinton)
1996 Presidential Elections Results (%) - Republican Party (Dole)
1996 Presidential Elections Results (%) - Other
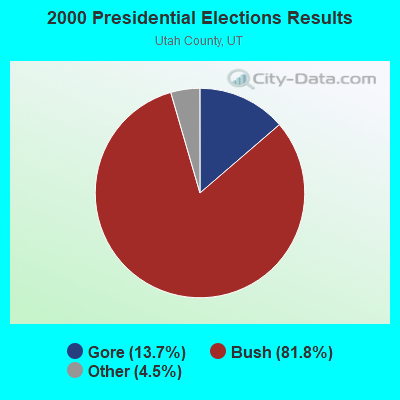
2000 Presidential Elections Results (%) - Democratic Party (Gore)
2000 Presidential Elections Results (%) - Republican Party (Bush)
2000 Presidential Elections Results (%) - Other
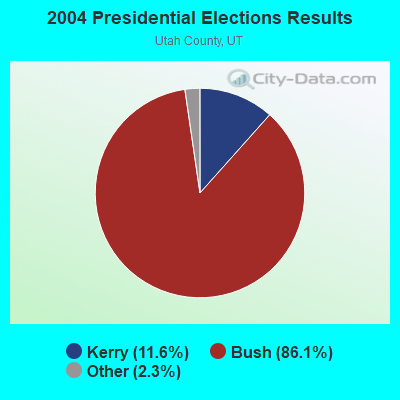
2004 Presidential Elections Results (%) - Democratic Party (Kerry)
2004 Presidential Elections Results (%) - Republican Party (Bush)
2004 Presidential Elections Results (%) - Other
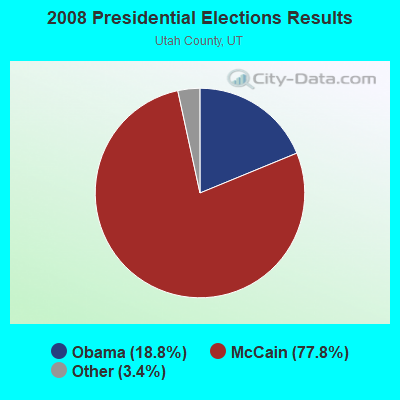
2008 Presidential Elections Results (%) - Democratic Party (Obama)
2008 Presidential Elections Results (%) - Republican Party (McCain)
2008 Presidential Elections Results (%) - Other
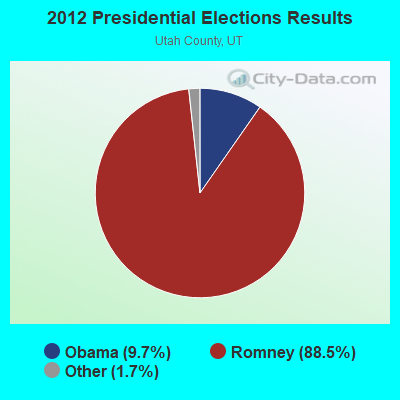
2012 Presidential Elections Results (%) - Democratic Party (Obama)
2012 Presidential Elections Results (%) - Republican Party (Romney)
2012 Presidential Elections Results (%) - Other
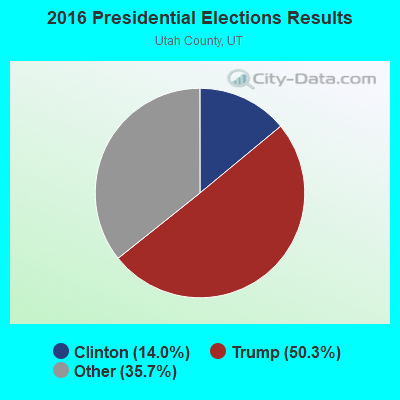
2016 Presidential Elections Results (%) - Democratic Party (Clinton)
2016 Presidential Elections Results (%) - Republican Party (Trump)
2016 Presidential Elections Results (%) - Other
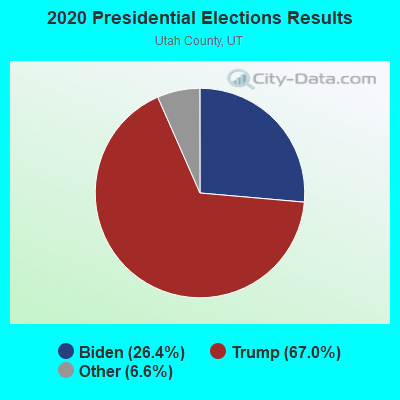
2020 Presidential Elections Results (%) - Democratic Party (Biden)
2020 Presidential Elections Results (%) - Republican Party (Trump)
2020 Presidential Elections Results (%) - Other
Ancestries Reported - Arab (%)
Ancestries Reported - Czech (%)
Ancestries Reported - Danish (%)
Ancestries Reported - Dutch (%)
Ancestries Reported - English (%)
Ancestries Reported - French (%)
Ancestries Reported - French Canadian (%)
Ancestries Reported - German (%)
Ancestries Reported - Greek (%)
Ancestries Reported - Hungarian (%)
Ancestries Reported - Irish (%)
Ancestries Reported - Italian (%)
Ancestries Reported - Lithuanian (%)
Ancestries Reported - Norwegian (%)
Ancestries Reported - Polish (%)
Ancestries Reported - Portuguese (%)
Ancestries Reported - Russian (%)
Ancestries Reported - Scotch-Irish (%)
Ancestries Reported - Scottish (%)
Ancestries Reported - Slovak (%)
Ancestries Reported - Subsaharan African (%)
Ancestries Reported - Swedish (%)
Ancestries Reported - Swiss (%)
Ancestries Reported - Ukrainian (%)
Ancestries Reported - United States (%)
Ancestries Reported - Welsh (%)
Ancestries Reported - West Indian (%)
Ancestries Reported - Other (%)
Educational Attainment - No schooling completed (%)
Educational Attainment - Less than high school (%)
Educational Attainment - High school or equivalent (%)
Educational Attainment - Less than 1 year of college (%)
Educational Attainment - 1 or more years of college (%)
Educational Attainment - Associate degree (%)
Educational Attainment - Bachelor's degree (%)
Educational Attainment - Master's degree (%)
Educational Attainment - Professional school degree (%)
Educational Attainment - Doctorate degree (%)
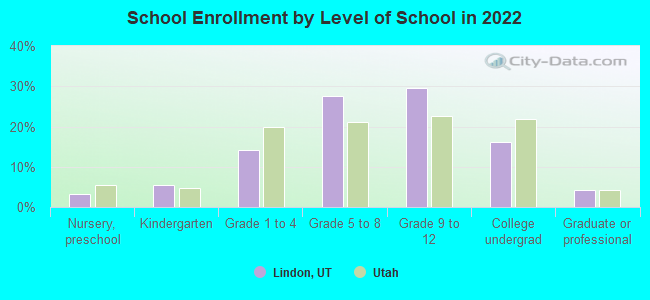
School Enrollment - Nursery, preschool (%)
School Enrollment - Kindergarten (%)
School Enrollment - Grade 1 to 4 (%)
School Enrollment - Grade 5 to 8 (%)
School Enrollment - Grade 9 to 12 (%)
School Enrollment - College undergrad (%)
School Enrollment - Graduate or professional (%)
School Enrollment - Not enrolled in school (%)
School enrollment - Public schools (%)
School enrollment - Private schools (%)
School enrollment - Not enrolled (%)
Median number of rooms in houses and condos
Median number of rooms in apartments
Housing units lacking complete plumbing facilities (%)
Housing units lacking complete kitchen facilities (%)
Density of houses
Urban houses (%)
Rural houses (%)
Households with people 60 years and over (%)
Households with people 65 years and over (%)
Households with people 75 years and over (%)
Households with one or more nonrelatives (%)
Households with no nonrelatives (%)
Population in households (%)
Family households (%)
Nonfamily households (%)
Population in families (%)
Family households with own children (%)
Median number of bedrooms in owner occupied houses
Mean number of bedrooms in owner occupied houses
Median number of bedrooms in renter occupied houses
Mean number of bedrooms in renter occupied houses
Median number of vehichles in owner occupied houses
Mean number of vehichles in owner occupied houses
Median number of vehichles in renter occupied houses
Mean number of vehichles in renter occupied houses
Mortgage status - with mortgage (%)
Mortgage status - with second mortgage (%)
Mortgage status - with home equity loan (%)
Mortgage status - with both second mortgage and home equity loan (%)
Mortgage status - without a mortgage (%)
Average family size
Average family size - White
Average family size - Black or African American
Average family size - Asian
Average family size - Hispanic or Latino
Average family size - American Indian and Alaska Native
Average family size - Multirace
Average family size - Other Race
Geographical mobility - Same house 1 year ago (%)
Geographical mobility - Moved within same county (%)
Geographical mobility - Moved from different county within same state (%)
Geographical mobility - Moved from different state (%)
Geographical mobility - Moved from abroad (%)
Place of birth - Born in state of residence (%)
Place of birth - Born in other state (%)
Place of birth - Native, outside of US (%)
Place of birth - Foreign born (%)
Housing units in structures - 1, detached (%)
Housing units in structures - 1, attached (%)
Housing units in structures - 2 (%)
Housing units in structures - 3 or 4 (%)
Housing units in structures - 5 to 9 (%)
Housing units in structures - 10 to 19 (%)
Housing units in structures - 20 to 49 (%)
Housing units in structures - 50 or more (%)
Housing units in structures - Mobile home (%)
Housing units in structures - Boat, RV, van, etc. (%)
House/condo owner moved in on average (years ago)
Renter moved in on average (years ago)
Year householder moved into unit - Moved in 1999 to March 2000 (%)
Year householder moved into unit - Moved in 1995 to 1998 (%)
Year householder moved into unit - Moved in 1990 to 1994 (%)
Year householder moved into unit - Moved in 1980 to 1989 (%)
Year householder moved into unit - Moved in 1970 to 1979 (%)
Year householder moved into unit - Moved in 1969 or earlier (%)
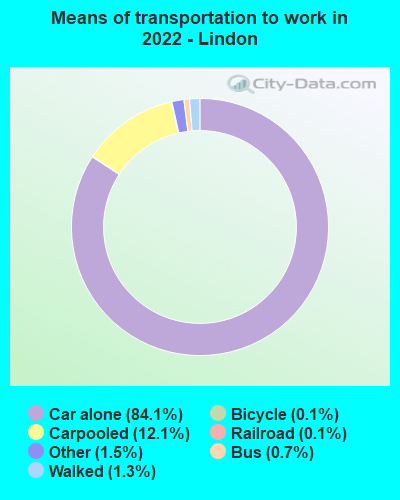
Means of transportation to work - Drove car alone (%)
Means of transportation to work - Carpooled (%)
Means of transportation to work - Public transportation (%)
Means of transportation to work - Bus or trolley bus (%)
Means of transportation to work - Streetcar or trolley car (%)
Means of transportation to work - Subway or elevated (%)
Means of transportation to work - Railroad (%)
Means of transportation to work - Ferryboat (%)
Means of transportation to work - Taxicab (%)
Means of transportation to work - Motorcycle (%)
Means of transportation to work - Bicycle (%)
Means of transportation to work - Walked (%)
Means of transportation to work - Other means (%)
Working at home (%)
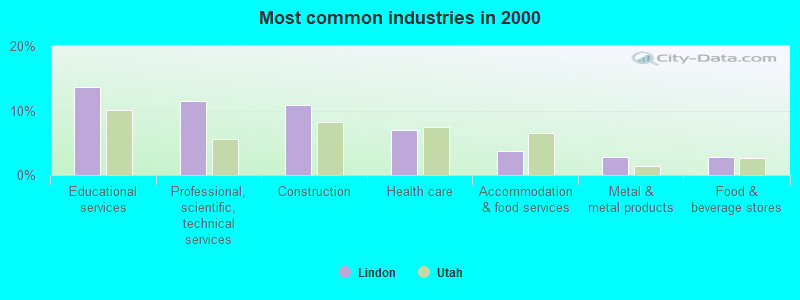
Industry diversity
Most Common Industries - Agriculture, forestry, fishing and hunting, and mining (%)
Most Common Industries - Agriculture, forestry, fishing and hunting (%)
Most Common Industries - Mining, quarrying, and oil and gas extraction (%)
Most Common Industries - Construction (%)
Most Common Industries - Manufacturing (%)
Most Common Industries - Wholesale trade (%)
Most Common Industries - Retail trade (%)
Most Common Industries - Transportation and warehousing, and utilities (%)
Most Common Industries - Transportation and warehousing (%)
Most Common Industries - Utilities (%)
Most Common Industries - Information (%)
Most Common Industries - Finance and insurance, and real estate and rental and leasing (%)
Most Common Industries - Finance and insurance (%)
Most Common Industries - Real estate and rental and leasing (%)
Most Common Industries - Professional, scientific, and management, and administrative and waste management services (%)
Most Common Industries - Professional, scientific, and technical services (%)
Most Common Industries - Management of companies and enterprises (%)
Most Common Industries - Administrative and support and waste management services (%)
Most Common Industries - Educational services, and health care and social assistance (%)
Most Common Industries - Educational services (%)
Most Common Industries - Health care and social assistance (%)
Most Common Industries - Arts, entertainment, and recreation, and accommodation and food services (%)
Most Common Industries - Arts, entertainment, and recreation (%)
Most Common Industries - Accommodation and food services (%)
Most Common Industries - Other services, except public administration (%)
Most Common Industries - Public administration (%)
Occupation diversity
Most Common Occupations - Management, business, science, and arts occupations (%)
Most Common Occupations - Management, business, and financial occupations (%)
Most Common Occupations - Management occupations (%)
Most Common Occupations - Business and financial operations occupations (%)
Most Common Occupations - Computer, engineering, and science occupations (%)
Most Common Occupations - Computer and mathematical occupations (%)
Most Common Occupations - Architecture and engineering occupations (%)
Most Common Occupations - Life, physical, and social science occupations (%)
Most Common Occupations - Education, legal, community service, arts, and media occupations (%)
Most Common Occupations - Community and social service occupations (%)
Most Common Occupations - Legal occupations (%)
Most Common Occupations - Education, training, and library occupations (%)
Most Common Occupations - Arts, design, entertainment, sports, and media occupations (%)
Most Common Occupations - Healthcare practitioners and technical occupations (%)
Most Common Occupations - Health diagnosing and treating practitioners and other technical occupations (%)
Most Common Occupations - Health technologists and technicians (%)
Most Common Occupations - Service occupations (%)
Most Common Occupations - Healthcare support occupations (%)
Most Common Occupations - Protective service occupations (%)
Most Common Occupations - Fire fighting and prevention, and other protective service workers including supervisors (%)
Most Common Occupations - Law enforcement workers including supervisors (%)
Most Common Occupations - Food preparation and serving related occupations (%)
Most Common Occupations - Building and grounds cleaning and maintenance occupations (%)
Most Common Occupations - Personal care and service occupations (%)
Most Common Occupations - Sales and office occupations (%)
Most Common Occupations - Sales and related occupations (%)
Most Common Occupations - Office and administrative support occupations (%)
Most Common Occupations - Natural resources, construction, and maintenance occupations (%)
Most Common Occupations - Farming, fishing, and forestry occupations (%)
Most Common Occupations - Construction and extraction occupations (%)
Most Common Occupations - Installation, maintenance, and repair occupations (%)
Most Common Occupations - Production, transportation, and material moving occupations (%)
Most Common Occupations - Production occupations (%)
Most Common Occupations - Transportation occupations (%)
Most Common Occupations - Material moving occupations (%)
People in Group quarters - Institutionalized population (%)
People in Group quarters - Correctional institutions (%)
People in Group quarters - Federal prisons and detention centers (%)
People in Group quarters - Halfway houses (%)
People in Group quarters - Local jails and other confinement facilities (including police lockups) (%)
People in Group quarters - Military disciplinary barracks (%)
People in Group quarters - State prisons (%)
People in Group quarters - Other types of correctional institutions (%)
People in Group quarters - Nursing homes (%)
People in Group quarters - Hospitals/wards, hospices, and schools for the handicapped (%)
People in Group quarters - Hospitals/wards and hospices for chronically ill (%)
People in Group quarters - Hospices or homes for chronically ill (%)
People in Group quarters - Military hospitals or wards for chronically ill (%)
People in Group quarters - Other hospitals or wards for chronically ill (%)
People in Group quarters - Hospitals or wards for drug/alcohol abuse (%)
People in Group quarters - Mental (Psychiatric) hospitals or wards (%)
People in Group quarters - Schools, hospitals, or wards for the mentally retarded (%)
People in Group quarters - Schools, hospitals, or wards for the physically handicapped (%)
People in Group quarters - Institutions for the deaf (%)
People in Group quarters - Institutions for the blind (%)
People in Group quarters - Orthopedic wards and institutions for the physically handicapped (%)
People in Group quarters - Wards in general hospitals for patients who have no usual home elsewhere (%)
People in Group quarters - Wards in military hospitals for patients who have no usual home elsewhere (%)
People in Group quarters - Juvenile institutions (%)
People in Group quarters - Long-term care (%)
People in Group quarters - Homes for abused, dependent, and neglected children (%)
People in Group quarters - Residential treatment centers for emotionally disturbed children (%)
People in Group quarters - Training schools for juvenile delinquents (%)
People in Group quarters - Short-term care, detention or diagnostic centers for delinquent children (%)
People in Group quarters - Type of juvenile institution unknown (%)
People in Group quarters - Noninstitutionalized population (%)
People in Group quarters - College dormitories (includes college quarters off campus) (%)
People in Group quarters - Military quarters (%)
People in Group quarters - On base (%)
People in Group quarters - Barracks, unaccompanied personnel housing (UPH), (Enlisted/Officer), ;and similar group living quarters for military personnel (%)
People in Group quarters - Transient quarters for temporary residents (%)
People in Group quarters - Military ships (%)
People in Group quarters - Group homes (%)
People in Group quarters - Homes or halfway houses for drug/alcohol abuse (%)
People in Group quarters - Homes for the mentally ill (%)
People in Group quarters - Homes for the mentally retarded (%)
People in Group quarters - Homes for the physically handicapped (%)
People in Group quarters - Other group homes (%)
People in Group quarters - Religious group quarters (%)
People in Group quarters - Dormitories (%)
People in Group quarters - Agriculture workers' dormitories on farms (%)
People in Group quarters - Job Corps and vocational training facilities (%)
People in Group quarters - Other workers' dormitories (%)
People in Group quarters - Crews of maritime vessels (%)
People in Group quarters - Other nonhousehold living situations (%)
People in Group quarters - Other noninstitutional group quarters (%)
Residents speaking English at home (%)
Residents speaking English at home - Born in the United States (%)
Residents speaking English at home - Native, born elsewhere (%)
Residents speaking English at home - Foreign born (%)
Residents speaking Spanish at home (%)
Residents speaking Spanish at home - Born in the United States (%)
Residents speaking Spanish at home - Native, born elsewhere (%)
Residents speaking Spanish at home - Foreign born (%)
Residents speaking other language at home (%)
Residents speaking other language at home - Born in the United States (%)
Residents speaking other language at home - Native, born elsewhere (%)
Residents speaking other language at home - Foreign born (%)
Class of Workers - Employee of private company (%)
Class of Workers - Self-employed in own incorporated business (%)
Class of Workers - Private not-for-profit wage and salary workers (%)
Class of Workers - Local government workers (%)
Class of Workers - State government workers (%)
Class of Workers - Federal government workers (%)
Class of Workers - Self-employed workers in own not incorporated business and Unpaid family workers (%)
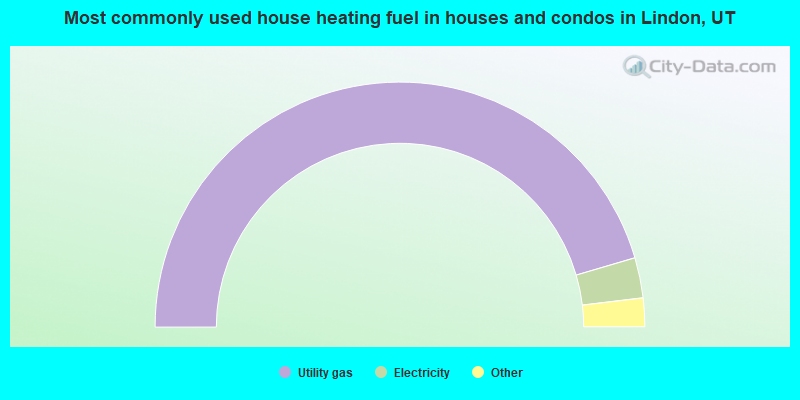
House heating fuel used in houses and condos - Utility gas (%)
House heating fuel used in houses and condos - Bottled, tank, or LP gas (%)
House heating fuel used in houses and condos - Electricity (%)
House heating fuel used in houses and condos - Fuel oil, kerosene, etc. (%)
House heating fuel used in houses and condos - Coal or coke (%)
House heating fuel used in houses and condos - Wood (%)
House heating fuel used in houses and condos - Solar energy (%)
House heating fuel used in houses and condos - Other fuel (%)
House heating fuel used in houses and condos - No fuel used (%)
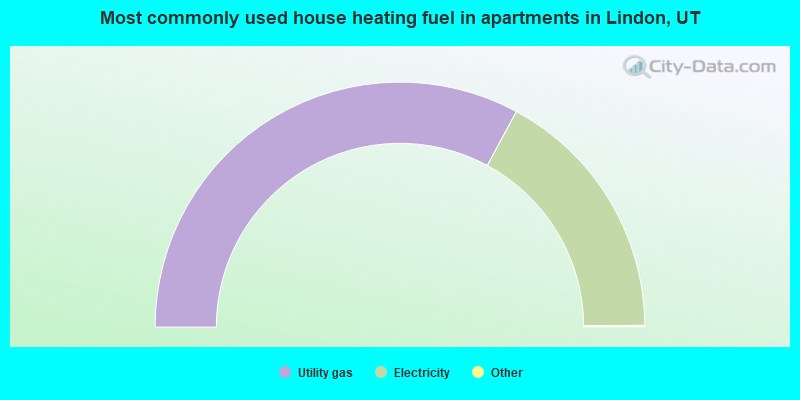
House heating fuel used in apartments - Utility gas (%)
House heating fuel used in apartments - Bottled, tank, or LP gas (%)
House heating fuel used in apartments - Electricity (%)
House heating fuel used in apartments - Fuel oil, kerosene, etc. (%)
House heating fuel used in apartments - Coal or coke (%)
House heating fuel used in apartments - Wood (%)
House heating fuel used in apartments - Solar energy (%)
House heating fuel used in apartments - Other fuel (%)
House heating fuel used in apartments - No fuel used (%)
Armed forces status - In Armed Forces (%)
Armed forces status - Civilian (%)
Armed forces status - Civilian - Veteran (%)
Armed forces status - Civilian - Nonveteran (%)
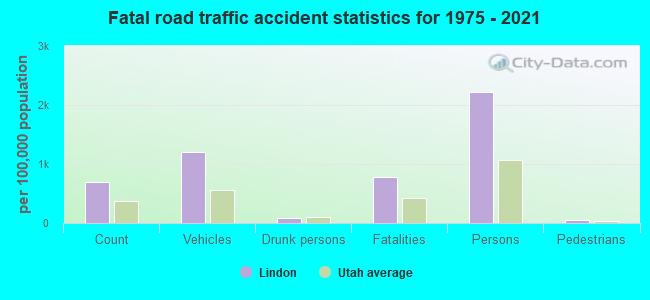
Fatal accidents locations in years 2005-2021
Fatal accidents locations in 2005
Fatal accidents locations in 2006
Fatal accidents locations in 2007
Fatal accidents locations in 2008
Fatal accidents locations in 2009
Fatal accidents locations in 2010
Fatal accidents locations in 2011
Fatal accidents locations in 2012
Fatal accidents locations in 2013
Fatal accidents locations in 2014
Fatal accidents locations in 2015
Fatal accidents locations in 2016
Fatal accidents locations in 2017
Fatal accidents locations in 2018
Fatal accidents locations in 2019
Fatal accidents locations in 2020
Fatal accidents locations in 2021
Alcohol use - People drinking some alcohol every month (%)
Alcohol use - People not drinking at all (%)
Alcohol use - Average days/month drinking alcohol
Alcohol use - Average drinks/week
Alcohol use - Average days/year people drink much
Audiometry - Average condition of hearing (%)
Audiometry - People that can hear a whisper from across a quiet room (%)
Audiometry - People that can hear normal voice from across a quiet room (%)
Audiometry - Ears ringing, roaring, buzzing (%)
Audiometry - Had a job exposure to loud noise (%)
Audiometry - Had off-work exposure to loud noise (%)
Blood Pressure & Cholesterol - Has high blood pressure (%)
Blood Pressure & Cholesterol - Checking blood pressure at home (%)
Blood Pressure & Cholesterol - Frequently checking blood cholesterol (%)
Blood Pressure & Cholesterol - Has high cholesterol level (%)
Consumer Behavior - Money monthly spent on food at supermarket/grocery store
Consumer Behavior - Money monthly spent on food at other stores
Consumer Behavior - Money monthly spent on eating out
Consumer Behavior - Money monthly spent on carryout/delivered foods
Consumer Behavior - Income spent on food at supermarket/grocery store (%)
Consumer Behavior - Income spent on food at other stores (%)
Consumer Behavior - Income spent on eating out (%)
Consumer Behavior - Income spent on carryout/delivered foods (%)
Current Health Status - General health condition (%)
Current Health Status - Blood donors (%)
Current Health Status - Has blood ever tested for HIV virus (%)
Current Health Status - Left-handed people (%)
Dermatology - People using sunscreen (%)
Diabetes - Diabetics (%)
Diabetes - Had a blood test for high blood sugar (%)
Diabetes - People taking insulin (%)
Diet Behavior & Nutrition - Diet health (%)
Diet Behavior & Nutrition - Milk product consumption (# of products/month)
Diet Behavior & Nutrition - Meals not home prepared (#/week)
Diet Behavior & Nutrition - Meals from fast food or pizza place (#/week)
Diet Behavior & Nutrition - Ready-to-eat foods (#/month)
Diet Behavior & Nutrition - Frozen meals/pizza (#/month)
Drug Use - People that ever used marijuana or hashish (%)
Drug Use - Ever used hard drugs (%)
Drug Use - Ever used any form of cocaine (%)
Drug Use - Ever used heroin (%)
Drug Use - Ever used methamphetamine (%)
Health Insurance - People covered by health insurance (%)
Kidney Conditions-Urology - Avg. # of times urinating at night
Medical Conditions - People with asthma (%)
Medical Conditions - People with anemia (%)
Medical Conditions - People with psoriasis (%)
Medical Conditions - People with overweight (%)
Medical Conditions - Elderly people having difficulties in thinking or remembering (%)
Medical Conditions - People who ever received blood transfusion (%)
Medical Conditions - People having trouble seeing even with glass/contacts (%)
Medical Conditions - People with arthritis (%)
Medical Conditions - People with gout (%)
Medical Conditions - People with congestive heart failure (%)
Medical Conditions - People with coronary heart disease (%)
Medical Conditions - People with angina pectoris (%)
Medical Conditions - People who ever had heart attack (%)
Medical Conditions - People who ever had stroke (%)
Medical Conditions - People with emphysema (%)
Medical Conditions - People with thyroid problem (%)
Medical Conditions - People with chronic bronchitis (%)
Medical Conditions - People with any liver condition (%)
Medical Conditions - People who ever had cancer or malignancy (%)
Mental Health - People who have little interest in doing things (%)
Mental Health - People feeling down, depressed, or hopeless (%)
Mental Health - People who have trouble sleeping or sleeping too much (%)
Mental Health - People feeling tired or having little energy (%)
Mental Health - People with poor appetite or overeating (%)
Mental Health - People feeling bad about themself (%)
Mental Health - People who have trouble concentrating on things (%)
Mental Health - People moving or speaking slowly or too fast (%)
Mental Health - People having thoughts they would be better off dead (%)
Oral Health - Average years since last visit a dentist
Oral Health - People embarrassed because of mouth (%)
Oral Health - People with gum disease (%)
Oral Health - General health of teeth and gums (%)
Oral Health - Average days a week using dental floss/device
Oral Health - Average days a week using mouthwash for dental problem
Oral Health - Average number of teeth
Pesticide Use - Households using pesticides to control insects (%)
Pesticide Use - Households using pesticides to kill weeds (%)
Physical Activity - People doing vigorous-intensity work activities (%)
Physical Activity - People doing moderate-intensity work activities (%)
Physical Activity - People walking or bicycling (%)
Physical Activity - People doing vigorous-intensity recreational activities (%)
Physical Activity - People doing moderate-intensity recreational activities (%)
Physical Activity - Average hours a day doing sedentary activities
Physical Activity - Average hours a day watching TV or videos
Physical Activity - Average hours a day using computer
Physical Functioning - People having limitations keeping them from working (%)
Physical Functioning - People limited in amount of work they can do (%)
Physical Functioning - People that need special equipment to walk (%)
Physical Functioning - People experiencing confusion/memory problems (%)
Physical Functioning - People requiring special healthcare equipment (%)
Prescription Medications - Average number of prescription medicines taking
Preventive Aspirin Use - Adults 40+ taking low-dose aspirin (%)
Reproductive Health - Vaginal deliveries (%)
Reproductive Health - Cesarean deliveries (%)
Reproductive Health - Deliveries resulted in a live birth (%)
Reproductive Health - Pregnancies resulted in a delivery (%)
Reproductive Health - Women breastfeeding newborns (%)
Reproductive Health - Women that had a hysterectomy (%)
Reproductive Health - Women that had both ovaries removed (%)
Reproductive Health - Women that have ever taken birth control pills (%)
Reproductive Health - Women taking birth control pills (%)
Reproductive Health - Women that have ever used Depo-Provera or injectables (%)
Reproductive Health - Women that have ever used female hormones (%)
Sexual Behavior - People 18+ that ever had sex (vaginal, anal, or oral) (%)
Sexual Behavior - Males 18+ that ever had vaginal sex with a woman (%)
Sexual Behavior - Males 18+ that ever performed oral sex on a woman (%)
Sexual Behavior - Males 18+ that ever had anal sex with a woman (%)
Sexual Behavior - Males 18+ that ever had any sex with a man (%)
Sexual Behavior - Females 18+ that ever had vaginal sex with a man (%)
Sexual Behavior - Females 18+ that ever performed oral sex on a man (%)
Sexual Behavior - Females 18+ that ever had anal sex with a man (%)
Sexual Behavior - Females 18+ that ever had any kind of sex with a woman (%)
Sexual Behavior - Average age people first had sex
Sexual Behavior - Average number of female sex partners in lifetime (males 18+)
Sexual Behavior - Average number of female vaginal sex partners in lifetime (males 18+)
Sexual Behavior - Average age people first performed oral sex on a woman (18+)
Sexual Behavior - Average number of woman performed oral sex on in lifetime (18+)
Sexual Behavior - Average number of male sex partners in lifetime (males 18+)
Sexual Behavior - Average number of male anal sex partners in lifetime (males 18+)
Sexual Behavior - Average age people first performed oral sex on a man (18+)
Sexual Behavior - Average number of male oral sex partners in lifetime (18+)
Sexual Behavior - People using protection when performing oral sex (%)
Sexual Behavior - Average number of times people have vaginal or anal sex a year
Sexual Behavior - People having sex without condom (%)
Sexual Behavior - Average number of male sex partners in lifetime (females 18+)
Sexual Behavior - Average number of male vaginal sex partners in lifetime (females 18+)
Sexual Behavior - Average number of female sex partners in lifetime (females 18+)
Sexual Behavior - Circumcised males 18+ (%)
Sleep Disorders - Average hours sleeping at night
Sleep Disorders - People that has trouble sleeping (%)
Smoking-Cigarette Use - People smoking cigarettes (%)
Taste & Smell - People 40+ having problems with smell (%)
Taste & Smell - People 40+ having problems with taste (%)
Taste & Smell - People 40+ that ever had wisdom teeth removed (%)
Taste & Smell - People 40+ that ever had tonsils teeth removed (%)
Taste & Smell - People 40+ that ever had a loss of consciousness because of a head injury (%)
Taste & Smell - People 40+ that ever had a broken nose or other serious injury to face or skull (%)
Taste & Smell - People 40+ that ever had two or more sinus infections (%)
Weight - Average height (inches)
Weight - Average weight (pounds)
Weight - Average BMI
Weight - People that are obese (%)
Weight - People that ever were obese (%)
Weight - People trying to lose weight (%)
According to our research of Utah and other state lists, there were 11 registered sex offenders living in Lindon, Utah as of April 27, 2024 . The ratio of all residents to sex offenders in Lindon is 1,020 to 1.The ratio of registered sex offenders to all residents in this city is much lower than the state average.
Officers per 1,000 residents here:
1.29Utah average:
1.67
Latest news from Lindon, UT collected exclusively by city-data.com from local newspapers, TV, and radio stations
Ancestries: English (41.6%), European (9.6%), American (3.5%), British (3.4%), Italian (3.3%), Danish (2.9%).
Current Local Time:
Land area: 8.40 square miles.
Population density: 1,394 people per square mile (low).
563 residents are foreign born (1.4% Latin America , 1.2% Asia , 0.9% Oceania ).
Median real estate property taxes paid for housing units with mortgages in 2022: $2,701 (0.4%)Median real estate property taxes paid for housing units with no mortgage in 2022: $2,714 (0.4%)
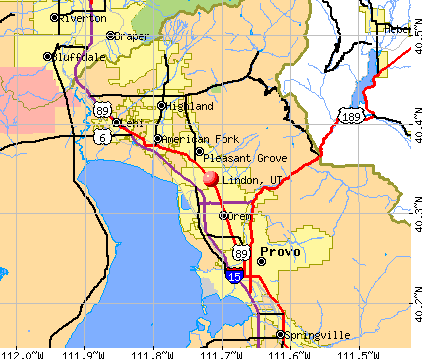
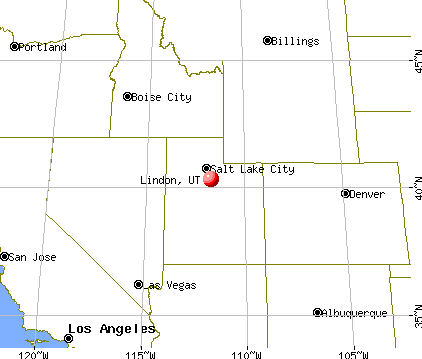
Nearest city with pop. 50,000+: Orem, UT
Nearest city with pop. 200,000+: Las Vegas, NV
Nearest city with pop. 1,000,000+: Phoenix, AZ
Nearest cities:
Vineyard, UT (1.8 miles),
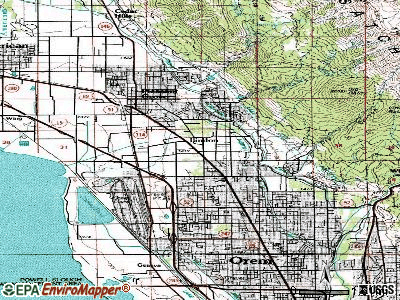
Latitude: 40.34 N, Longitude: 111.72 W
Daytime population change due to commuting: +8,125 (+67.1%)Workers who live and work in this city: 1,959 (35.7%)
Area code commonly used in this area: 801
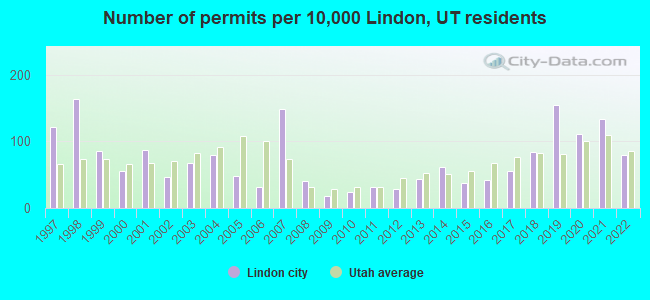
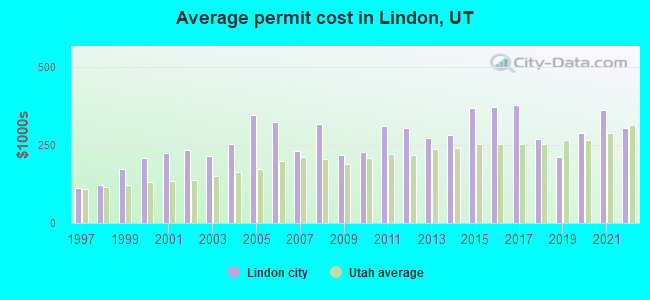
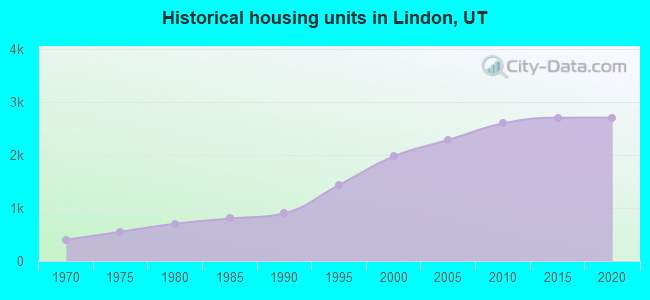
Single-family new house construction building permits:
2022: 67 buildings , average cost: $304,6002021: 111 buildings , average cost: $361,8002020: 93 buildings , average cost: $287,7002019: 129 buildings , average cost: $211,2002018: 70 buildings , average cost: $270,7002017: 47 buildings , average cost: $379,3002016: 35 buildings , average cost: $374,1002015: 31 buildings , average cost: $369,0002014: 52 buildings , average cost: $282,1002013: 36 buildings , average cost: $274,3002012: 24 buildings , average cost: $304,9002011: 27 buildings , average cost: $313,0002010: 20 buildings , average cost: $228,6002009: 15 buildings , average cost: $220,4002008: 34 buildings , average cost: $318,6002007: 124 buildings , average cost: $232,0002006: 27 buildings , average cost: $324,5002005: 40 buildings , average cost: $347,6002004: 67 buildings , average cost: $252,5002003: 56 buildings , average cost: $214,8002002: 39 buildings , average cost: $236,3002001: 73 buildings , average cost: $224,0002000: 47 buildings , average cost: $209,6001999: 72 buildings , average cost: $174,2001998: 136 buildings , average cost: $121,7001997: 102 buildings , average cost: $111,300Unemployment in December 2023:
Population change in the 1990s: +4,455 (+114.0%).
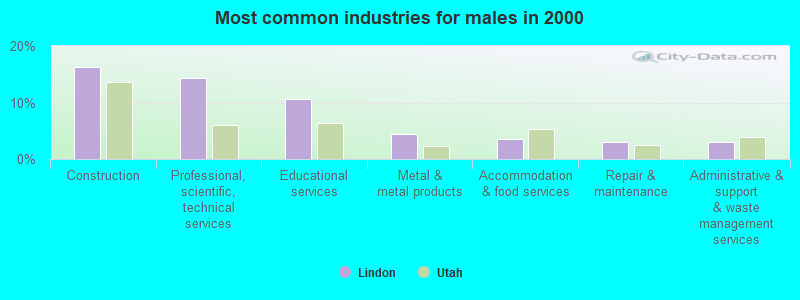
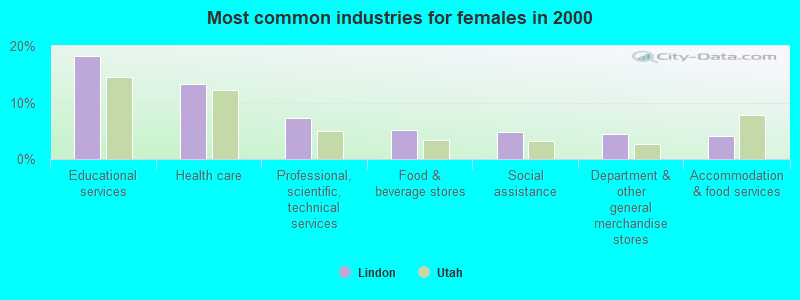
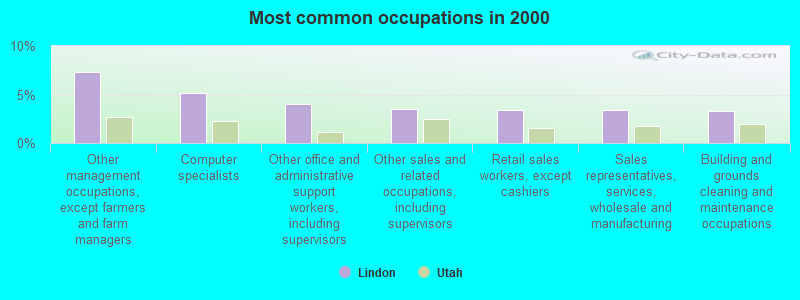
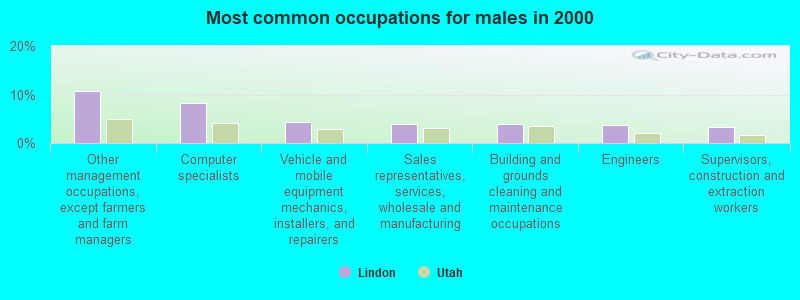
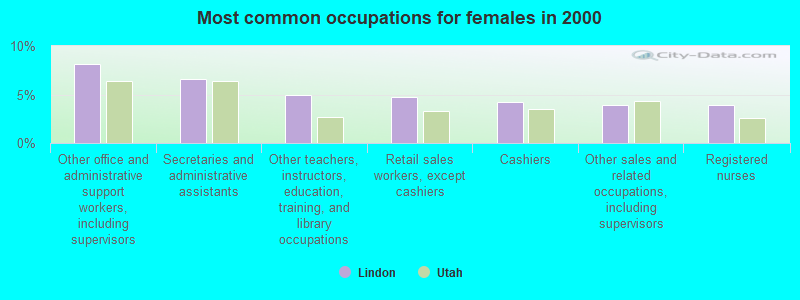
Most common occupations in Lindon, UT (%)
Both Males Females
Other management occupations, except farmers and farm managers (7.4%)
Computer specialists (5.2%)
Other office and administrative support workers, including supervisors (4.0%)
Other sales and related occupations, including supervisors (3.5%)
Retail sales workers, except cashiers (3.4%)
Sales representatives, services, wholesale and manufacturing (3.4%)
Building and grounds cleaning and maintenance occupations (3.3%)
Other management occupations, except farmers and farm managers (10.8%)
Computer specialists (8.2%)
Vehicle and mobile equipment mechanics, installers, and repairers (4.3%)
Sales representatives, services, wholesale and manufacturing (3.9%)
Building and grounds cleaning and maintenance occupations (3.9%)
Engineers (3.8%)
Supervisors, construction and extraction workers (3.2%)
Other office and administrative support workers, including supervisors (8.2%)
Secretaries and administrative assistants (6.6%)
Other teachers, instructors, education, training, and library occupations (4.9%)
Retail sales workers, except cashiers (4.7%)
Cashiers (4.2%)
Other sales and related occupations, including supervisors (3.9%)
Registered nurses (3.9%)
Earthquake activity:
Lindon-area historical earthquake activity is significantly above Utah state average. It is 2201% greater than the overall U.S. average. On 8/18/1959 at 06:37:13, a magnitude 7.7 (7.7 UK, Class: Major, Intensity: VIII - XII) earthquake occurred 297.4 miles away from Lindon center, causing $26,000,000 total damage On 10/3/1915 at 06:52:48, a magnitude 7.6 (7.6 UK) earthquake occurred 304.7 miles away from the city center On 10/28/1983 at 14:06:06, a magnitude 7.3 (6.2 MB, 7.3 MS, 7.0 MW) earthquake occurred 279.8 miles away from Lindon center, causing 2 deaths ( 2 shaking deaths) and 3 injuries, causing $15,000,000 total damage On 3/28/1975 at 02:31:05, a magnitude 6.2 (6.1 MB, 6.0 MS, 6.2 ML, Class: Strong, Intensity: VII - IX) earthquake occurred 122.3 miles away from the city center On 3/18/2020 at 13:09:31, a magnitude 5.7 (5.7 MW, Depth: 7.4 mi, Class: Moderate, Intensity: VI - VII) earthquake occurred 34.3 miles away from Lindon center On 12/21/1932 at 06:10:09, a magnitude 7.2 (7.2 UK) earthquake occurred 362.9 miles away from the city center Magnitude types: body-wave magnitude (MB), local magnitude (ML), surface-wave magnitude (MS), moment magnitude (MW) Natural disasters: The number of natural disasters in Utah County (7) is smaller than the US average (15).Major Disasters (Presidential) Declared: 3Emergencies Declared: 1Floods: 3, Fires: 2, Landslides: 2, Storms: 2, Hurricane: 1, Mudslide: 1, Other: 1 (Note: some incidents may be assigned to more than one category). Main business address for: SCO GROUP INC SERVICES-PREPACKAGED SOFTWARE ), ALTIRIS INC SERVICES-PREPACKAGED SOFTWARE ).
Hospitals and medical centers in Lindon: LINDON CARE AND TRAINING CENTER (680 NORTH STATE STREET) Other hospitals and medical centers near Lindon: A - PLUS HOME CARE (Home Health Center, about 2 miles away; OREM, UT)
ALPINE VALLEY CARE CENTER (Nursing Home, about 2 miles away; PLEASANT GROVE, UT)
TIMPANOGOS REGIONAL HOSPITAL (about 2 miles away; OREM, UT)
BERKSHIRE REHAB AND COMFORT CARE (Nursing Home, about 3 miles away; OREM, UT)
HORIZON HOME HEALTH (Home Health Center, about 3 miles away; OREM, UT)
RHEMA HEALTH SYSTEMS, INC (Home Health Center, about 3 miles away; OREM, UT)
ORCHARD PARK CARE CENTER (Nursing Home, about 3 miles away; OREM, UT)
Amtrak station near Lindon: 9 miles: PROVO (600 SOUTH & 3OO WEST) Services: fully wheelchair accessible, free short-term parking, free long-term parking, call for taxi service.
College/University in Lindon: Utah College of Massage Therapy-Utah Valley Full-time enrollment: 202; Location: 135 S State St. Ste 12; Private, for-profit; Website: www.steinered.com)
Colleges/universities with over 2000 students nearest to Lindon:
Utah Valley University (about 5 miles; Orem, UT ; Full-time enrollment: 24,403)
Brigham Young University-Provo (about 8 miles; Provo, UT ; FT enrollment: 33,525)
Stevens-Henager College-Murray (about 25 miles; Murray, UT ; FT enrollment: 6,395)
Western Governors University (about 26 miles; Salt Lake City, UT ; FT enrollment: 31,481)
Salt Lake Community College (about 26 miles; Salt Lake City, UT ; FT enrollment: 20,797)
Westminster College (about 29 miles; Salt Lake City, UT ; FT enrollment: 2,870)
University of Utah (about 31 miles; Salt Lake City, UT ; FT enrollment: 28,454)
Public high schools in Lindon: OAK CANYON JR HIGH Students: 1,135, Location: 111 S 725 E, Grades: 7-9)KARL G MAESER PREPARATORY ACADEMY Location: 320 W 600 S, Grades: 7-12, Charter school )
Public elementary/middle schools in Lindon: LINDON SCHOOL Students: 597, Location: 30 N MAIN, Grades: PK-6)ROCKY MOUNTAIN SCHOOL Students: 573, Location: 55 S 500 E, Grades: PK-6)TIMPANOGOS ACADEMY Location: 70 S 100 E, Grades: KG-6, Charter school )
See full list of schools located in Lindon Utah County has a predicted average indoor radon screening level between 2 and 4 pCi/L (pico curies per liter) - Moderate Potential Drinking water stations with addresses in Lindon and their reported violations in the past:
LINDON CITY (Population served: 10,500, Groundwater):
Past health violations:
MCL, Acute (TCR) - In JUN-2013, Contaminant: Coliform. Follow-up actions: St Public Notif received (JUN-29-2013), St Public Notif requested (AUG-13-2013), St Formal NOV issued (AUG-13-2013), St Boil Water Order (AUG-13-2013)
MCL, Monthly (TCR) - In SEP-2010, Contaminant: Coliform. Follow-up actions: St Formal NOV issued (NOV-06-2010), St Public Notif requested (NOV-06-2010)
Past monitoring violations:
Monitoring and Reporting (DBP) - Between JUL-2010 and SEP-2010, Contaminant: Total Haloacetic Acids (HAA5). Follow-up actions: St Public Notif requested (DEC-12-2010), St Compliance achieved (DEC-12-2010), St Formal NOV issued (DEC-12-2010)
Monitoring and Reporting (DBP) - Between JUL-2010 and SEP-2010, Contaminant: TTHM. Follow-up actions: St Public Notif requested (DEC-12-2010), St Compliance achieved (DEC-12-2010), St Formal NOV issued (DEC-12-2010)
109 regular monitoring violations
Average household size: This city:
4.0 peopleUtah:
3.1 people
Percentage of family households: This city:
90.5%Whole state:
75.2%
Percentage of households with unmarried partners: This city:
1.2%Whole state:
4.6%
Likely homosexual households (counted as self-reported same-sex unmarried-partner households)
Lesbian couples: 0.3% of all households Gay men: 0.1% of all households
66 people in residential treatment centers for adults in 2010people in schools, hospitals, or wards for the intellectually disabled in 2000people in other noninstitutional group quarters in 2000
Banks with branches in Lindon (2011 data):
Wells Fargo Bank, National Association: Timpanogos Branch at 639 North State Street, branch established on 1981/03/16. Info updated 2011/04/05: Bank assets: $1,161,490.0 mil, Deposits: $905,653.0 mil, headquarters in Sioux Falls, SD, positive income , 6395 total offices , Holding Company: Wells Fargo & Company
American Bank of Commerce: Lindon Branch at 144 South State Street, branch established on 2010/04/28. Info updated 2006/11/03: Bank assets: $46.2 mil, Deposits: $37.8 mil, headquarters in Provo, UT, positive income , Commercial Lending Specialization, 5 total offices , Holding Company: Ambancorp
JPMorgan Chase Bank, National Association: Lindon Branch at 579 N State St, branch established on 2008/09/25. Info updated 2011/11/10: Bank assets: $1,811,678.0 mil, Deposits: $1,190,738.0 mil, headquarters in Columbus, OH, positive income , International Specialization, 5577 total offices , Holding Company: Jpmorgan Chase & Co.
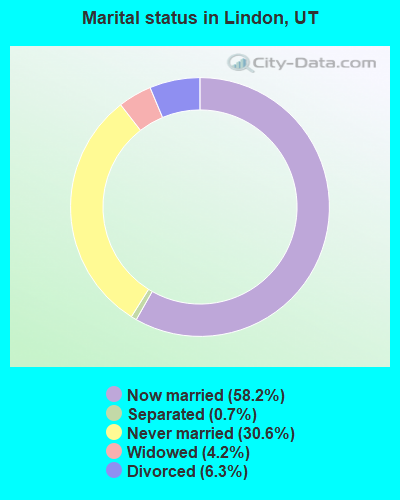
For population 15 years and over in Lindon:
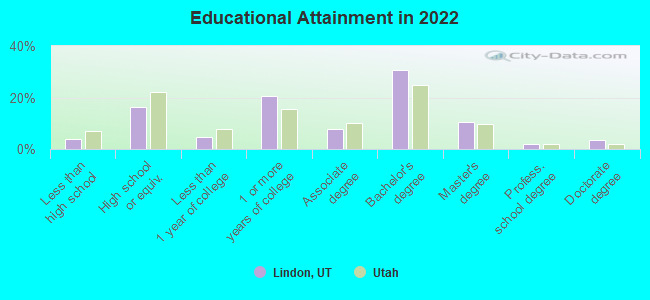
Never married: 30.6%Now married: 58.2%Separated: 0.7%Widowed: 4.2%Divorced: 6.3% For population 25 years and over in Lindon:
High school or higher: 96.4%Bachelor's degree or higher: 45.5%Graduate or professional degree: 15.6%Unemployed: 5.0%Mean travel time to work (commute): 15.7 minutes
Education Gini index (Inequality in education) Here:
9.2Utah average:
10.9
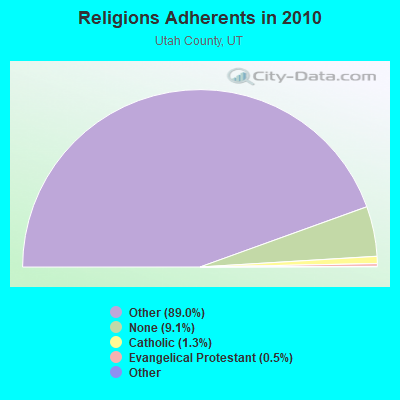
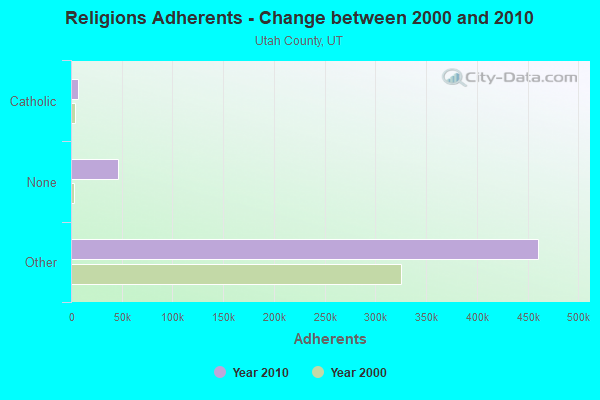
Religion statistics for Lindon, UT (based on Utah County data)
Religion Adherents Congregations Other 459,847 1,303 Catholic 6,792 4 Evangelical Protestant 2,540 26 Mainline Protestant 423 6 Black Protestant 211 1 None 46,751 -
Source: Clifford Grammich, Kirk Hadaway, Richard Houseal, Dale E.Jones, Alexei Krindatch, Richie Stanley and Richard H.Taylor. 2012. 2010 U.S.Religion Census: Religious Congregations & Membership Study. Association of Statisticians of American Religious Bodies. Jones, Dale E., et al. 2002. Congregations and Membership in the United States 2000. Nashville, TN: Glenmary Research Center. Graphs represent county-level data
Food Environment Statistics: Number of grocery stores : 43Utah County :
0.84 / 10,000 pop.Utah :
1.37 / 10,000 pop.
Number of supercenters and club stores : 6Utah County :
0.12 / 10,000 pop.Utah :
0.18 / 10,000 pop.
Number of convenience stores (no gas) : 3Utah County :
0.06 / 10,000 pop.State :
0.41 / 10,000 pop.
Number of convenience stores (with gas) : 90This county :
1.75 / 10,000 pop.Utah :
2.82 / 10,000 pop.
Number of full-service restaurants : 146Here :
2.84 / 10,000 pop.Utah :
5.09 / 10,000 pop.
Adult diabetes rate : This county :
5.4%Utah :
6.3%
Adult obesity rate : Utah County :
24.5%Utah :
23.6%
Health and Nutrition:
Average overall health of teeth and gums : People feeling badly about themselves : This city:
20.5%State:
21.0%
People not drinking alcohol at all : Average hours sleeping at night : Overweight people : This city:
34.4%State:
31.9%
General health condition : Average condition of hearing : More about Health and Nutrition of Lindon, UT Residents
Local government employment and payroll (March 2022)
Function
Full-time employees
Monthly full-time payroll
Average yearly full-time wage
Part-time employees
Monthly part-time payroll
Police Protection - Officers
14 $106,854 $91,589 2 $3,994 Other and Unallocable
10 $65,828 $78,994 3 $3,670 Parks and Recreation
6 $33,421 $66,842 13 $7,951 Financial Administration
5 $31,319 $75,166 1 $1,296 Other Government Administration
4 $41,220 $123,660 13 $6,752 Water Supply
4 $22,026 $66,078 0 $0 Sewerage
3 $17,505 $70,020 0 $0 Police - Other
2 $8,912 $53,472 6 $6,240 Judicial and Legal
2 $7,439 $44,634 3 $6,327 Streets and Highways
1 $5,097 $61,164 0 $0
Totals for Government
51 $339,620 $79,911 41 $36,230
Lindon government finances - Expenditure in 2018 (per resident):
Construction - Sewerage: $902,000 ($77.07)
Regular Highways: $565,000 ($48.27)Water Utilities: $366,000 ($31.27)Parks and Recreation: $197,000 ($16.83)Natural Resources - Other: $52,000 ($4.44)General - Other: $48,000 ($4.10)Protective Inspection and Regulation - Other: $26,000 ($2.22)General Public Buildings: $26,000 ($2.22)Police Protection: $14,000 ($1.20)Public Welfare - Other: $12,000 ($1.03)Current Operations - Police Protection: $2,330,000 ($199.08)
Local Fire Protection: $1,480,000 ($126.45)Central Staff Services: $1,320,000 ($112.78)Sewerage: $1,034,000 ($88.35)Parks and Recreation: $806,000 ($68.87)General - Other: $716,000 ($61.18)Judicial and Legal Services: $653,000 ($55.79)Regular Highways: $533,000 ($45.54)Water Utilities: $495,000 ($42.29)Solid Waste Management: $435,000 ($37.17)Public Welfare - Other: $358,000 ($30.59)Protective Inspection and Regulation - Other: $268,000 ($22.90)Natural Resources - Other: $253,000 ($21.62)General Public Buildings: $198,000 ($16.92)Housing and Community Development: $146,000 ($12.47)Miscellaneous Commercial Activities - Other: $56,000 ($4.78)Health - Other: $18,000 ($1.54)General - Interest on Debt: $475,000 ($40.58)
Intergovernmental to Local - Other - Housing and Community Development: $27,000 ($2.31)
Other Capital Outlay - Police Protection: $81,000 ($6.92)
Parks and Recreation: $12,000 ($1.03)Total Salaries and Wages: $3,814,000 ($325.87)
Water Utilities - Interest on Debt: $90,000 ($7.69)
Lindon government finances - Revenue in 2018 (per resident):
Charges - Sewerage: $1,878,000 ($160.46)
Other: $1,481,000 ($126.54)Parks and Recreation: $872,000 ($74.50)Solid Waste Management: $415,000 ($35.46)Regular Highways: $66,000 ($5.64)Miscellaneous Commercial Activities: $37,000 ($3.16)Local Intergovernmental - General Local Government Support: $142,000 ($12.13)
Other: $5,000 ($0.43)Miscellaneous - General Revenue - Other: $3,336,000 ($285.03)
Fines and Forfeits: $560,000 ($47.85)Rents: $279,000 ($23.84)Interest Earnings: $204,000 ($17.43)Special Assessments: $109,000 ($9.31)Sale of Property: $46,000 ($3.93)Revenue - Water Utilities: $2,356,000 ($201.30)
State Intergovernmental - Highways: $444,000 ($37.94)
General Local Government Support: $11,000 ($0.94)Tax - General Sales and Gross Receipts: $4,243,000 ($362.53)
Property: $2,614,000 ($223.34)Public Utilities Sales: $1,606,000 ($137.22)Other Selective Sales: $597,000 ($51.01)Other License: $348,000 ($29.73)Occupation and Business License - Other: $70,000 ($5.98)
Lindon government finances - Debt in 2018 (per resident):
Long Term Debt - Outstanding Unspecified Public Purpose: $19,470,000 ($1663.53)
Beginning Outstanding - Unspecified Public Purpose: $19,249,000 ($1644.65)Outstanding Nonguaranteed - Industrial Revenue: $2,240,000 ($191.39)Beginning Outstanding - Public Debt for Private Purpose: $2,240,000 ($191.39)Issue, Unspecified Public Purpose: $1,285,000 ($109.79)Retired Unspecified Public Purpose: $1,064,000 ($90.91)
Lindon government finances - Cash and Securities in 2018 (per resident):
Bond Funds - Cash and Securities: $3,835,000 ($327.67)
Other Funds - Cash and Securities: $9,305,000 ($795.03)
Sinking Funds - Cash and Securities: $2,240,000 ($191.39)
8.12% of this county's 2021 resident taxpayers lived in other counties in 2020 ($71,824 average adjusted gross income )
Here:
8.12%Utah average:
7.95%
0.01% of residents moved from foreign countries ($102 average AGI )Utah County:
0.01%Utah average:
0.02%
Top counties from which taxpayers relocated into this county between 2020 and 2021:
7.26% of this county's 2020 resident taxpayers moved to other counties in 2021 ($74,329 average adjusted gross income )
Here:
7.26%Utah average:
7.39%
0.01% of residents moved to foreign countries ($122 average AGI )Utah County:
0.01%Utah average:
0.02%
Top counties to which taxpayers relocated from this county between 2020 and 2021:
Businesses in Lindon, UT
Name Count Name Count
AT&T 1 Sprint Nextel 1 Arby's 1 Subway 1 Discount Tire 1 T-Mobile 1 FedEx 2 UPS 1 Home Depot 1 Walmart 1 Lane Furniture 1 Wendy's 1
Strongest AM radio stations in Lindon:
KOVO (960 AM; 5 kW; PROVO, UT; Owner: MILLCREEK BROADCASTING LLC)
KIQN (1010 AM; 50 kW; TOOELE, UT)
KALL (700 AM; 50 kW; NORTH SALT LAKE CITY, UT; Owner: CITICASTERS LICENSES, L.P.)
KSL (1160 AM; 50 kW; SALT LAKE CITY, UT; Owner: BONNEVILLE HOLDING COMPANY)
KSRR (1400 AM; 1 kW; PROVO, UT; Owner: ROBERT MOREY)
KTKK (630 AM; 10 kW; SANDY, UT; Owner: UNITED BROADCASTING COMPANY)
KKDS (1060 AM; 10 kW; SOUTH SALT LAKE, UT; Owner: HOLIDAY BROADCASTING COMPANY)
KLLB (1510 AM; daytime; 10 kW; WEST JORDAN, UT; Owner: UNITED SECURITY FINANCIAL, INC.)
KWDZ (910 AM; 5 kW; SALT LAKE CITY, UT; Owner: ABC, INC.)
KBEE (860 AM; 10 kW; SALT LAKE CITY, UT; Owner: CITADEL BROADCASTING COMPANY)
KEYY (1450 AM; 1 kW; PROVO, UT; Owner: BIBLICAL MINISTRIES WORLDWIDE)
KBJA (1640 AM; 10 kW; SANDY, UT; Owner: UNITED BROADCASTING COMPANY, INC)
KFNZ (1320 AM; 5 kW; SALT LAKE CITY, UT; Owner: CITADEL BROADCASTING COMPANY)
Strongest FM radio stations in Lindon:
KQMB (102.7 FM; MIDVALE, UT; Owner: SIMMONS-SLC, LS, LLC)
KXRK (96.3 FM; PROVO, UT; Owner: SIMMONS-SLC, LS, LLC)
KENZ (107.5 FM; OREM, UT; Owner: CITADEL BROADCASTING COMPANY)
KZHT (94.9 FM; PROVO, UT; Owner: CITICASTERS LICENSES, L.P.)
K217CL (91.3 FM; PROVO, UT; Owner: STOCKTON CHRISTIAN LIFE COLLEGE, INC)
K264AC (100.7 FM; RURAL UTAH COUNTY, UT; Owner: SIMMONS-SLC, LS, LLC)
K208BZ (89.5 FM; SPANISH FORK, UT; Owner: BRIGHAM YOUNG UNIVERSITY)
KTCE (92.3 FM; PAYSON, UT; Owner: MOENKOPI COMMUNICATIONS, INC.)
KSOP-FM (104.3 FM; SALT LAKE CITY, UT; Owner: KSOP, INC.)
K272DP (102.3 FM; TOOELE, UT; Owner: FAMILY STATIONS, INC.)
KRCL (90.9 FM; SALT LAKE CITY, UT; Owner: LISTENERS COMMUNITY RADIO OF UTAH)
KBZN (97.9 FM; OGDEN, UT; Owner: CAPITOL BROADCASTING, INC.)
KCPX (105.7 FM; CENTERVILLE, UT; Owner: MERCURY BROADCASTING COMPANY, INC.)
KOSY-FM (106.5 FM; SPANISH FORK, UT; Owner: MERCURY BROADCASTING COMPANY, INC.)
KRSP-FM (103.5 FM; SALT LAKE CITY, UT; Owner: SIMMONS-SLC, LS, LLC)
KBER (101.1 FM; OGDEN, UT; Owner: CITADEL BROADCASTING COMPANY)
KISN-FM (97.1 FM; SALT LAKE CITY, UT; Owner: CLEAR CHANNEL BROADCASTING LICENSES, INC.)
KKAT (101.9 FM; OGDEN, UT; Owner: CITICASTERS LICENSES, L.P.)
KSFI (100.3 FM; SALT LAKE CITY, UT; Owner: SIMMONS-SLC, LS, LLC)
KUBL-FM (93.3 FM; SALT LAKE CITY, UT; Owner: CITADEL BROADCASTING COMPANY)
TV broadcast stations around Lindon:
KUTV (Channel 2; SALT LAKE CITY, UT; Owner: KUTV HOLDINGS, INC.)
KUPX (Channel 16; PROVO, UT; Owner: PAXSON SALT LAKE CITY LICENSE, INC.)
KCBU (Channel 32; PROVO, UT; Owner: GARY M. COCOLA FAMILY TRUST, GARY M. COCOLA TRUSTEE)
FCC Registered Antenna Towers: 3
Cornelius Whitehead, Approximately 400 Feet East-Southeast Of State St. And W. 500 N. (Lat: 40.346361 Lon: -111.724000), Type: 32.0, Structure height: 49049 m, Overall height: 30.4 m, Registrant: Atlas Tower 1- LLC, Cwhitehead@atlastowers.Com, , Bould-er, Phone: (303) 448-8896 Carri Wullner, Approximately 400 Feet East-Southeast Of State St. And W. 500 N. (Lat: 40.346361 Lon: -111.724000), Type: 32.0, Structure height: 49049 m, Overall height: 30.4 m, Registrant: Atlas Tower 1- LLC, Cwhitehead@atlastowers.Com, , Bould-er, Phone: (303) 448-8896 Carri Wullner, Approximately 400 Feet East-Southeast Of State St. And W. 500 N. (Lat: 40.346361 Lon: -111.724000), Type: 32.0, Structure height: 49049 m, Overall height: 30.4 m, Registrant: Atlas Tower 1- LLC, Cwhitehead@atlastowers.Com, , Bould-er, Phone: (303) 448-8896 FCC Registered Broadcast Land Mobile Towers: 5
MP 709.8, Mp 709.8 Provosub-Ded (Lat: 40.325944 Lon: -111.759111), Type: Bant, Structure height: 3 m, Overall height: 4 m, Call Sign: KNNT745, Assigned Frequencies: 160.965 MHz, 160.455 MHz, 160.740 MHz, Grant Date: 03/20/2021, Expiration Date: 04/30/2031, Certifier: L J Kopiasz, Registrant: Prokarma, 222 So 15th St. Suite 505 N, Omaha, NE 68102, Phone: (402) 522-5068, Fax: (402) 346-6676, Email:
Lat: 40.298944 Lon: -111.695611, Call Sign: WQEE938, Assigned Frequencies: 453.137 MHz, 458.137 MHz, Grant Date: 10/21/2015, Expiration Date: 01/10/2026, Certifier: Dan Peterson, Registrant: Federal License Management, 1784 E. 3rd Street Suite 269, Williamsport, PA 17701-3862, Phone: (570) 505-3894, Fax: (570) 651-9032, Email:
Lat: 40.349444 Lon: -111.752472, Call Sign: WQMD861, Assigned Frequencies: 451.287 MHz, 451.462 MHz, 451.737 MHz, 452.887 MHz, 456.287 MHz, Grant Date: 07/09/2010, Expiration Date: 07/09/2020, Cancellation Date: 09/12/2020, Certifier: Mike Houghton, Registrant: Mcintosh Communications, Inc., 2698 S. Redwood Rd., Ste. A, Salt Lake City, UT 84119, Phone: (801) 908-8808, Fax: (801) 908-7680, Email:
Lat: 40.330417 Lon: -111.735139, Call Sign: WQWI565, Assigned Frequencies: 464.887 MHz, 469.887 MHz, 464.887 MHz, 469.887 MHz, Grant Date: 09/01/2015, Expiration Date: 09/01/2025, Certifier: Casey Sorensen, Registrant: Action Communications, Inc., 2816 N Stone Ave., Tucson, AZ 85705-4503, Phone: (520) 792-0326, Email:
Lat: 40.340889 Lon: -111.738028, Call Sign: WRAJ983, Assigned Frequencies: 451.187 MHz, 456.187 MHz, 462.512 MHz, 467.512 MHz, 451.562 MHz, Grant Date: 12/11/2017, Expiration Date: 12/11/2027, Certifier: Tyler C Stott, Registrant: Lone Peak Licensing, LLC, Draper, UT 84020-1336, Phone: (801) 938-9346, Fax: (801) 938-9465, Email:
FCC Registered Microwave Towers: 14 (
See the full list of FCC Registered Microwave Towers in this town )
FCC Registered Amateur Radio Licenses: 224 (
See the full list of FCC Registered Amateur Radio Licenses in Lindon )
FAA Registered Aircraft: 11 (
See the full list of FAA Registered Aircraft in Lindon )
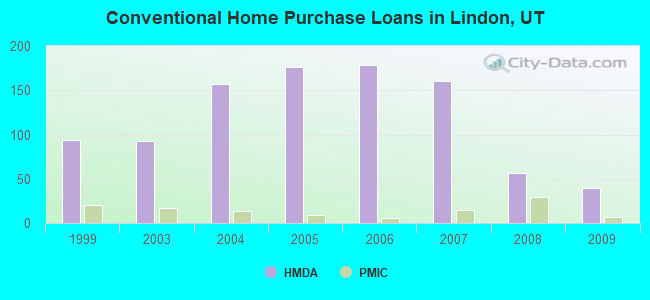
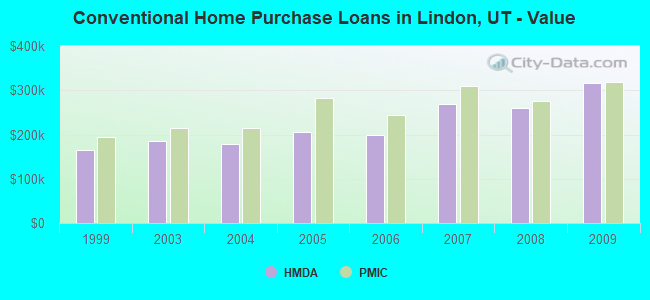
Home Mortgage Disclosure Act Aggregated Statistics For Year 2009(Based on 1 full and 1 partial tracts) A) FHA, FSA/RHS & VA B) Conventional C) Refinancings D) Home Improvement Loans F) Non-occupant Loans on G) Loans On Manufactured Number Average Value Number Average Value Number Average Value Number Average Value Number Average Value Number Average Value
LOANS ORIGINATED 25 $215,570 40 $316,538 315 $240,023 14 $162,479 10 $176,931 0 $0 APPLICATIONS APPROVED, NOT ACCEPTED 4 $206,750 8 $532,162 38 $212,364 0 $0 0 $0 0 $0 APPLICATIONS DENIED 3 $290,210 4 $537,528 80 $281,856 3 $71,077 5 $342,862 1 $206,920 APPLICATIONS WITHDRAWN 7 $218,534 3 $174,447 55 $285,198 1 $19,990 3 $117,857 0 $0 FILES CLOSED FOR INCOMPLETENESS 0 $0 4 $727,210 17 $242,438 0 $0 0 $0 0 $0
Aggregated Statistics For Year 2008(Based on 1 full and 1 partial tracts) A) FHA, FSA/RHS & VA B) Conventional C) Refinancings D) Home Improvement Loans F) Non-occupant Loans on G) Loans On Manufactured Number Average Value Number Average Value Number Average Value Number Average Value Number Average Value Number Average Value
LOANS ORIGINATED 16 $239,675 56 $259,809 200 $262,180 10 $95,544 12 $214,662 1 $143,940 APPLICATIONS APPROVED, NOT ACCEPTED 2 $268,440 15 $255,531 30 $237,142 1 $111,290 4 $279,388 0 $0 APPLICATIONS DENIED 6 $233,372 32 $229,444 91 $326,260 16 $113,784 15 $172,895 1 $31,680 APPLICATIONS WITHDRAWN 5 $246,452 10 $232,452 35 $283,100 2 $106,410 6 $226,973 1 $31,680 FILES CLOSED FOR INCOMPLETENESS 0 $0 4 $398,322 11 $497,094 1 $69,050 0 $0 0 $0
Aggregated Statistics For Year 2007(Based on 1 full and 1 partial tracts) A) FHA, FSA/RHS & VA B) Conventional C) Refinancings D) Home Improvement Loans F) Non-occupant Loans on G) Loans On Manufactured Number Average Value Number Average Value Number Average Value Number Average Value Number Average Value Number Average Value
LOANS ORIGINATED 3 $142,647 160 $268,029 232 $291,973 22 $188,639 25 $244,685 1 $140,940 APPLICATIONS APPROVED, NOT ACCEPTED 0 $0 38 $237,167 43 $264,235 2 $125,500 4 $254,398 0 $0 APPLICATIONS DENIED 0 $0 51 $271,163 98 $345,462 14 $130,629 8 $261,730 1 $139,940 APPLICATIONS WITHDRAWN 1 $137,940 17 $276,603 36 $327,596 5 $122,950 2 $140,445 0 $0 FILES CLOSED FOR INCOMPLETENESS 0 $0 5 $315,874 16 $238,972 1 $99,960 0 $0 0 $0
Aggregated Statistics For Year 2006(Based on 1 full and 1 partial tracts) A) FHA, FSA/RHS & VA B) Conventional C) Refinancings D) Home Improvement Loans F) Non-occupant Loans on G) Loans On Manufactured Number Average Value Number Average Value Number Average Value Number Average Value Number Average Value Number Average Value
LOANS ORIGINATED 2 $211,605 178 $199,698 226 $246,230 19 $84,896 33 $186,072 0 $0 APPLICATIONS APPROVED, NOT ACCEPTED 0 $0 17 $298,118 50 $221,015 3 $109,957 8 $240,490 0 $0 APPLICATIONS DENIED 0 $0 45 $257,067 97 $224,762 6 $92,272 12 $222,128 2 $125,950 APPLICATIONS WITHDRAWN 0 $0 23 $228,613 46 $186,629 3 $132,473 3 $159,270 0 $0 FILES CLOSED FOR INCOMPLETENESS 0 $0 8 $134,035 22 $252,027 0 $0 0 $0 0 $0
Aggregated Statistics For Year 2005(Based on 1 full and 1 partial tracts) A) FHA, FSA/RHS & VA B) Conventional C) Refinancings D) Home Improvement Loans F) Non-occupant Loans on G) Loans On Manufactured Number Average Value Number Average Value Number Average Value Number Average Value Number Average Value Number Average Value
LOANS ORIGINATED 5 $186,192 176 $204,660 249 $222,572 10 $79,796 38 $187,261 0 $0 APPLICATIONS APPROVED, NOT ACCEPTED 0 $0 36 $223,971 46 $194,076 1 $10,000 9 $211,617 0 $0 APPLICATIONS DENIED 0 $0 43 $218,319 88 $281,785 10 $83,729 10 $140,783 0 $0 APPLICATIONS WITHDRAWN 0 $0 39 $165,666 37 $197,740 2 $113,375 10 $152,552 0 $0 FILES CLOSED FOR INCOMPLETENESS 0 $0 7 $90,583 31 $165,766 1 $29,990 0 $0 1 $86,100
Aggregated Statistics For Year 2004(Based on 1 full and 1 partial tracts) A) FHA, FSA/RHS & VA B) Conventional C) Refinancings D) Home Improvement Loans E) Loans on Dwellings For 5+ Families F) Non-occupant Loans on G) Loans On Manufactured Number Average Value Number Average Value Number Average Value Number Average Value Number Average Value Number Average Value Number Average Value
LOANS ORIGINATED 5 $146,488 157 $177,874 293 $207,818 18 $56,668 1 $138,090 20 $172,884 2 $32,395 APPLICATIONS APPROVED, NOT ACCEPTED 0 $0 37 $241,156 63 $193,542 1 $7,000 0 $0 7 $171,646 0 $0 APPLICATIONS DENIED 2 $81,790 26 $179,517 97 $236,437 8 $57,515 0 $0 9 $165,360 1 $44,980 APPLICATIONS WITHDRAWN 1 $118,600 13 $182,922 57 $233,998 4 $95,275 0 $0 8 $176,889 0 $0 FILES CLOSED FOR INCOMPLETENESS 0 $0 1 $111,960 19 $192,747 2 $86,465 0 $0 0 $0 0 $0
Aggregated Statistics For Year 2003(Based on 1 full and 1 partial tracts) A) FHA, FSA/RHS & VA B) Conventional C) Refinancings D) Home Improvement Loans E) Loans on Dwellings For 5+ Families F) Non-occupant Loans on Number Average Value Number Average Value Number Average Value Number Average Value Number Average Value Number Average Value
LOANS ORIGINATED 11 $158,773 93 $185,870 681 $184,109 8 $42,796 1 $393,970 24 $149,810 APPLICATIONS APPROVED, NOT ACCEPTED 1 $128,340 12 $220,205 69 $241,679 3 $59,233 0 $0 2 $255,900 APPLICATIONS DENIED 2 $158,435 23 $195,130 120 $188,157 5 $39,574 0 $0 11 $166,642 APPLICATIONS WITHDRAWN 3 $116,277 8 $262,284 67 $182,794 1 $36,550 0 $0 2 $181,925 FILES CLOSED FOR INCOMPLETENESS 0 $0 2 $186,925 28 $203,754 0 $0 0 $0 0 $0
Aggregated Statistics For Year 1999(Based on 1 partial tract) A) FHA, FSA/RHS & VA B) Conventional C) Refinancings D) Home Improvement Loans F) Non-occupant Loans on Number Average Value Number Average Value Number Average Value Number Average Value Number Average Value
LOANS ORIGINATED 5 $153,352 94 $164,849 231 $157,747 18 $29,346 10 $124,386 APPLICATIONS APPROVED, NOT ACCEPTED 0 $0 12 $203,798 38 $150,497 3 $97,153 0 $0 APPLICATIONS DENIED 0 $0 18 $125,851 66 $141,137 6 $46,335 4 $76,900 APPLICATIONS WITHDRAWN 0 $0 24 $148,869 49 $156,739 8 $81,832 1 $169,500 FILES CLOSED FOR INCOMPLETENESS 0 $0 7 $150,279 24 $148,719 0 $0 1 $72,640
Detailed HMDA statistics for the following Tracts:
0006.01
, 0006.02
Private Mortgage Insurance Companies Aggregated Statistics For Year 2009(Based on 1 full and 1 partial tracts) A) Conventional B) Refinancings Number Average Value Number Average Value
LOANS ORIGINATED 7 $318,084 8 $280,308 APPLICATIONS APPROVED, NOT ACCEPTED 7 $307,056 5 $295,208 APPLICATIONS DENIED 0 $0 2 $386,845 APPLICATIONS WITHDRAWN 0 $0 3 $236,967 FILES CLOSED FOR INCOMPLETENESS 1 $275,890 0 $0
Aggregated Statistics For Year 2008(Based on 1 full and 1 partial tracts) A) Conventional B) Refinancings C) Non-occupant Loans on Number Average Value Number Average Value Number Average Value
LOANS ORIGINATED 29 $275,911 14 $341,337 1 $299,880 APPLICATIONS APPROVED, NOT ACCEPTED 9 $253,409 7 $316,084 1 $182,930 APPLICATIONS DENIED 3 $330,867 1 $156,770 2 $321,870 APPLICATIONS WITHDRAWN 0 $0 1 $481,810 0 $0 FILES CLOSED FOR INCOMPLETENESS 2 $388,945 1 $502,000 2 $502,000
Aggregated Statistics For Year 2007(Based on 1 full and 1 partial tracts) A) Conventional B) Refinancings C) Non-occupant Loans on Number Average Value Number Average Value Number Average Value
LOANS ORIGINATED 15 $310,019 12 $265,180 3 $203,393 APPLICATIONS APPROVED, NOT ACCEPTED 1 $362,850 2 $411,200 0 $0 APPLICATIONS DENIED 0 $0 2 $263,895 0 $0 APPLICATIONS WITHDRAWN 0 $0 2 $362,265 0 $0 FILES CLOSED FOR INCOMPLETENESS 1 $213,910 1 $101,540 1 $101,540
Aggregated Statistics For Year 2006(Based on 1 full and 1 partial tracts) A) Conventional B) Refinancings C) Non-occupant Loans on Number Average Value Number Average Value Number Average Value
LOANS ORIGINATED 6 $244,312 10 $238,067 3 $266,560 APPLICATIONS APPROVED, NOT ACCEPTED 1 $416,830 0 $0 0 $0 APPLICATIONS DENIED 0 $0 0 $0 0 $0 APPLICATIONS WITHDRAWN 0 $0 1 $367,850 0 $0 FILES CLOSED FOR INCOMPLETENESS 0 $0 0 $0 0 $0
Aggregated Statistics For Year 2005(Based on 1 full and 1 partial tracts) A) Conventional B) Refinancings C) Non-occupant Loans on Number Average Value Number Average Value Number Average Value
LOANS ORIGINATED 9 $282,930 17 $248,051 3 $272,337 APPLICATIONS APPROVED, NOT ACCEPTED 1 $205,920 2 $222,570 0 $0 APPLICATIONS DENIED 0 $0 0 $0 0 $0 APPLICATIONS WITHDRAWN 0 $0 3 $258,317 0 $0 FILES CLOSED FOR INCOMPLETENESS 0 $0 0 $0 0 $0
Aggregated Statistics For Year 2004(Based on 1 full and 1 partial tracts) A) Conventional B) Refinancings C) Non-occupant Loans on Number Average Value Number Average Value Number Average Value
LOANS ORIGINATED 13 $215,230 23 $221,407 4 $223,410 APPLICATIONS APPROVED, NOT ACCEPTED 4 $180,242 6 $277,322 1 $129,950 APPLICATIONS DENIED 1 $262,890 2 $177,190 0 $0 APPLICATIONS WITHDRAWN 1 $190,890 4 $299,142 2 $236,405 FILES CLOSED FOR INCOMPLETENESS 0 $0 2 $161,240 0 $0
Aggregated Statistics For Year 2003(Based on 1 full and 1 partial tracts) A) Conventional B) Refinancings C) Non-occupant Loans on Number Average Value Number Average Value Number Average Value
LOANS ORIGINATED 17 $215,508 56 $202,128 2 $216,915 APPLICATIONS APPROVED, NOT ACCEPTED 3 $196,877 20 $218,626 0 $0 APPLICATIONS DENIED 1 $220,910 4 $196,308 0 $0 APPLICATIONS WITHDRAWN 1 $539,780 6 $178,618 1 $145,940 FILES CLOSED FOR INCOMPLETENESS 0 $0 0 $0 0 $0
Aggregated Statistics For Year 1999(Based on 1 partial tract) A) Conventional B) Refinancings C) Non-occupant Loans on Number Average Value Number Average Value Number Average Value
LOANS ORIGINATED 20 $195,278 28 $178,623 1 $161,420 APPLICATIONS APPROVED, NOT ACCEPTED 1 $142,590 5 $224,558 0 $0 APPLICATIONS DENIED 0 $0 0 $0 0 $0 APPLICATIONS WITHDRAWN 2 $144,385 3 $218,520 0 $0 FILES CLOSED FOR INCOMPLETENESS 0 $0 0 $0 0 $0
Detailed PMIC statistics for the following Tracts:
0006.01
, 0006.02
Most common first names in Lindon, UT among deceased individuals Name Count Lived (average)
Betty 5 66.4 years Ila 4 84.0 years Dorothy 4 81.8 years Helen 4 80.5 years Clarence 3 80.0 years Alice 3 83.3 years John 3 62.3 years Evelyn 3 85.0 years Irene 3 82.0 years Elma 3 86.0 years
Most common last names in Lindon, UT among deceased individuals Last name Count Lived (average)
Gillman 6 82.8 years Smith 6 74.0 years Hooley 5 83.8 years Johnson 5 86.2 years Walker 5 78.8 years Atwood 3 90.3 years Allen 3 84.7 years Clark 3 72.3 years Hansen 3 85.3 years Nelson 3 81.0 years
Lindon compared to Utah state average:
Unemployed percentage below state average. Hispanic race population percentage below state average. Median age below state average. Renting percentage below state average. Length of stay since moving in significantly above state average. Number of rooms per house above state average. House age below state average. Percentage of population with a bachelor's degree or higher above state average.
#20 on the list of "Top 100 cities with biggest houses (pop. 5,000+)"
#24 on the list of "Top 101 cities with the most cars per house, population 5,000+"
#31 on the list of "Top 101 cities with the highest percentage of family households, population 10,000+"
#79 on the list of "Top 101 cities with the largest percentage of people in schools, hospitals, or wards for the mentally retarded (population 1,000+)"
#81 on the list of "Top 100 cities with highest median household income and median resident age less than 35 (pop. 5,000+)"
#2 (84604) on the list of "Top 101 zip codes with the largest charity contributions deductions as a percentage of AGI in 2012 (pop 5,000+)"
#17 (84604) on the list of "Top 101 zip codes with the largest percentage of Danish first ancestries (pop 5,000+)"
#36 (84604) on the list of "Top 101 zip codes with the largest percentage of English first ancestries (pop 5,000+)"
#69 (84042) on the list of "Top 101 zip codes with the largest percentage of Welsh first ancestries (pop 5,000+)"
#1 on the list of "Top 101 counties with the lowest percentage of residents that smoked 100+ cigarettes in their lives"
#1 on the list of "Top 101 counties with highest percentage of residents voting for Romney (Republican) in the 2012 Presidential Election (pop. 50,000+)"
#1 on the list of "Top 101 counties with the highest number of births per 1000 residents 2007-2013"
#2 on the list of "Top 101 counties with the most Other adherents"
#2 on the list of "Top 101 counties with the most Other congregations"
Top Patent Applicants
J. Daniel Belnap (31)
Douglas Howard Dobyns (23)
Anton E. Bowden (11)
Jack Reese (11)
Michael Fairbanks (10)
Matthew T. Peterson (10)
Feng Yu (10)
Craig Cheney (8)
Gary G. Otterstrom (6)
Carl Paul Ballard (5)
Total of 319 patent applications in 2008-2024.


 Recent articles from our blog. Our writers, many of them Ph.D. graduates or candidates, create easy-to-read articles on a wide variety of topics.

 (2.9 miles
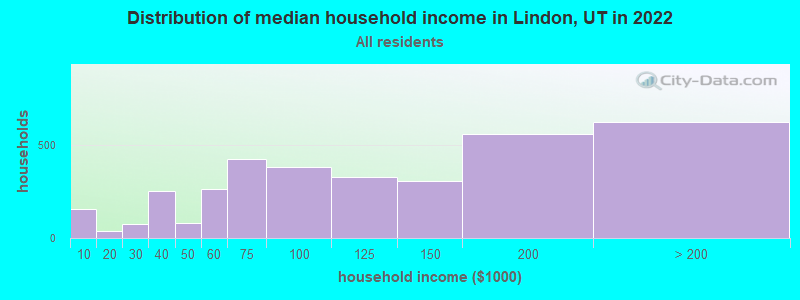
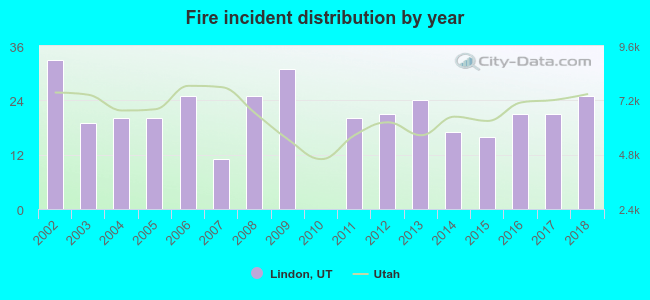 According to the data from the years 2002 - 2018 the average number of fire incidents per year is 21. The highest number of fire incidents - 33 took place in 2002, and the least - 0 in 2010. The data has a decreasing trend.
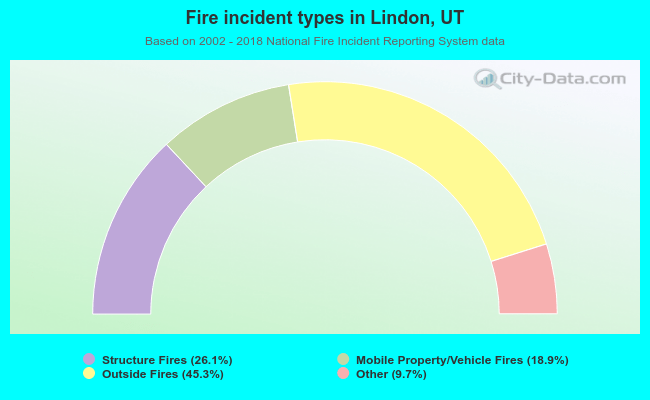 When looking into fire subcategories, the most reports belonged to: Outside Fires (45.3%), and Structure Fires (26.1%).