Estimated zip code population in 2022: 30,460 Zip code population in 2010: 25,212 Zip code population in 2000: 22,239
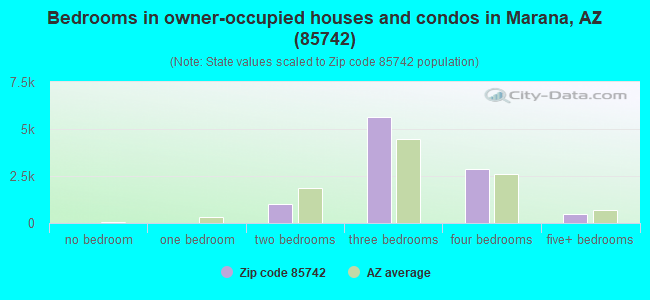
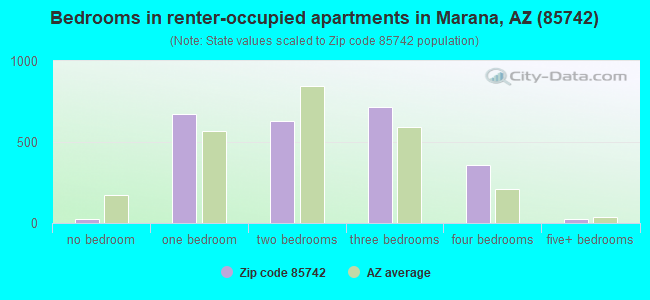
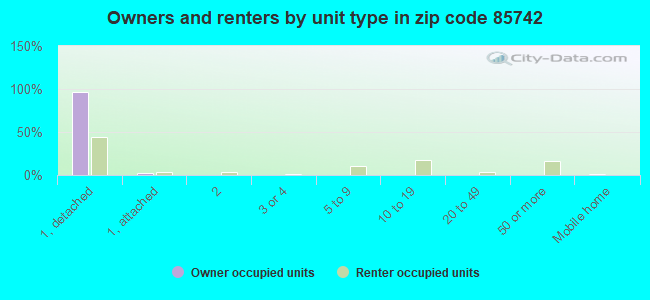
Houses and condos: 12,724 Renter-occupied apartments: 2,423
% of renters here:
20%
State:
33%
March 2022 cost of living index in zip code 85742: 91.7 (less than average, U.S. average is 100)
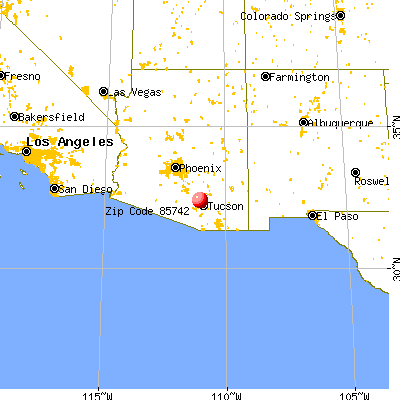
Land area: 28.7 sq. mi. Water area: 0.1 sq. mi.
Population density: 1,060 people per square mile
(low).
OSM Map
General Map
Google Map
MSN Map
OSM Map
General Map
Google Map
MSN Map
OSM Map
General Map
Google Map
MSN Map
OSM Map
General Map
Google Map
MSN Map
Please wait while loading the map...
Real estate property taxes paid for housing units in 2022:
This zip code:
0.7% ($2,612)
Arizona:
0.4% ($1,786)
Median real estate property taxes paid for housing units with mortgages in 2022: $2,613 (0.7%) Median real estate property taxes paid for housing units with no mortgage in 2022: $2,625 (0.7%)
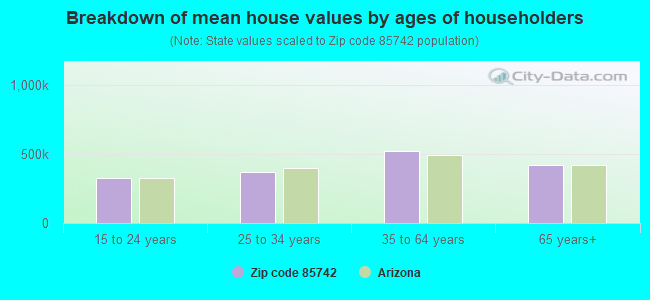
Estimated median house/condo value in 2022: $367,709
85742:
$367,709
Arizona:
$402,800
According to our research of Arizona and other state lists, there were 20 registered sex offenders living in 85742 zip code as of April 27, 2024. The ratio of all residents to sex offenders in zip code 85742 is 1,361 to 1. The ratio of registered sex offenders to all residents in this zip code is lower than the state average.
Median resident age:
This zip code:
42.5 years
Arizona median age:
38.8 years
Average household size:
This zip code:
2.5 people
Arizona:
2.5 people
Averages for the 2020 tax year for zip code 85742, filed in 2021:
Average Adjusted Gross Income (AGI) in 2020: $79,323 (Individual Income Tax Returns)
Here:
$79,323
State:
$73,499
Salary/wage: $67,000 (reported on 79.7% of returns)
Here:
$67,000
State:
$59,499
(% of AGI for various income ranges: 1126.2% for AGIs below $25k, 3602.3% for AGIs $25k-50k, 6576.1% for AGIs $50k-75k, 9770.3% for AGIs $75k-100k, 18257.2% for AGIs $100k-200k, 64546.4% for AGIs over 200k)
Taxable interest for individuals: $1,434 (reported on 30.6% of returns)
This zip code:
$1,434
Arizona:
$2,325
(% of AGI for various income ranges: 20.4% for AGIs below $25k, 22.1% for AGIs $25k-50k, 40.1% for AGIs $50k-75k, 83.1% for AGIs $75k-100k, 108.9% for AGIs $100k-200k, 772.1% for AGIs over 200k)
Ordinary dividends: $6,641 (reported on 21.7% of returns)
Here:
$6,641
State:
$8,711
(% of AGI for various income ranges: 39.9% for AGIs below $25k, 47.9% for AGIs $25k-50k, 111.0% for AGIs $50k-75k, 154.0% for AGIs $75k-100k, 416.2% for AGIs $100k-200k, 3353.6% for AGIs over 200k)
Net capital gain/loss in AGI: +$15,811 (reported on 20.3% of returns)
Here:
+$15,811
State:
+$31,332
(% of AGI for various income ranges: 17.0% for AGIs below $25k, 34.0% for AGIs $25k-50k, 74.8% for AGIs $50k-75k, 164.3% for AGIs $75k-100k, 689.1% for AGIs $100k-200k, 11785.4% for AGIs over 200k)
Profit/loss from business: +$14,585 (reported on 14.6% of returns)
Here:
+$14,585
State:
+$13,214
(% of AGI for various income ranges: 96.8% for AGIs below $25k, 148.9% for AGIs $25k-50k, 188.2% for AGIs $50k-75k, 172.1% for AGIs $75k-100k, 601.2% for AGIs $100k-200k, 3980.7% for AGIs over 200k)
Taxable individual retirement arrangement distribution: $22,340 (reported on 11.1% of returns)
85742:
$22,340
Arizona:
$23,364
(% of AGI for various income ranges: 74.9% for AGIs below $25k, 121.9% for AGIs $25k-50k, 245.7% for AGIs $50k-75k, 380.0% for AGIs $75k-100k, 940.1% for AGIs $100k-200k, 3300.0% for AGIs over 200k)
Self-employed (Keogh) retirement plans: $19,417 (reported on 0.4% of returns)
85742:
$19,417
Arizona:
$26,938
(% of AGI for various income ranges: 22.0% for AGIs $100k-200k, 298.9% for AGIs over 200k)
Total itemized deductions: $33,597 (reported on 10.5% of returns)
Here:
$33,597
State:
$36,308
(% of AGI for various income ranges: 69.9% for AGIs below $25k, 139.7% for AGIs $25k-50k, 316.0% for AGIs $50k-75k, 491.3% for AGIs $75k-100k, 1105.7% for AGIs $100k-200k, 7111.1% for AGIs over 200k)
Charity contributions: $8,608 (reported on 8.7% of returns)
Here:
$8,608
State:
$11,955
(% of AGI for various income ranges: 4.6% for AGIs below $25k, 13.2% for AGIs $25k-50k, 34.1% for AGIs $50k-75k, 73.8% for AGIs $75k-100k, 245.5% for AGIs $100k-200k, 2018.2% for AGIs over 200k)
Taxes paid: $7,057 (reported on 10.5% of returns)
85742:
$7,057
State:
$6,820
(% of AGI for various income ranges: 9.8% for AGIs below $25k, 22.8% for AGIs $25k-50k, 63.7% for AGIs $50k-75k, 117.9% for AGIs $75k-100k, 282.3% for AGIs $100k-200k, 1288.9% for AGIs over 200k)
Earned income credit: $2,027 (reported on 10.9% of returns)
Here:
$2,027
State:
$2,383
(% of AGI for various income ranges: 63.6% for AGIs below $25k, 57.8% for AGIs $25k-50k, 1.1% for AGIs $50k-75k)
Percentage of individuals using paid preparers for their 2020 taxes: 93.4%
Here:
93%
State:
93%
(% for various income ranges: 91.8% for AGIs below $25k, 94.0% for AGIs $25k-50k, 93.9% for AGIs $50k-75k, 94.0% for AGIs $75k-100k, 93.2% for AGIs $100k-200k, 95.2% for AGIs over 200k)
Averages for the 2012 tax year for zip code 85742, filed in 2013:
Average Adjusted Gross Income (AGI) in 2012: $60,226 (Individual Income Tax Returns)
Here:
$60,226
State:
$57,644
Salary/wage: $52,716 (reported on 84.0% of returns)
Here:
$52,716
State:
$47,932
(% of AGI for various income ranges: 74.6% for AGIs below $25k, 78.8% for AGIs $25k-50k, 76.7% for AGIs $50k-75k, 78.2% for AGIs $75k-100k, 76.4% for AGIs $100k-200k, 53.6% for AGIs over 200k)
Taxable interest for individuals: $1,383 (reported on 33.4% of returns)
This zip code:
$1,383
Arizona:
$2,064
(% of AGI for various income ranges: 1.6% for AGIs below $25k, 0.7% for AGIs $25k-50k, 0.6% for AGIs $50k-75k, 0.5% for AGIs $75k-100k, 0.6% for AGIs $100k-200k, 1.2% for AGIs over 200k)
Ordinary dividends: $5,028 (reported on 20.8% of returns)
Here:
$5,028
State:
$7,268
(% of AGI for various income ranges: 2.3% for AGIs below $25k, 1.3% for AGIs $25k-50k, 1.3% for AGIs $50k-75k, 0.8% for AGIs $75k-100k, 1.4% for AGIs $100k-200k, 4.2% for AGIs over 200k)
Net capital gain/loss in AGI: +$7,720 (reported on 16.6% of returns)
Here:
+$7,720
State:
+$15,530
(% of AGI for various income ranges: 0.1% for AGIs $25k-50k, 0.2% for AGIs $50k-75k, 0.5% for AGIs $75k-100k, 1.3% for AGIs $100k-200k, 10.7% for AGIs over 200k)
Profit/loss from business: +$10,887 (reported on 14.6% of returns)
Here:
+$10,887
State:
+$12,323
(% of AGI for various income ranges: 6.4% for AGIs below $25k, 2.9% for AGIs $25k-50k, 2.2% for AGIs $50k-75k, 2.1% for AGIs $75k-100k, 2.1% for AGIs $100k-200k, 2.9% for AGIs over 200k)
Taxable individual retirement arrangement distribution: $15,942 (reported on 11.2% of returns)
85742:
$15,942
Arizona:
$18,280
(% of AGI for various income ranges: 3.7% for AGIs below $25k, 2.6% for AGIs $25k-50k, 2.6% for AGIs $50k-75k, 2.9% for AGIs $75k-100k, 3.1% for AGIs $100k-200k, 3.1% for AGIs over 200k)
Self-employment retirement plans: $19,400 (reported on 0.4% of returns)
85742:
$19,400
Arizona:
$22,154
Total itemized deductions: $20,384 (22% of AGI, reported on 42.7% of returns)
Here:
$20,384
State:
$23,651
Here:
21.8% of AGI
State:
20.6% of AGI
(% of AGI for various income ranges: 13.9% for AGIs below $25k, 14.3% for AGIs $25k-50k, 15.2% for AGIs $50k-75k, 15.2% for AGIs $75k-100k, 14.8% for AGIs $100k-200k, 12.5% for AGIs over 200k)
Charity contributions: $3,130 (reported on 36.3% of returns)
Here:
$3,130
State:
$4,114
(% of AGI for various income ranges: 1.0% for AGIs below $25k, 1.4% for AGIs $25k-50k, 1.7% for AGIs $50k-75k, 1.9% for AGIs $75k-100k, 2.3% for AGIs $100k-200k, 2.1% for AGIs over 200k)
Taxes paid: $5,682 (reported on 42.5% of returns)
85742:
$5,682
State:
$6,509
(% of AGI for various income ranges: 2.6% for AGIs below $25k, 3.1% for AGIs $25k-50k, 3.6% for AGIs $50k-75k, 4.0% for AGIs $75k-100k, 4.6% for AGIs $100k-200k, 4.8% for AGIs over 200k)
Earned income credit: $2,073 (reported on 13.1% of returns)
Here:
$2,073
State:
$2,432
(% of AGI for various income ranges: 4.6% for AGIs below $25k, 1.0% for AGIs $25k-50k)
Percentage of individuals using paid preparers for their 2012 taxes: 45.5%
Here:
46%
State:
52%
(% for various income ranges: 39.6% for AGIs below $25k, 44.6% for AGIs $25k-50k, 48.0% for AGIs $50k-75k, 48.9% for AGIs $75k-100k, 51.6% for AGIs $100k-200k, 64.3% for AGIs over 200k)
Averages for the 2004 tax year for zip code 85742, filed in 2005:
Average Adjusted Gross Income (AGI) in 2004: $54,387 (Individual Income Tax Returns)
Here:
$54,387
State:
$50,097
Salary/wage: $47,900 (reported on 85.9% of returns)
Here:
$47,900
State:
$42,146
(% of AGI for various income ranges: 116.0% for AGIs below $10k, 77.6% for AGIs $10k-25k, 81.3% for AGIs $25k-50k, 84.0% for AGIs $50k-75k, 83.0% for AGIs $75k-100k, 61.8% for AGIs over 100k)
Taxable interest for individuals: $1,582 (reported on 49.1% of returns)
This zip code:
$1,582
Arizona:
$2,374
(% of AGI for various income ranges: 9.6% for AGIs below $10k, 2.5% for AGIs $10k-25k, 1.5% for AGIs $25k-50k, 0.9% for AGIs $50k-75k, 1.0% for AGIs $75k-100k, 1.6% for AGIs over 100k)
Taxable dividends: $3,292 (reported on 26.0% of returns)
Here:
$3,292
State:
$3,888
(% of AGI for various income ranges: 5.2% for AGIs below $10k, 1.7% for AGIs $10k-25k, 1.4% for AGIs $25k-50k, 0.9% for AGIs $50k-75k, 1.1% for AGIs $75k-100k, 2.3% for AGIs over 100k)
Net capital gain/loss: +$15,821 (reported on 22.0% of returns)
Here:
+$15,821
State:
+$17,569
(% of AGI for various income ranges: -2.0% for AGIs below $10k, -0.2% for AGIs $10k-25k, 0.9% for AGIs $25k-50k, 0.9% for AGIs $50k-75k, 1.1% for AGIs $75k-100k, 17.0% for AGIs over 100k)
Profit/loss from business: +$8,948 (reported on 15.9% of returns)
Here:
+$8,948
State:
+$11,088
(% of AGI for various income ranges: 12.0% for AGIs below $10k, 4.8% for AGIs $10k-25k, 2.2% for AGIs $25k-50k, 2.7% for AGIs $50k-75k, 1.9% for AGIs $75k-100k, 2.5% for AGIs over 100k)
IRA payment deduction: $2,984 (reported on 2.9% of returns)
85742:
$2,984
Arizona:
$3,023
(% of AGI for various income ranges: 0.3% for AGIs $10k-25k, 0.3% for AGIs $25k-50k, 0.2% for AGIs $50k-75k, 0.1% for AGIs $75k-100k, 0.1% for AGIs over 100k)
Self-employed pension: $8,966 (reported on 0.5% of returns)
Here:
$8,966
Arizona:
$15,785
(% of AGI for various income ranges: 0.1% for AGIs $25k-50k, 0.1% for AGIs $50k-75k, 0.1% for AGIs $75k-100k, 0.2% for AGIs over 100k)
Total itemized deductions: $17,486 (22% of AGI, reported on 52.3% of returns)
Here:
$17,486
State:
$19,781
Here:
22.1% of AGI
State:
21.8% of AGI
(% of AGI for various income ranges: 25.0% for AGIs below $10k, 16.2% for AGIs $10k-25k, 18.9% for AGIs $25k-50k, 18.6% for AGIs $50k-75k, 17.5% for AGIs $75k-100k, 14.1% for AGIs over 100k)
Charity contributions deductions: $2,740 (3% of AGI, reported on 47.2% of returns)
Here:
$2,740
State:
$3,389
Here:
3.4% of AGI
State:
3.5% of AGI
(% of AGI for various income ranges: 1.3% for AGIs below $10k, 1.5% for AGIs $10k-25k, 2.2% for AGIs $25k-50k, 2.3% for AGIs $50k-75k, 2.3% for AGIs $75k-100k, 2.7% for AGIs over 100k)
Total tax: $7,314 (reported on 81.2% of returns)
85742:
$7,314
State:
$8,323
(% of AGI for various income ranges: 3.8% for AGIs below $10k, 4.2% for AGIs $10k-25k, 6.4% for AGIs $25k-50k, 8.3% for AGIs $50k-75k, 9.9% for AGIs $75k-100k, 16.7% for AGIs over 100k)
Earned income credit: $1,593 (reported on 9.8% of returns)
Here:
$1,593
State:
$1,786
Percentage of individuals using paid preparers for their 2004 taxes: 53.7%
Here:
54%
State:
60%
(% for various income ranges: 45.6% for AGIs below $10k, 51.6% for AGIs $10k-25k, 54.9% for AGIs $25k-50k, 56.8% for AGIs $50k-75k, 52.5% for AGIs $75k-100k, 61.5% for AGIs over 100k)
Likely homosexual households (counted as self-reported same-sex unmarried-partner households)
Lesbian couples: 0.1% of all households
Gay men: 0.1% of all households
Household received Food Stamps/SNAP in the past 12 months: 606 Household did not receive Food Stamps/SNAP in the past 12 months: 11,720
Women who had a birth in the past 12 months: 311 (163 now married, 145 unmarried) Women who did not have a birth in the past 12 months: 6,699 (3,013 now married, 3,673 unmarried)
Housing units in zip code 85742 with a mortgage: 7,134 (552 second mortgage, 14 home equity loan, 461 both second mortgage and home equity loan) Houses without a mortgage: 62
Median monthly owner costs for units with a mortgage: $1,636 Median monthly owner costs for units without a mortgage: $537
Residents with income below the poverty level in 2022:
This zip code:
6.5%
Whole state:
12.5%
Residents with income below 50% of the poverty level in 2022:
This zip code:
2.0%
Whole state:
6.0%
Median number of rooms in houses and condos:
Here:
6.2
State:
6.0
Median number of rooms in apartments:
Here:
4.3
State:
4.1
Notable locations in this zip code not listed on our city pages
Notable locations in zip code 85742: Palo Ferro Ranch (A), Bonnie Brae Ranch (B), Jurko Ranch (C), Tucson Electric Power Company North Loop Generating Station (D), Omni Tucson National Golf Resort (E), Crooked Tree Golf Course (F), Estrellita Ranch (G), Oasis Ranch (H), Sabino Railroad Station (I), Plata Railroad Station (J), Cortaro Railroad Station (K). Display/hide their locations on the map
Churches in zip code 85742 include: Saint Elizabeth Ann Seton Church (A), New Life Baptist Fellowship Church (B), Grace Community Covenant Church (C), Foothills Community Church (D), Desert Son Community Church (E), Desert Foothills Baptist Church (F), Cortaro Vista Community Church (G), Capilla Del Sol Christian Church (H), Canyon Del Oro Assembly of God (I). Display/hide their locations on the map
3,696 married couples with children.
1,662 single-parent households (251 men, 1,411 women).
84.4% of residents of 85742 zip code speak English at home.
12.6% of residents speak Spanish at home (85% very well, 11% well, 4% not well, 1% not at all).
1.2% of residents speak other Indo-European language at home (96% very well, 4% well).
1.5% of residents speak Asian or Pacific Island language at home (62% very well, 38% well).
0.4% of residents speak other language at home (100% very well).
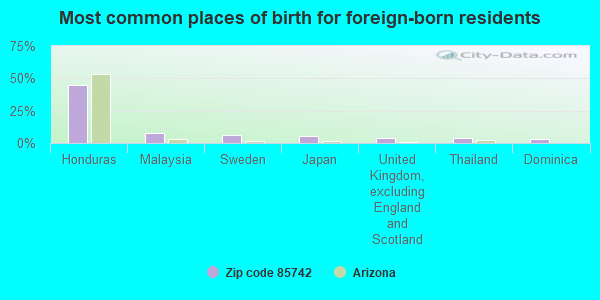
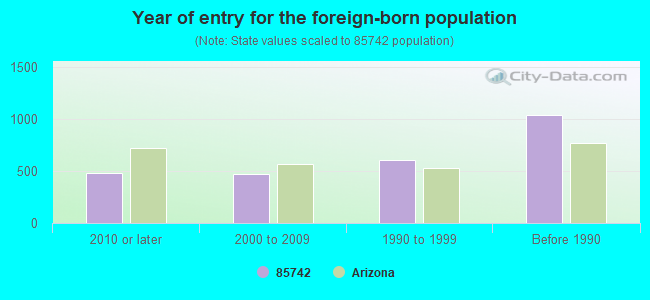
Foreign born population: 2,168 (7.1%) (65.9% of them are naturalized citizens)
Facilities with environmental interests located in this zip code:
DEGRAZIA ELEMENTARY SCHOOL (5051 W OVERTON RD in TUCSON, AZ)
(National Center for Education Statistics) - STATE ID-111 Organizations: MARANA UNIFIED DISTRICT (SCHOOL DISTRICT)
DECKER COMMUNITY WATER (10611 N DECKER DR in TUCSON, AZ)
(Integrated Compliance Information System) - ICIS-09-2000-0159, FORMAL ENFORCEMENT ACTION Business SIC classification: WATER SUPPLY
Housing units lacking complete plumbing facilities: 0.0% Housing units lacking complete kitchen facilities: 0.6%
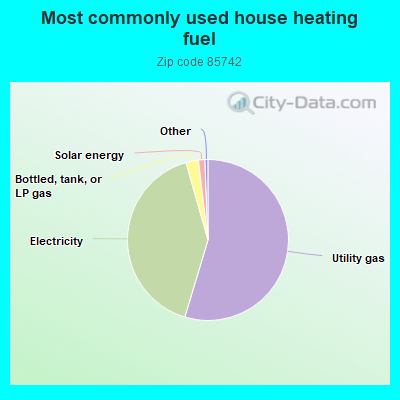
54.6%Utility gas
40.9%Electricity
2.5%Bottled, tank, or LP gas
1.3%Solar energy
Place of birth for U.S.-born residents:
This state: 12,077
Northeast: 2,445
Midwest: 4,804
South: 2,969
West: 5,432
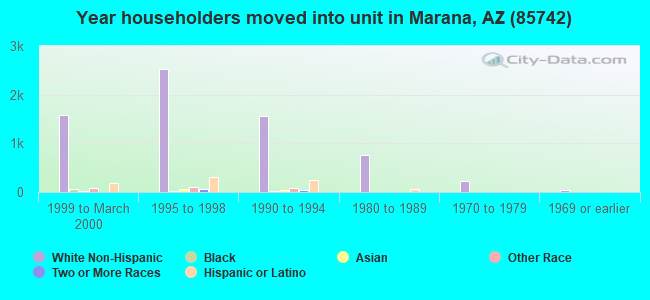
45% of the 85742 zip code residents lived in the same house 5 years ago. Out of people who lived in different houses, 59% lived in this county. Out of people who lived in different counties, 50% lived in Arizona.
89% of the 85742 zip code residents lived in the same house 1 year ago. Out of people who lived in different houses, 57% moved from this county. Out of people who lived in different houses, 11% moved from different county within same state. Out of people who lived in different houses, 32% moved from different state. Out of people who lived in different houses, 2% moved from abroad.
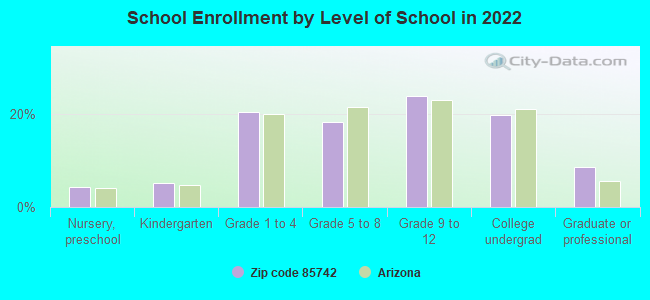
Private vs. public school enrollment:
Students in private schools in grades 1 to 8 (elementary and middle school): 350
Here:
13.0%
Arizona:
10.4%
Students in private schools in grades 9 to 12 (high school): 142
Here:
8.6%
Arizona:
8.8%
Students in private undergraduate colleges: 106
Here:
7.7%
Arizona:
13.1%
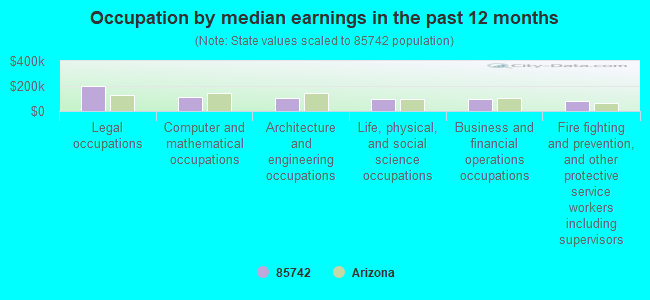
Occupation by median earnings in the past 12 months ($)
203,935Legal occupations
108,107Computer and mathematical occupations
103,790Architecture and engineering occupations
97,363Life, physical, and social science occupations
94,719Business and financial operations occupations
80,139Fire fighting and prevention, and other protective service workers including supervisors
Companies with federal contracts located in this zip code (TUCSON, AZ):
LARRY E SAYRE, PH D (4786 W DIDION DRIVE; small business) : $496,189 in 13 contractsfrom 2000 to 2006
Contracts for Psychiatry Services by Air Force Signed by year:2000: $49,920; 2001: $49,920; 2002: $49,920; 2003: $72,320; 2004: $63,878; 2005: $197,191; 2006: $13,040.
Biggest contracts:
$204,595 with Air Force for Psychiatry Services. Signed on 2005-10-01. Completion date: 2006-09-30.
$94,894, same as above.Signed on 2005-02-01. Completion date: 2005-09-30.
$72,320, same as above.Signed on 2003-10-01. Completion date: 2004-09-30.
$49,920, same as above.Signed on 2002-10-01. Completion date: 2003-09-30.
NATURAL SPI, INC (9332 N CAMINO DE PLAZA; small business) : $99,990 in 2 contractsfrom 2005 to 2006
$71,182 with Navy for Engineering and Technical Services. Signed on 2005-08-09. Completion date: 2006-03-31.
$28,808, same as above.Signed on 2006-03-31. Completion date: 2006-03-31.
GLANDON ENTERPRISES (5451 W CORTARO FARMS RD; small business) : $68,226 in 5 contractsfrom 2002 to 2005
Contracts for Maintenance, Repair and Rebuilding of Equipment -- Recreational and Athletic Equipment, Landscaping/Groundskeeping Services by Air Force Signed by year:2000: $0; 2001: $0; 2002: $19,425; 2003: $15,480; 2004: $16,254; 2005: $17,067; 2006: $0.
Biggest contracts:
$19,425 with Air Force for Maintenance, Repair and Rebuilding of Equipment -- Recreational and Athletic Equipment. Signed on 2002-10-01. Completion date: 2003-09-30.
$17,067 with Air Force for Landscaping/Groundskeeping Services. Signed on 2005-10-01. Completion date: 2006-09-30.
$16,254, same as above.Signed on 2004-10-01. Completion date: 2005-09-30.
$15,480, same as above.Signed on 2003-10-01. Completion date: 2004-09-30.
CR ADVISING (8470 N PLACITA DE LA MANZ; small business) : $26,150 in 4 contractsfrom 2003 to 2006
$19,135 with Air Force for Program Management/Support Services. Signed on 2004-11-01. Completion date: 2005-09-30.
$19,131 with Air Force for Education Services. Signed on 2003-10-01. Completion date: 2004-09-30.
-$4,137 with Air Force for Program Management/Support Services. Signed on 2005-01-31. Completion date: 2005-09-30.
-$7,979, same as above.Signed on 2006-05-25. Completion date: 2005-09-30.
MARTINEZ,MICHAEL A (8650 N SHANNON RD; small business)
$18,000 with Air Force for Chaplain Services. Signed on 2005-10-01. Completion date: 2006-09-30.
ENTREPOT INTERNATIONAL INC (9777 N THORNY DALE RD ST; small business) : -$18,970 in 2 contractsin 2004
$0 with Air Force for Miscellaneous Items. Taking place in CO. Signed on 2004-01-07. Completion date: 2004-01-30.
-$18,970, same as above.Signed on 2004-01-07. Completion date: 2004-01-30.
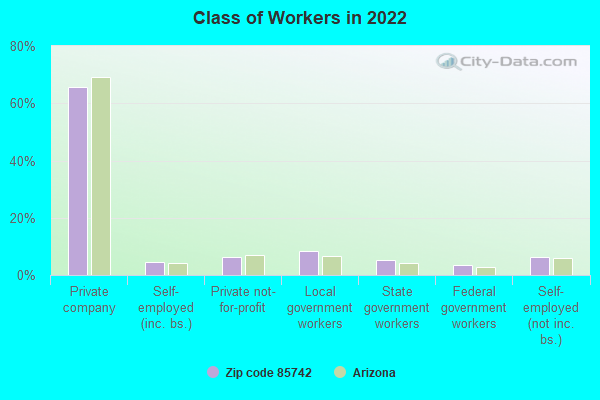
Top industries in this zip code by the number of employees in 2005:
Other Services (except Public Administration): Religious Organizations (100-249 employees: 1 establishment, 20-49 employees: 1 establishment, 10-19 employees: 3 establishments, 5-9 employees: 3 establishments, 1-4 employees: 2 establishments)
Arts, Entertainment, and Recreation: Racetracks (100-249: 1)
Administrative and Support and Waste Management and Remediation Services: Landscaping Services (50-99: 1, 20-49: 1, 10-19: 2, 5-9: 3, 1-4: 2)
2003 - 2018 National Fire Incident Reporting System (NFIRS) incidents
Based on the data from the years 2003 - 2018 the average number of fires per year is 30. The highest number of reported fires - 58 took place in 2005, and the least - 1 in 2008. The data has a growing trend.
When looking into fire subcategories, the most incidents belonged to: Outside Fires (48.4%), and Structure Fires (25.0%).
Fire incident types reported to NFIRS in Zip Code 85742


 Nearest zip codes: 85741, 85654, 85704, 85755, 85737, 85745.


 Based on the data from the years 2003 - 2018 the average number of fires per year is 30. The highest number of reported fires - 58 took place in 2005, and the least - 1 in 2008. The data has a growing trend.
 When looking into fire subcategories, the most incidents belonged to: Outside Fires (48.4%), and Structure Fires (25.0%).