Marana, Arizona
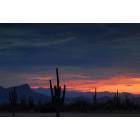
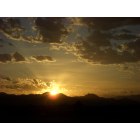
Marana: Marana Sunset
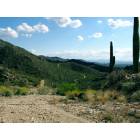
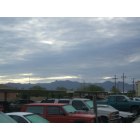
Marana: Western Tortolitas, just north of Marana.
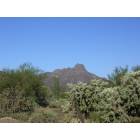
Marana: sombrero peak from my house off ina rd.
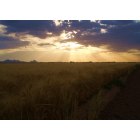
Marana: jacob's ladders over a field in Marana
Marana: apartments in marana
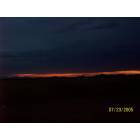
Marana: Marana sunrise
Marana: Marana Sunset
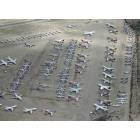
Marana: An aerial overview of the Aircraft Graveyard near Marana Arizona
Marana: my house in Marana
Marana: Ted working the soil
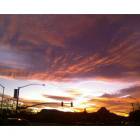
Marana: sunset from Cortaro & Silverbell
Marana: marana,AZ
- add
your
Submit your own pictures of this town and show them to the world
- OSM Map
- General Map
- Google Map
- MSN Map
Population change since 2000: +312.8%
| Males: 27,630 | |
| Females: 28,332 |
| Median resident age: | 42.0 years |
| Arizona median age: | 38.8 years |
Zip codes: 85658.
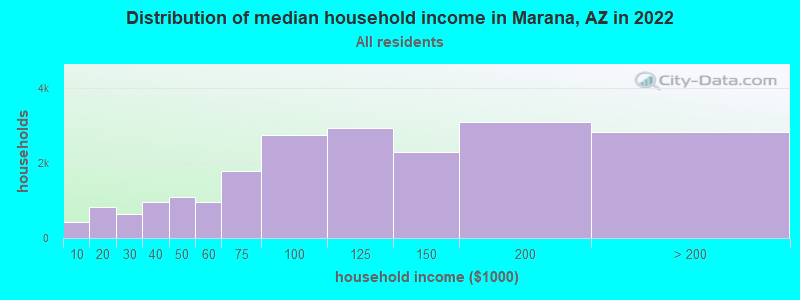
| Marana: | $105,117 |
| AZ: | $74,568 |
Estimated per capita income in 2022: $49,610 (it was $22,408 in 2000)
Marana town income, earnings, and wages data
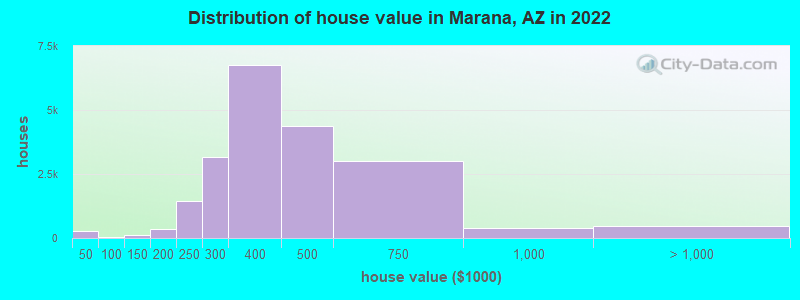
Estimated median house or condo value in 2022: $426,717 (it was $127,800 in 2000)
| Marana: | $426,717 |
| AZ: | $402,800 |
Mean prices in 2022: all housing units: $358,231; detached houses: $392,439; townhouses or other attached units: $275,497; in 2-unit structures: over $1,000,000; in 3-to-4-unit structures: $210,654; in 5-or-more-unit structures: $246,614; mobile homes: $121,731; occupied boats, rvs, vans, etc.: $16,113
Median gross rent in 2022: $1,673.
(4.8% for White Non-Hispanic residents, 20.1% for Black residents, 4.3% for Hispanic or Latino residents, 9.5% for American Indian residents, 7.7% for other race residents, 2.4% for two or more races residents)
Detailed information about poverty and poor residents in Marana, AZ


Compare current foreclosures in Marana, AZ:
| Photo | Address | Area | Beds / Baths | Price | Details |
|---|---|---|---|---|---|

|
#1
W Placita Dato
Marana, AZ 85653
|
1,344 sq. feet
|
2 baths 3 beds |
show details | |

|
#2
W Massey Dr
Marana, AZ 85653
|
2,345 sq. feet
|
3 baths 5 beds |
show details | |

|
#3
W Tangerine Rd
Marana, AZ 85658
|
- sq. feet
|
2 baths 4 beds |
show details | |

|
#4
N Flintlock Rd
Marana, AZ 85653
|
- sq. feet
|
2 baths 3 beds |
show details | |

|
#5
N Gibbs Ave
Marana, AZ 85653
|
1,912 sq. feet
|
- baths - beds |
show details | |

|
#6
N Mandarina Blvd
Marana, AZ 85658
|
- sq. feet
|
- baths - beds |
show details | |

|
#7
N Walz Dr
Marana, AZ 85653
|
- sq. feet
|
- baths - beds |
show details | |

|
#8
W Yates Ln
Marana, AZ 85653
|
- sq. feet
|
- baths - beds |
show details | |

|
#9
N Cutri Ct
Marana, AZ 85653
|
- sq. feet
|
- baths - beds |
show details | |

|
#10
W Granville Dr
Marana, AZ 85653
|
- sq. feet
|
- baths - beds |
show details |
| Photo | Address | Area | Beds / Baths | Price | Details |
|---|---|---|---|---|---|

|
#11
W Motes Dr
Marana, AZ 85653
|
1,950 sq. feet
|
- baths - beds |
show details | |

|
#12
W Red Hawk Pl
Marana, AZ 85658
|
- sq. feet
|
- baths - beds |
show details | |

|
#13
W Vanderbilt Farms Way
Marana, AZ 85653
|
- sq. feet
|
- baths - beds |
show details | |

|
#14
N Sandario Rd Unit 174
Marana, AZ 85653
|
- sq. feet
|
- baths - beds |
show details | |

|
#15
N Gadwall Dr
Marana, AZ 85653
|
1,727 sq. feet
|
- baths - beds |
show details | |

|
#16
W Avella Dr
Marana, AZ 85658
|
- sq. feet
|
- baths - beds |
show details | |

|
#17
W Willow Den Dr
Marana, AZ 85653
|
- sq. feet
|
- baths - beds |
show details | |

|
#18
W Filbert St
Marana, AZ 85653
|
- sq. feet
|
- baths - beds |
show details | |

|
#19
N Anway Rd Unit 1
Marana, AZ 85653
|
- sq. feet
|
- baths - beds |
show details | |

|
#20
N Sunset Gallery Dr
Marana, AZ 85658
|
- sq. feet
|
- baths - beds |
show details |
| Photo | Address | Area | Beds / Baths | Price | Details |
|---|---|---|---|---|---|

|
#21
N Blanco Wash Trl
Marana, AZ 85653
|
- sq. feet
|
- baths - beds |
show details | |

|
#22
N Stone Ring Dr
Marana, AZ 85653
|
1,700 sq. feet
|
- baths - beds |
show details | |

|
#23
W Tangerine Rd Apt 11104
Marana, AZ 85658
|
- sq. feet
|
- baths - beds |
show details | |

|
#24
N Tenaza Ct
Marana, AZ 85653
|
- sq. feet
|
- baths - beds |
show details | |

|
#25
W Moon Spring Rd
Marana, AZ 85653
|
- sq. feet
|
- baths - beds |
show details | |

|
#26
W Crimson Bluff Dr
Marana, AZ 85658
|
1,538 sq. feet
|
- baths - beds |
show details | |

|
#27
W Avra Valley Rd
Marana, AZ 85653
|
- sq. feet
|
- baths - beds |
show details | |

|
#28
W Cloudwood Dr
Marana, AZ 85653
|
- sq. feet
|
- baths - beds |
show details | |

|
#29
W Hayward Dr
Marana, AZ 85653
|
- sq. feet
|
- baths - beds |
show details | |

|
#30
W Acacia Blossom Pl
Marana, AZ 85658
|
- sq. feet
|
- baths - beds |
show details |
| Photo | Address | Area | Beds / Baths | Price | Details |
|---|---|---|---|---|---|

|
#31
N Sandra Rd
Marana, AZ 85658
|
- sq. feet
|
- baths - beds |
show details | |

|
#32
W Chestnut St
Marana, AZ 85653
|
- sq. feet
|
- baths - beds |
show details | |

|
#33
W Lone Cougar Way
Marana, AZ 85653
|
- sq. feet
|
- baths - beds |
show details | |

|
#34
W Sunset Vista Pl
Marana, AZ 85658
|
1,318 sq. feet
|
- baths - beds |
show details | |

|
#35
W Makenna Ln
Marana, AZ 85653
|
- sq. feet
|
- baths - beds |
show details | |

|
#36
N Compass Rose Way
Marana, AZ 85658
|
- sq. feet
|
- baths - beds |
show details | |

|
#37
W Chestnut St
Marana, AZ 85653
|
- sq. feet
|
- baths - beds |
show details | |

|
#38
W Red Hawk Pl
Marana, AZ 85658
|
- sq. feet
|
- baths - beds |
show details | |

|
#39
W Claxton Dr
Marana, AZ 85653
|
- sq. feet
|
- baths - beds |
show details | |

|
#40
W Silverbell Rd
Marana, AZ 85653
|
- sq. feet
|
- baths - beds |
show details |
| Photo | Address | Area | Beds / Baths | Price | Details |
|---|---|---|---|---|---|

|
#41
W Feral Rd
Marana, AZ 85653
|
1,870 sq. feet
|
- baths - beds |
show details | |

|
#42
W Pleasant View Dr
Marana, AZ 85653
|
- sq. feet
|
- baths - beds |
show details | |

|
#43
W Cloudwood Dr
Marana, AZ 85653
|
- sq. feet
|
- baths - beds |
show details | |

|
#44
N Kenosha Bluff Dr
Marana, AZ 85658
|
2,152 sq. feet
|
- baths - beds |
show details | |

|
#45
W Harrigan Dr
Marana, AZ 85653
|
- sq. feet
|
- baths - beds |
show details | |

|
#46
W Painted Cliff Dr
Marana, AZ 85658
|
- sq. feet
|
- baths - beds |
show details | |

|
#47
N Musket Rd
Marana, AZ 85653
|
- sq. feet
|
- baths - beds |
show details | |

|
#48
N Anway Rd
Marana, AZ 85653
|
- sq. feet
|
- baths - beds |
show details | |

|
#49
W Spur Bell Ln
Marana, AZ 85653
|
- sq. feet
|
- baths - beds |
show details | |

|
Check over 1 million property listings on Foreclosure.com!
|
browse all offers | |||


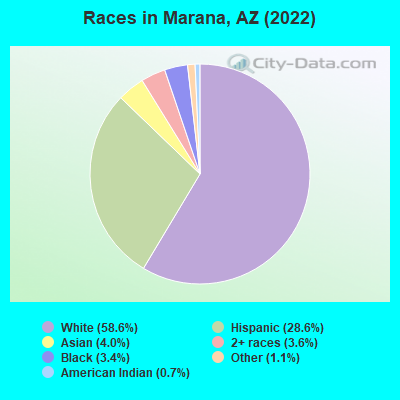
- 31,21758.6%White alone
- 15,26228.6%Hispanic
- 2,1184.0%Asian alone
- 1,9403.6%Two or more races
- 1,8203.4%Black alone
- 6061.1%Other race alone
- 3940.7%American Indian alone
According to our research of Arizona and other state lists, there were 57 registered sex offenders living in Marana, Arizona as of April 27, 2024.
The ratio of all residents to sex offenders in Marana is 715 to 1.
The ratio of registered sex offenders to all residents in this city is near the state average.
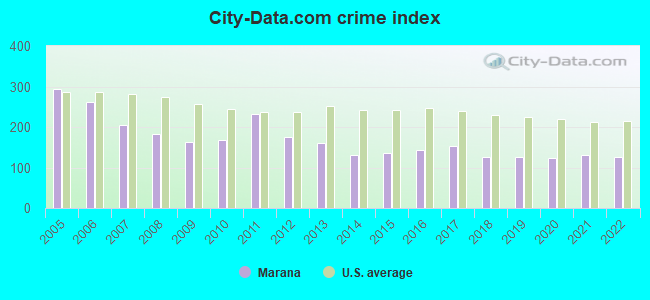
The City-Data.com crime index weighs serious crimes and violent crimes more heavily. Higher means more crime, U.S. average is 246.1. It adjusts for the number of visitors and daily workers commuting into cities.
- means the value is smaller than the state average.- means the value is about the same as the state average.
- means the value is bigger than the state average.
- means the value is much bigger than the state average.
Crime rate in Marana detailed stats: murders, rapes, robberies, assaults, burglaries, thefts, arson
Full-time law enforcement employees in 2021, including police officers: 127 (97 officers - 81 male; 16 female).
| Officers per 1,000 residents here: | 1.82 |
| Arizona average: | 1.75 |
 Recent articles from our blog. Our writers, many of them Ph.D. graduates or candidates, create easy-to-read articles on a wide variety of topics.

 | Marana or Oro Valley (5 replies) |
| Oro Valley/Marana versus Cave Creek/Carefree? (4 replies) |
| Is Tucson as crime ridden as what I've been seeing? (42 replies) |
| Town Of Marana Considering Annexation of Pinal Airpark (1 reply) |
| Moving to the Tucson area - a couple pointed questions (26 replies) |
| HOA fees in Marana (0 replies) |
Latest news from Marana, AZ collected exclusively by city-data.com from local newspapers, TV, and radio stations
Marana, AZ City Guides:
Ancestries: German (9.2%), English (7.7%), American (5.0%), Italian (4.7%), Irish (4.5%), European (2.5%).
Current Local Time: MST (no DST) time zone
Incorporated in 1977
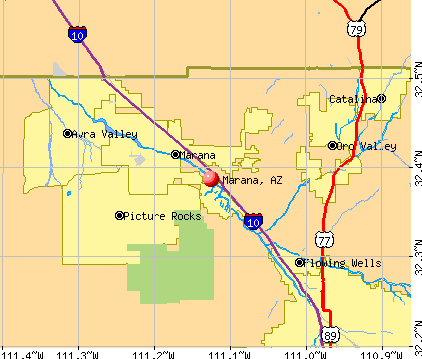
Land area: 72.7 square miles.
Population density: 770 people per square mile (low).
4,306 residents are foreign born (3.6% Latin America, 2.6% Asia, 1.1% Europe).
| This town: | 8.1% |
| Arizona: | 13.0% |
Median real estate property taxes paid for housing units with mortgages in 2022: $3,054 (0.7%)
Median real estate property taxes paid for housing units with no mortgage in 2022: $3,277 (0.8%)
Nearest city with pop. 50,000+: Casas Adobes, AZ (7.3 miles  , pop. 54,011).
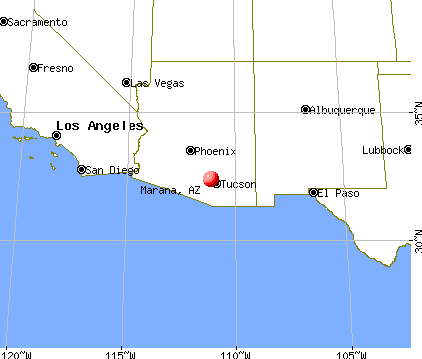
Nearest city with pop. 200,000+: Tucson, AZ (17.0 miles , pop. 486,699).
Nearest city with pop. 1,000,000+: Phoenix, AZ (96.3 miles , pop. 1,321,045).
Nearest cities:
), ), ), ), Latitude: 32.39 N, Longitude: 111.13 W
Daytime population change due to commuting: -3,206 (-6.0%)
Workers who live and work in this town: 8,400 (33.4%)
Property values in Marana, AZ
Marana tourist attractions:
- Breakers Water Park - Marana, AZ - a water park offering a variety of options
- Ritz Carlton Golf Course Dove Mountain - Marana, AZ - a golf course with numerous advantages
- Gallery Golf Club - Marana, AZ - a privately owned club offering a variety of amenities
- Heritage Highlands Golf Course - Marana, AZ - a lush greenery in the middle of the desert
Marana, Arizona accommodation & food services, waste management - Economy and Business Data
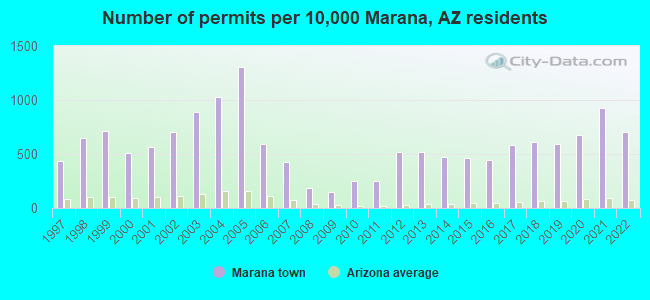
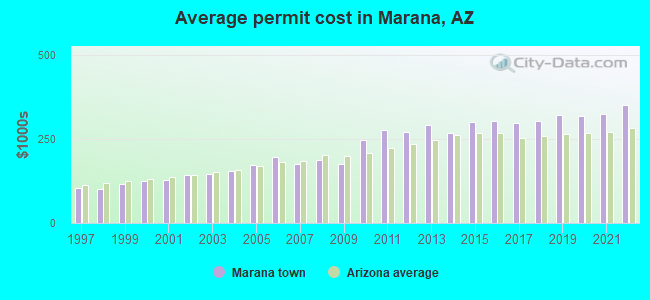
Single-family new house construction building permits:
- 2022: 949 buildings, average cost: $352,100
- 2021: 1252 buildings, average cost: $324,900
- 2020: 913 buildings, average cost: $319,400
- 2019: 808 buildings, average cost: $321,000
- 2018: 828 buildings, average cost: $303,900
- 2017: 788 buildings, average cost: $299,100
- 2016: 596 buildings, average cost: $303,600
- 2015: 633 buildings, average cost: $301,600
- 2014: 639 buildings, average cost: $269,200
- 2013: 702 buildings, average cost: $290,700
- 2012: 706 buildings, average cost: $270,100
- 2011: 337 buildings, average cost: $277,300
- 2010: 343 buildings, average cost: $246,500
- 2009: 199 buildings, average cost: $175,900
- 2008: 256 buildings, average cost: $189,400
- 2007: 579 buildings, average cost: $176,300
- 2006: 806 buildings, average cost: $195,800
- 2005: 1771 buildings, average cost: $174,200
- 2004: 1398 buildings, average cost: $156,400
- 2003: 1206 buildings, average cost: $147,000
- 2002: 960 buildings, average cost: $142,200
- 2001: 772 buildings, average cost: $127,900
- 2000: 689 buildings, average cost: $123,600
- 1999: 969 buildings, average cost: $115,000
- 1998: 873 buildings, average cost: $102,000
- 1997: 590 buildings, average cost: $105,200
| Here: | 2.9% |
| Arizona: | 3.8% |
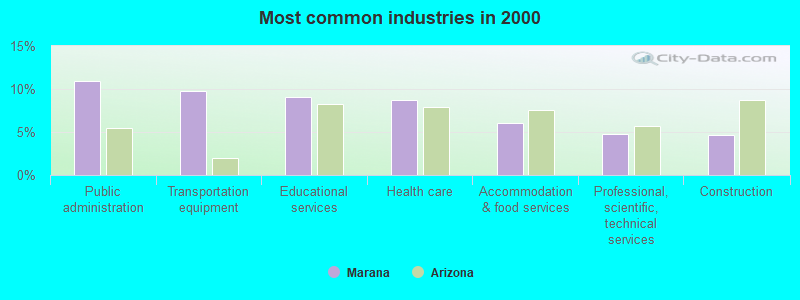
- Public administration (10.9%)
- Transportation equipment (9.8%)
- Educational services (9.0%)
- Health care (8.7%)
- Accommodation & food services (6.1%)
- Professional, scientific, technical services (4.8%)
- Construction (4.7%)
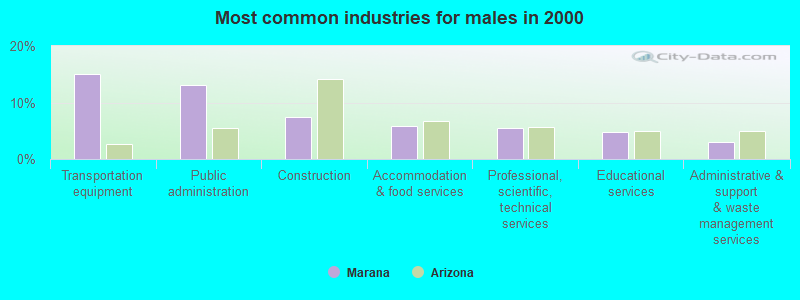
- Transportation equipment (15.0%)
- Public administration (13.0%)
- Construction (7.5%)
- Accommodation & food services (5.8%)
- Professional, scientific, technical services (5.4%)
- Educational services (4.7%)
- Administrative & support & waste management services (3.0%)
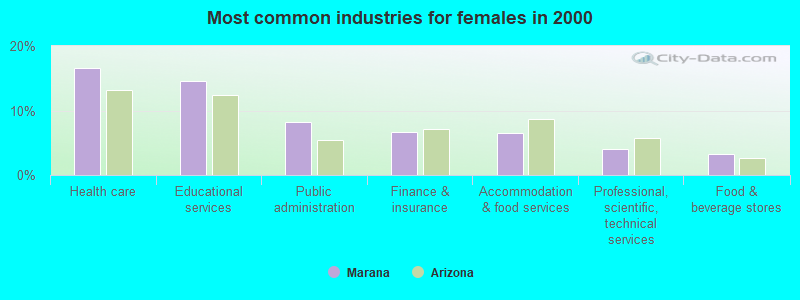
- Health care (16.6%)
- Educational services (14.6%)
- Public administration (8.2%)
- Finance & insurance (6.7%)
- Accommodation & food services (6.5%)
- Professional, scientific, technical services (4.0%)
- Food & beverage stores (3.3%)
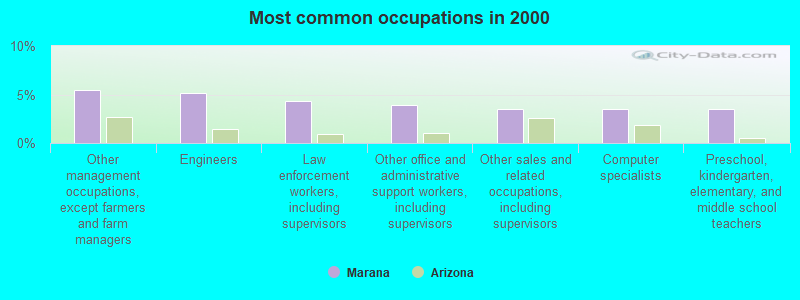
- Other management occupations, except farmers and farm managers (5.5%)
- Engineers (5.2%)
- Law enforcement workers, including supervisors (4.4%)
- Other office and administrative support workers, including supervisors (3.9%)
- Other sales and related occupations, including supervisors (3.5%)
- Computer specialists (3.5%)
- Preschool, kindergarten, elementary, and middle school teachers (3.5%)
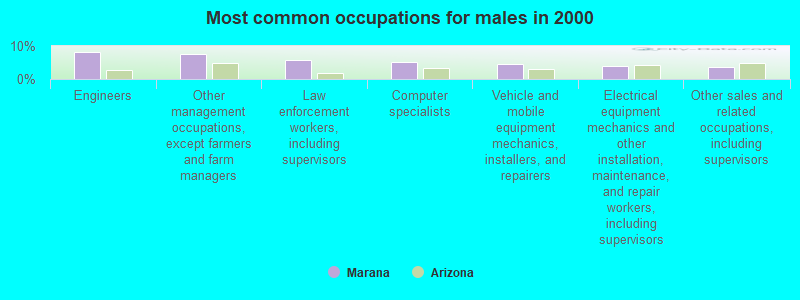
- Engineers (8.3%)
- Other management occupations, except farmers and farm managers (7.6%)
- Law enforcement workers, including supervisors (5.7%)
- Computer specialists (5.2%)
- Vehicle and mobile equipment mechanics, installers, and repairers (4.5%)
- Electrical equipment mechanics and other installation, maintenance, and repair workers, including supervisors (4.1%)
- Other sales and related occupations, including supervisors (3.6%)
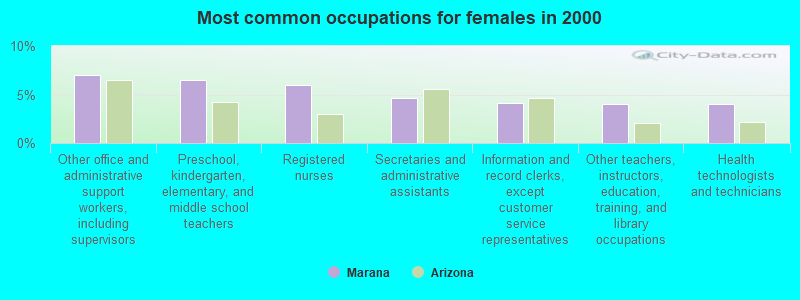
- Other office and administrative support workers, including supervisors (7.0%)
- Preschool, kindergarten, elementary, and middle school teachers (6.5%)
- Registered nurses (6.0%)
- Secretaries and administrative assistants (4.6%)
- Information and record clerks, except customer service representatives (4.1%)
- Other teachers, instructors, education, training, and library occupations (4.0%)
- Health technologists and technicians (4.0%)
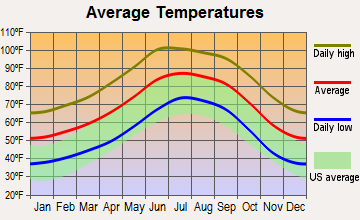
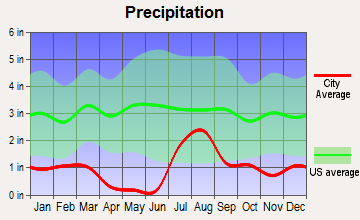
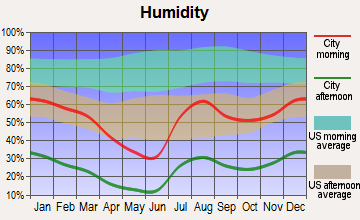
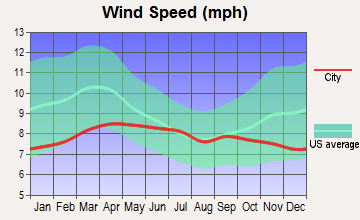
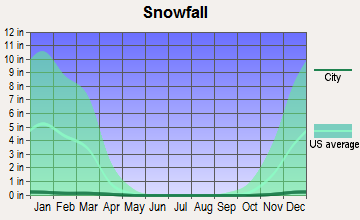
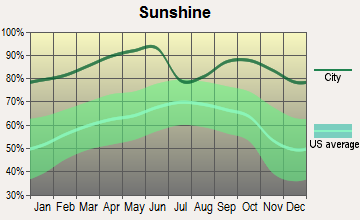
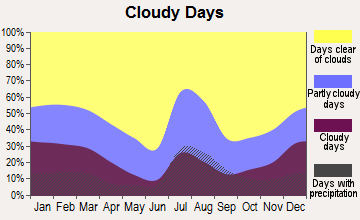
Average climate in Marana, Arizona
Based on data reported by over 4,000 weather stations
|
|


(lower is better)
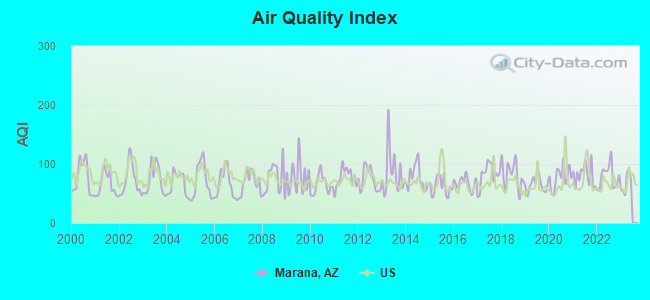
Air Quality Index (AQI) level in 2022 was 78.6. This is about average.
| City: | 78.6 |
| U.S.: | 72.6 |
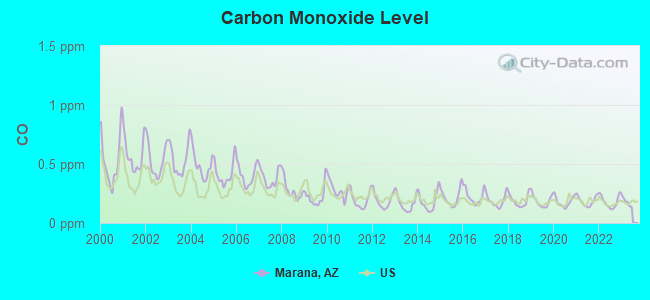
Carbon Monoxide (CO) [ppm] level in 2022 was 0.180. This is better than average. Closest monitor was 4.5 miles away from the city center.
| City: | 0.180 |
| U.S.: | 0.251 |
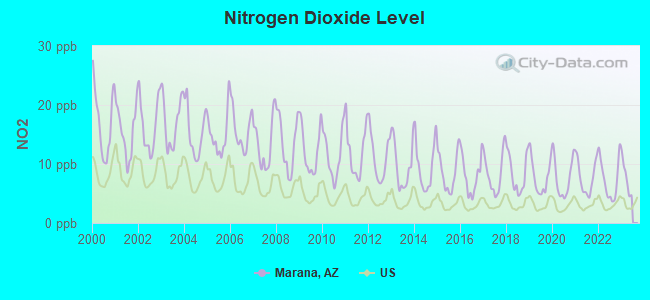
Nitrogen Dioxide (NO2) [ppb] level in 2022 was 7.42. This is significantly worse than average. Closest monitor was 3.1 miles away from the city center.
| City: | 7.42 |
| U.S.: | 5.11 |
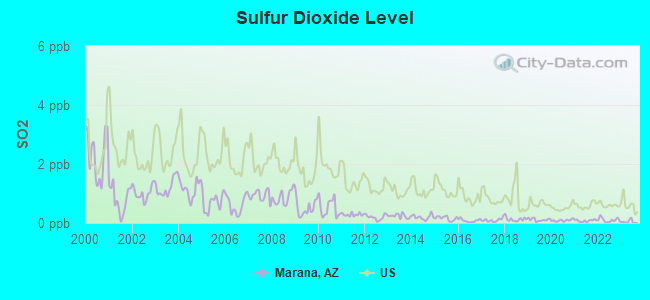
Sulfur Dioxide (SO2) [ppb] level in 2022 was 0.102. This is significantly better than average. Closest monitor was 3.1 miles away from the city center.
| City: | 0.102 |
| U.S.: | 1.515 |
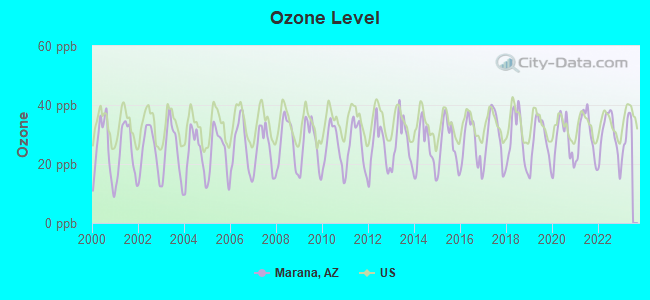
Ozone [ppb] level in 2022 was 29.6. This is about average. Closest monitor was 0.4 miles away from the city center.
| City: | 29.6 |
| U.S.: | 33.3 |
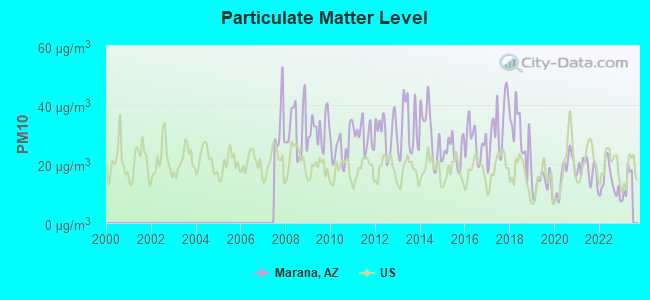
Particulate Matter (PM10) [µg/m3] level in 2022 was 14.0. This is better than average. Closest monitor was 2.6 miles away from the city center.
| City: | 14.0 |
| U.S.: | 19.2 |
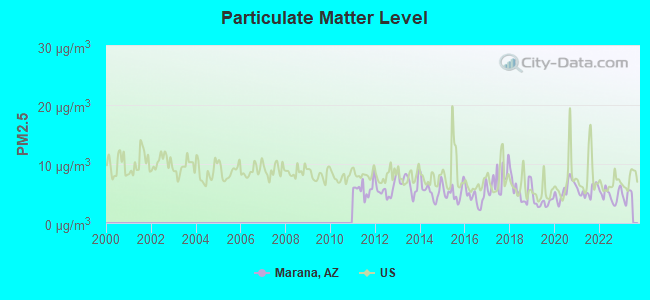
Particulate Matter (PM2.5) [µg/m3] level in 2022 was 4.74. This is significantly better than average. Closest monitor was 6.7 miles away from the city center.
| City: | 4.74 |
| U.S.: | 8.11 |
Earthquake activity:
Marana-area historical earthquake activity is significantly above Arizona state average. It is 1623% greater than the overall U.S. average.On 6/28/1992 at 11:57:34, a magnitude 7.6 (6.2 MB, 7.6 MS, 7.3 MW, Depth: 0.7 mi, Class: Major, Intensity: VIII - XII) earthquake occurred 336.4 miles away from Marana center, causing 3 deaths (1 shaking deaths, 2 other deaths) and 400 injuries, causing $100,000,000 total damage and $40,000,000 insured losses
On 5/19/1940 at 04:36:40, a magnitude 7.2 (7.2 UK) earthquake occurred 272.0 miles away from the city center, causing $33,000,000 total damage
On 12/31/1934 at 18:45:56, a magnitude 7.1 (7.1 UK) earthquake occurred 271.1 miles away from Marana center
On 10/16/1999 at 09:46:44, a magnitude 7.4 (6.3 MB, 7.4 MS, 7.2 MW, 7.3 ML) earthquake occurred 339.9 miles away from the city center
On 10/15/1979 at 23:16:54, a magnitude 7.0 (5.7 MB, 6.9 MS, 7.0 ML, 6.4 MW) earthquake occurred 264.6 miles away from the city center
On 11/24/1987 at 13:15:56, a magnitude 6.7 (6.0 MB, 6.6 MS, 6.7 ML, 6.1 ML, Class: Strong, Intensity: VII - IX) earthquake occurred 284.8 miles away from the city center
Magnitude types: body-wave magnitude (MB), local magnitude (ML), surface-wave magnitude (MS), moment magnitude (MW)
Natural disasters:
The number of natural disasters in Pima County (13) is near the US average (15).Major Disasters (Presidential) Declared: 10
Emergencies Declared: 1
Causes of natural disasters: Floods: 9, Storms: 8, Fires: 2, Hurricane: 1, Tornado: 1, Other: 1 (Note: some incidents may be assigned to more than one category).

Hospitals and medical centers near Marana:
- NORTHWEST TUCSON DIALYSIS (DVA) (Dialysis Facility, about 7 miles away; TUCSON, AZ)
- LA CANADA CARE CENTER (Nursing Home, about 8 miles away; TUCSON, AZ)
- NORTHWEST TUCSON DIALYSIS (FMC) (Dialysis Facility, about 9 miles away; TUCSON, AZ)
- LIFE CARE CENTER OF TUCSON (Nursing Home, about 9 miles away; TUCSON, AZ)
- MOUNTAIN VIEW CARE CENTER (Nursing Home, about 9 miles away; TUCSON, AZ)
- COLUMBIA HOMECARE NORTHWEST (Home Health Center, about 9 miles away; TUCSON, AZ)
- DESERT LIFE DAY SURGERY (Hospital, about 9 miles away; TUCSON, AZ)
Airports, heliports and other landing facilities located in Marana:
- Marana Regional Airport (AVQ) (Runways: 2, Air Taxi Ops: 10,000, Itinerant Ops: 30,000, Local Ops: 40,000, Military Ops: 10,000)
- Pinal Airpark Airport (MZJ) (Runways: 1, Itinerant Ops: 557, Local Ops: 7,500, Military Ops: 48,800)
- Silverbell Army Heliport (02AZ)
- The Ultralight Strip (4AZ8)
Colleges/universities with over 2000 students nearest to Marana:
- University of Arizona (about 15 miles; Tucson, AZ; Full-time enrollment: 36,324)
- Pima Medical Institute-Tucson (about 16 miles; Tucson, AZ; FT enrollment: 2,357)
- Pima Community College (about 19 miles; Tucson, AZ; FT enrollment: 18,794)
- Central Arizona College (about 50 miles; Coolidge, AZ; FT enrollment: 4,893)
- Arizona State University-Polytechnic (about 72 miles; Mesa, AZ; FT enrollment: 3,311)
- Chandler-Gilbert Community College (about 74 miles; Chandler, AZ; FT enrollment: 8,047)
- Mesa Community College (about 82 miles; Mesa, AZ; FT enrollment: 14,726)
Private high school in Marana:
Points of interest:
Notable locations in Marana: Marana (A), T-Bench-Bar Ranch (B), Tangerine Landfill (C), Old West Business Park (D), Shops at Thornydale (E), Tucson Electric Power Company North Loop Generating Station (F), Dove Mountain Golf Resort (G), The Pines Golf Club at Marana (H), Pima County Wastewater Management Ina Road Water Pollution Control Facility (I), Sabino Railroad Station (J), Rillito Railroad Station (K), Plata Railroad Station (L), Papago Railroad Station (M), Marana Sheriffs Office (N), Marana Railroad Station (O), Kino Railroad Station (P), Marana Municipal Complex (Q), Pima County Public Library Geasa Marana Branch (R), Northwest Fire Station 38 (S), Northwest Fire Station 37 (T). Display/hide their locations on the map
Shopping Centers: Embassy Plaza Shopping Center (1), Gold Canyon Plaza Shopping Center (2), Orange Grove Mercado Shopping Center (3). Display/hide their locations on the map
Churches in Marana include: Saint Christopher Catholic Church (A), Redeemer Evangelical Lutheran Church (B), Marana Community Christian Church (C), Bread of Life Assembly of God (D), Sonoran Desert Baptist Church (E), Church of Christ (F), The Road Church (G), Sun and Shield Baptist Church (H). Display/hide their locations on the map
River: Rillito River (A). Display/hide its location on the map
Parks in Marana include: Rillito Vista Park (1), Marana Park (2). Display/hide their locations on the map
Tourist attractions: Breakers Water Park Information (Amusement & Theme Parks; 8555 West Tangerine Road) (1), Dove Mountain Information Center (13900 North Dove Mountain Boulevard) (2). Display/hide their approximate locations on the map
Drinking water stations with addresses in Marana and their reported violations in the past:
MARANA MUNICIPAL - PICTURE ROCKS (Address: 11267 W HARVESTER DR , Population served: 5,128, Groundwater):Past monitoring violations:MARANA DWID - DERRINGER (Population served: 1,385, Groundwater):
- Follow-up Or Routine LCR Tap M/R - In OCT-01-2010, Contaminant: Lead and Copper Rule. Follow-up actions: St Compliance achieved (SEP-13-2013)
- Monitoring and Reporting (DBP) - Between JAN-2010 and DEC-2010, Contaminant: Total Haloacetic Acids (HAA5). Follow-up actions: St Compliance achieved (JUL-11-2012)
- Monitoring and Reporting (DBP) - Between JAN-2010 and DEC-2010, Contaminant: TTHM. Follow-up actions: St Compliance achieved (JUL-11-2012)
- Monitoring and Reporting (DBP) - Between APR-2008 and JUN-2008, Contaminant: Chlorine. Follow-up actions: St Violation/Reminder Notice (AUG-14-2008), St Compliance achieved (SEP-04-2008)
- Monitoring and Reporting (DBP) - Between OCT-2007 and DEC-2007, Contaminant: Chlorine. Follow-up actions: St Compliance achieved (MAR-27-2008), St Violation/Reminder Notice (JUL-16-2008), St Compliance achieved (JUL-23-2008)
- 8 routine major monitoring violations
- 2 minor monitoring violations
- 56 regular monitoring violations
- 6 other older monitoring violations
Past monitoring violations:MARANA CORRECTIONAL FACILITY (Address: 12610 W SILVERBELL RD , Population served: 625, Groundwater):
- Monitoring and Reporting (DBP) - Between JAN-2011 and DEC-2011, Contaminant: TTHM. Follow-up actions: St Compliance achieved (JUL-16-2012)
- Monitoring and Reporting (DBP) - Between JAN-2011 and DEC-2011, Contaminant: Total Haloacetic Acids (HAA5). Follow-up actions: St Compliance achieved (JUL-16-2012)
- Monitoring and Reporting (DBP) - Between APR-2010 and JUN-2010, Contaminant: Chlorine. Follow-up actions: St Compliance achieved (AUG-04-2010)
- Monitoring and Reporting (DBP) - Between JUL-2009 and SEP-2009, Contaminant: Chlorine. Follow-up actions: St Compliance achieved (JAN-25-2010)
- 3 routine major monitoring violations
- 2 minor monitoring violations
- 31 regular monitoring violations
Past health violations:MARANA DWID - CULVER (Population served: 554, Groundwater):Past monitoring violations:
- MCL, Monthly (TCR) - In DEC-2006, Contaminant: Coliform. Follow-up actions: St Compliance achieved (JUN-16-2011)
- MCL, Monthly (TCR) - In AUG-2006, Contaminant: Coliform. Follow-up actions: St Compliance achieved (FEB-08-2007)
- MCL, Monthly (TCR) - In JUL-2006, Contaminant: Coliform. Follow-up actions: St Compliance achieved (FEB-08-2007)
- Monitoring and Reporting (DBP) - Between JAN-2011 and DEC-2011, Contaminant: TTHM. Follow-up actions: St Compliance achieved (SEP-06-2012)
- Monitoring and Reporting (DBP) - Between JAN-2011 and DEC-2011, Contaminant: Total Haloacetic Acids (HAA5). Follow-up actions: St Compliance achieved (SEP-06-2012)
- Monitoring and Reporting (DBP) - Between OCT-2010 and DEC-2010, Contaminant: Chlorine
- Monitoring and Reporting (DBP) - Between JUL-2010 and SEP-2010, Contaminant: Chlorine
- Initial Tap Sampling for Pb and Cu - In JUL-01-2010, Contaminant: Lead and Copper Rule. Follow-up actions: St Compliance achieved (MAR-06-2012)
- 29 routine major monitoring violations
- 38 regular monitoring violations
- 24 other older monitoring violations
Past monitoring violations:MARANA MUNICIPAL-PALO VERDE (Address: 11267 W HARVESTER DR , Population served: 146, Groundwater):
- Monitoring and Reporting (DBP) - Between APR-2010 and JUN-2010, Contaminant: Chlorine. Follow-up actions: St Compliance achieved (AUG-04-2010)
- Monitoring and Reporting (DBP) - Between JUL-2009 and SEP-2009, Contaminant: Chlorine. Follow-up actions: St Compliance achieved (DEC-30-2009)
- Monitoring and Reporting (DBP) - Between APR-2009 and JUN-2009, Contaminant: Chlorine. Follow-up actions: St Violation/Reminder Notice (JUL-31-2009), St Compliance achieved (DEC-30-2009)
- Monitoring and Reporting (DBP) - Between JAN-2009 and MAR-2009, Contaminant: Chlorine. Follow-up actions: St Violation/Reminder Notice (APR-23-2009), St Compliance achieved (DEC-30-2009)
- Monitoring and Reporting (DBP) - Between OCT-2008 and DEC-2008, Contaminant: Chlorine. Follow-up actions: St Violation/Reminder Notice (FEB-13-2009), St Compliance achieved (DEC-30-2009)
- 3 routine major monitoring violations
- 3 regular monitoring violations
- 23 other older monitoring violations
Past monitoring violations:USSOCOM PARACHUTE TRAINING (Population served: 48, Groundwater):
- Monitoring and Reporting (DBP) - Between JAN-2010 and DEC-2010, Contaminant: TTHM. Follow-up actions: St Compliance achieved (JUL-11-2012)
- Monitoring and Reporting (DBP) - Between JAN-2010 and DEC-2010, Contaminant: Total Haloacetic Acids (HAA5). Follow-up actions: St Compliance achieved (JUL-11-2012)
- Monitoring and Reporting (DBP) - Between APR-2008 and JUN-2008, Contaminant: Chlorine. Follow-up actions: St Compliance achieved (JUL-31-2008)
- Monitoring and Reporting (DBP) - Between JUL-2007 and SEP-2007, Contaminant: Chlorine. Follow-up actions: St Compliance achieved (DEC-20-2007)
- Monitoring and Reporting (DBP) - Between JAN-2007 and MAR-2007, Contaminant: Chlorine. Follow-up actions: St Violation/Reminder Notice (JUL-12-2007), St Compliance achieved (JUL-12-2007)
- 12 routine major monitoring violations
- 3 other older monitoring violations
Past health violations:DAVIS RANCH LAND OWNERS (Address: 37075 S TWIN HAWK LN , Population served: 40, Groundwater):Past monitoring violations:
- MCL, Average - Between JAN-2008 and MAR-2008, Contaminant: Nitrate. Follow-up actions: St Compliance achieved (JUL-22-2008)
- MCL, Monthly (TCR) - In AUG-2007, Contaminant: Coliform. Follow-up actions: St Compliance achieved (MAR-18-2011)
- Monitoring, Source Water (GWR) - In JUN-15-2012, Contaminant: E. COLI. Follow-up actions: St Violation/Reminder Notice (JUL-26-2012), St Compliance achieved (AUG-22-2012)
- Monitoring and Reporting (DBP) - Between JUL-2008 and SEP-2008, Contaminant: Chlorine. Follow-up actions: State No Longer Subject to Rule (JUL-31-2008), St Violation/Reminder Notice (OCT-20-2008), State No Longer Subject to Rule (DEC-04-2008)
- Monitoring and Reporting (DBP) - Between APR-2008 and JUN-2008, Contaminant: Chlorine. Follow-up actions: State No Longer Subject to Rule (JUL-31-2008), St Violation/Reminder Notice (AUG-14-2008)
- Monitoring and Reporting (DBP) - Between JAN-2008 and MAR-2008, Contaminant: Chlorine. Follow-up actions: St Violation/Reminder Notice (JUL-16-2008), State No Longer Subject to Rule (JUL-31-2008)
- Monitoring and Reporting (DBP) - Between OCT-2007 and DEC-2007, Contaminant: Chlorine. Follow-up actions: St Violation/Reminder Notice (JUL-16-2008), State No Longer Subject to Rule (JUL-31-2008)
- 17 routine major monitoring violations
- 66 regular monitoring violations
- 19 other older monitoring violations
Past monitoring violations:
- Follow-up Or Routine LCR Tap M/R - In OCT-01-2005, Contaminant: Lead and Copper Rule. Follow-up actions: St Compliance achieved (DEC-06-2006)
- Follow-up Or Routine LCR Tap M/R - In OCT-01-2003, Contaminant: Lead and Copper Rule. Follow-up actions: St Compliance achieved (OCT-12-2007)
- 3 routine major monitoring violations
| This town: | 2.6 people |
| Arizona: | 2.6 people |
| This town: | 76.0% |
| Whole state: | 66.2% |
| This town: | 6.1% |
| Whole state: | 7.8% |
Likely homosexual households (counted as self-reported same-sex unmarried-partner households)
- Lesbian couples: 0.5% of all households
- Gay men: 0.4% of all households
People in group quarters in Marana in 2010:
- 499 people in state prisons
- 14 people in group homes intended for adults
- 7 people in other noninstitutional facilities
People in group quarters in Marana in 2000:
- 411 people in state prisons
- 7 people in other noninstitutional group quarters
- 2 people in other nonhousehold living situations
Banks with branches in Marana (2011 data):
- National Bank of Arizona: Marana Branch at 11853 West Marana Road, branch established on 1998/07/15. Info updated 2008/09/11: Bank assets: $4,485.6 mil, Deposits: $3,731.3 mil, headquarters in Tucson, AZ, positive income, Commercial Lending Specialization, 73 total offices, Holding Company: Zions Bancorporation
- Wells Fargo Bank, National Association: Dove Mountain Branch at 12140 North Dove Mountain Boulevard, Bldg 5, branch established on 2006/10/30. Info updated 2011/04/05: Bank assets: $1,161,490.0 mil, Deposits: $905,653.0 mil, headquarters in Sioux Falls, SD, positive income, 6395 total offices, Holding Company: Wells Fargo & Company
- JPMorgan Chase Bank, National Association: Tangerine And Thornydale Branch at 12025 N Thornydale Rd, branch established on 2009/04/21. Info updated 2011/11/10: Bank assets: $1,811,678.0 mil, Deposits: $1,190,738.0 mil, headquarters in Columbus, OH, positive income, International Specialization, 5577 total offices, Holding Company: Jpmorgan Chase & Co.
- Canyon Community Bank, National Association: Marana Branch at 6811 North Thornydale Drive, branch established on 2004/07/19. Info updated 2006/11/03: Bank assets: $88.5 mil, Deposits: $79.7 mil, headquarters in Tucson, AZ, negative income in the last year, Commercial Lending Specialization, 4 total offices, Holding Company: Canyon Bancorporation, Inc.
- BMO Harris Bank National Association: Toucson-Mountain at 7820 North Cortaro Road, branch established on 2005/06/01. Info updated 2011/07/14: Bank assets: $97,264.0 mil, Deposits: $75,624.6 mil, headquarters in Chicago, IL, positive income, 717 total offices, Holding Company: Bank Of Montreal
For population 15 years and over in Marana:
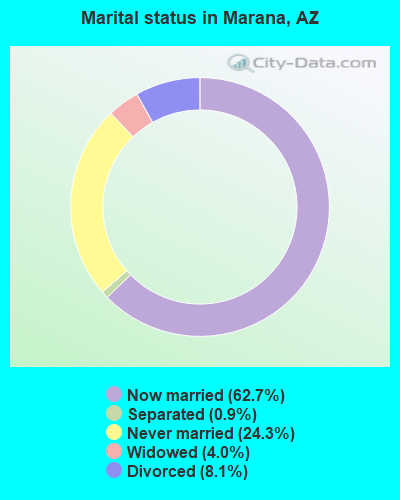
- Never married: 24.3%
- Now married: 62.7%
- Separated: 0.9%
- Widowed: 4.0%
- Divorced: 8.1%
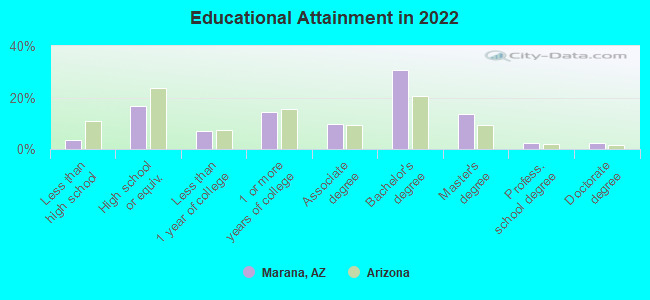
For population 25 years and over in Marana:
- High school or higher: 96.1%
- Bachelor's degree or higher: 46.6%
- Graduate or professional degree: 17.5%
- Unemployed: 4.6%
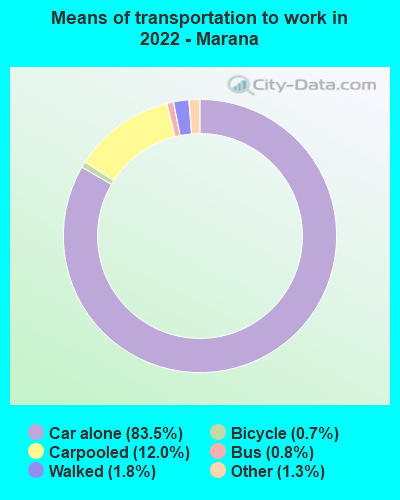
- Mean travel time to work (commute): 22.2 minutes
| Here: | 9.8 |
| Arizona average: | 12.2 |

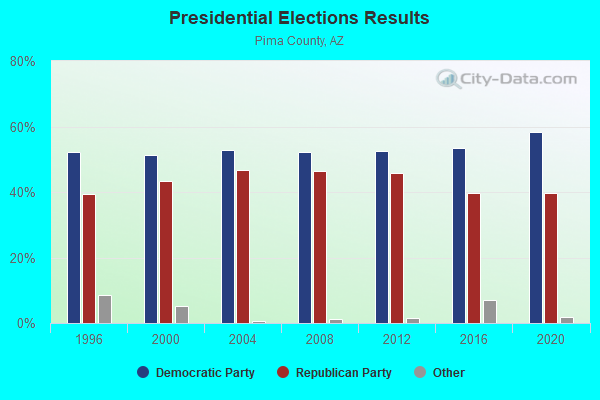
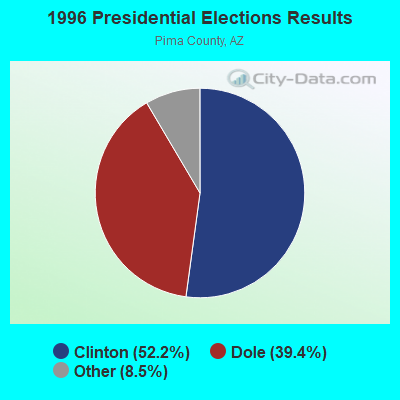
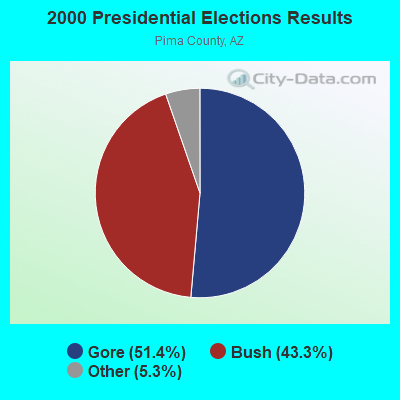
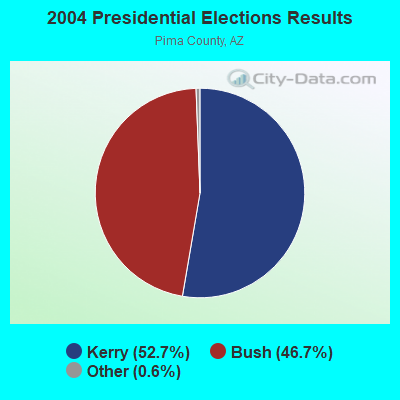
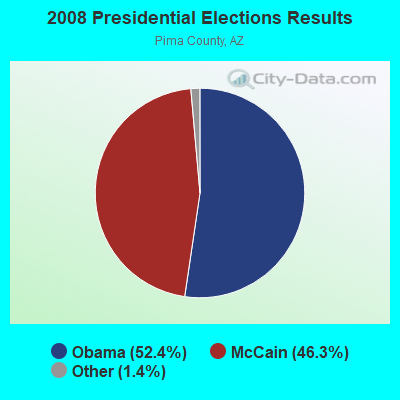

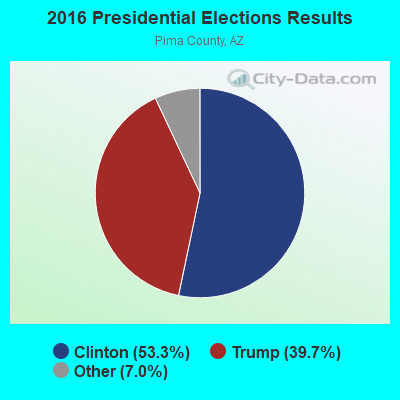
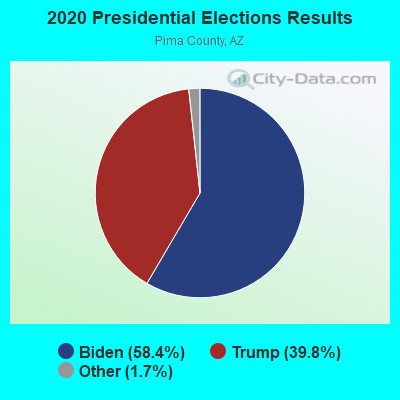
Graphs represent county-level data. Detailed 2008 Election Results
Religion statistics for Marana, AZ (based on Pima County data)
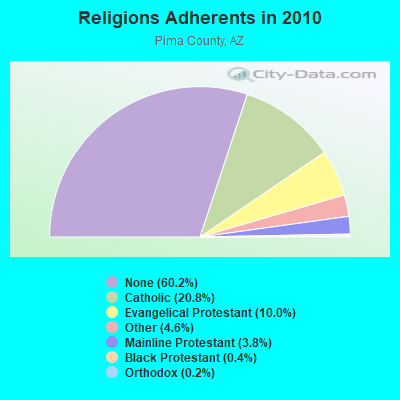
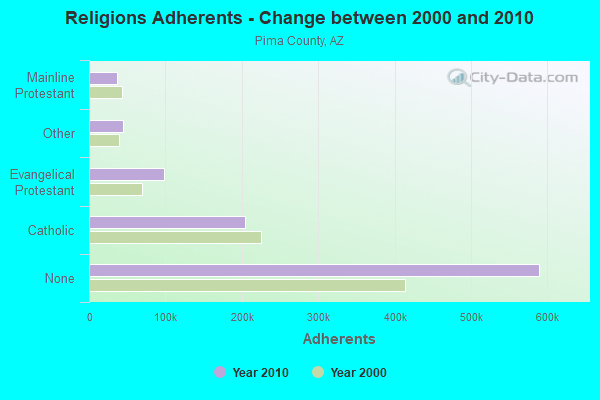
| Religion | Adherents | Congregations |
|---|---|---|
| Catholic | 203,770 | 50 |
| Evangelical Protestant | 98,278 | 362 |
| Other | 45,011 | 128 |
| Mainline Protestant | 37,037 | 77 |
| Black Protestant | 4,190 | 14 |
| Orthodox | 2,260 | 5 |
| None | 589,717 | - |
Food Environment Statistics:
| This county: | 1.22 / 10,000 pop. |
| Arizona: | 1.36 / 10,000 pop. |
| Pima County: | 0.09 / 10,000 pop. |
| Arizona: | 0.14 / 10,000 pop. |
| Pima County: | 0.52 / 10,000 pop. |
| State: | 0.55 / 10,000 pop. |
| This county: | 2.27 / 10,000 pop. |
| State: | 2.47 / 10,000 pop. |
| Pima County: | 6.17 / 10,000 pop. |
| Arizona: | 6.21 / 10,000 pop. |
| Pima County: | 7.8% |
| State: | 8.0% |
| This county: | 21.2% |
| Arizona: | 22.8% |
| Pima County: | 15.2% |
| State: | 14.2% |
Health and Nutrition:
| Marana: | 51.7% |
| Arizona: | 49.0% |
| This city: | 51.3% |
| Arizona: | 47.3% |
| Marana: | 28.3 |
| Arizona: | 28.5 |
| Marana: | 19.7% |
| Arizona: | 20.8% |
| Here: | 8.8% |
| Arizona: | 10.2% |
| Here: | 6.8 |
| Arizona: | 6.8 |
| This city: | 33.6% |
| State: | 33.5% |
| Marana: | 59.4% |
| State: | 56.1% |
| Marana: | 81.1% |
| Arizona: | 79.4% |
More about Health and Nutrition of Marana, AZ Residents
| Local government employment and payroll (March 2022) | |||||
| Function | Full-time employees | Monthly full-time payroll | Average yearly full-time wage | Part-time employees | Monthly part-time payroll |
|---|---|---|---|---|---|
| Police Protection - Officers | 95 | $652,780 | $82,456 | 0 | $0 |
| Streets and Highways | 58 | $294,190 | $60,867 | 0 | $0 |
| Parks and Recreation | 50 | $203,262 | $48,783 | 7 | $5,793 |
| Other Government Administration | 49 | $293,135 | $71,788 | 0 | $0 |
| Financial Administration | 30 | $173,331 | $69,332 | 1 | $2,928 |
| Police - Other | 29 | $125,280 | $51,840 | 0 | $0 |
| Water Supply | 28 | $145,507 | $62,360 | 1 | $2,398 |
| Judicial and Legal | 20 | $110,478 | $66,287 | 1 | $1,017 |
| Housing and Community Development (Local) | 10 | $51,265 | $61,518 | 1 | $2,148 |
| Sewerage | 6 | $31,267 | $62,534 | 0 | $0 |
| Airports | 4 | $16,825 | $50,475 | 0 | $0 |
| Totals for Government | 379 | $2,097,319 | $66,406 | 11 | $14,284 |
Marana government finances - Expenditure in 2021 (per resident):
- Construction - Regular Highways: $12,440,000 ($222.29)
Police Protection: $7,186,000 ($128.41)
General - Other: $3,836,000 ($68.55)
Parks and Recreation: $970,000 ($17.33)
Housing and Community Development: $40,000 ($0.71)
- Current Operations - Police Protection: $14,719,000 ($263.02)
Water Utilities: $5,237,000 ($93.58)
Regular Highways: $5,041,000 ($90.08)
Central Staff Services: $4,438,000 ($79.30)
Parks and Recreation: $4,324,000 ($77.27)
Judicial and Legal Services: $2,074,000 ($37.06)
General Public Buildings: $1,105,000 ($19.75)
Financial Administration: $1,048,000 ($18.73)
Protective Inspection and Regulation - Other: $1,011,000 ($18.07)
Sewerage: $997,000 ($17.82)
Housing and Community Development: $658,000 ($11.76)
Air Transportation: $468,000 ($8.36)
General - Other: $22,000 ($0.39)
- General - Interest on Debt: $3,538,000 ($63.22)
- Other Capital Outlay - Central Staff Services: $984,000 ($17.58)
Regular Highways: $515,000 ($9.20)
Parks and Recreation: $217,000 ($3.88)
Police Protection: $49,000 ($0.88)
General Public Building: $23,000 ($0.41)
- Total Salaries and Wages: $21,792,000 ($389.41)
- Water Utilities - Interest on Debt: $21,000 ($0.38)
Marana government finances - Revenue in 2021 (per resident):
- Charges - Sewerage: $1,671,000 ($29.86)
Other: $749,000 ($13.38)
Natural Resources - Other: $569,000 ($10.17)
Parks and Recreation: $367,000 ($6.56)
Air Transportation: $97,000 ($1.73)
- Federal Intergovernmental - Housing and Community Development: $73,000 ($1.30)
- Local Intergovernmental - Highways: $3,404,000 ($60.83)
Other: $11,000 ($0.20)
- Miscellaneous - Special Assessments: $1,833,000 ($32.75)
Interest Earnings: $1,068,000 ($19.08)
Fines and Forfeits: $382,000 ($6.83)
Rents: $256,000 ($4.57)
Sale of Property: $44,000 ($0.79)
Donations From Private Sources: $2,000 ($0.04)
- Revenue - Water Utilities: $6,268,000 ($112.00)
- State Intergovernmental - General Local Government Support: $13,135,000 ($234.71)
Other: $4,471,000 ($79.89)
Highways: $3,945,000 ($70.49)
- Tax - General Sales and Gross Receipts: $41,983,000 ($750.21)
Other Selective Sales: $7,655,000 ($136.79)
Other License: $5,638,000 ($100.75)
Public Utilities Sales: $610,000 ($10.90)
Other: $282,000 ($5.04)
Occupation and Business License - Other: $176,000 ($3.14)
Public Utility License: $92,000 ($1.64)
Alcoholic Beverage License: $5,000 ($0.09)
Marana government finances - Debt in 2021 (per resident):
- Long Term Debt - Beginning Outstanding - Unspecified Public Purpose: $69,828,000 ($1247.78)
Outstanding Unspecified Public Purpose: $66,465,000 ($1187.68)
Beginning Outstanding - Public Debt for Private Purpose: $21,232,000 ($379.40)
Outstanding Nonguaranteed - Industrial Revenue: $18,953,000 ($338.68)
Retired Unspecified Public Purpose: $3,363,000 ($60.09)
Retired Nonguaranteed - Public Debt for Private Purpose: $2,279,000 ($40.72)
Marana government finances - Cash and Securities in 2021 (per resident):
- Sinking Funds - Cash and Securities: $42,779,000 ($764.43)
5.84% of this county's 2021 resident taxpayers lived in other counties in 2020 ($71,876 average adjusted gross income)
| Here: | 5.84% |
| Arizona average: | 6.85% |
0.07% of residents moved from foreign countries ($644 average AGI)
Pima County: 0.07% Arizona average: 0.03%
Top counties from which taxpayers relocated into this county between 2020 and 2021:
| from Maricopa County, AZ | |
| from Pinal County, AZ | |
| from Cochise County, AZ |
5.17% of this county's 2020 resident taxpayers moved to other counties in 2021 ($65,979 average adjusted gross income)
| Here: | 5.17% |
| Arizona average: | 5.72% |
0.06% of residents moved to foreign countries ($677 average AGI)
Pima County: 0.06% Arizona average: 0.03%
Top counties to which taxpayers relocated from this county between 2020 and 2021:
| to Maricopa County, AZ | |
| to Pinal County, AZ | |
| to Cochise County, AZ |
| Businesses in Marana, AZ | ||||
| Name | Count | Name | Count | |
|---|---|---|---|---|
| Arby's | 1 | McDonald's | 2 | |
| Best Western | 1 | Motel 6 | 1 | |
| Burger King | 2 | OfficeMax | 1 | |
| CVS | 1 | Starbucks | 3 | |
| Carl\s Jr. | 1 | Subway | 1 | |
| Circle K | 6 | Super 8 | 1 | |
| Cracker Barrel | 1 | T-Mobile | 2 | |
| Domino's Pizza | 1 | The Room Place | 1 | |
| Kroger | 1 | U-Haul | 1 | |
| Little Caesars Pizza | 2 | UPS | 1 | |
| Marriott | 1 | Walgreens | 1 | |
| MasterBrand Cabinets | 1 | |||
Strongest AM radio stations in Marana:
- KUAZ (1550 AM; daytime; 50 kW; TUCSON, AZ; Owner: ARIZONA BOARD OF REGENTS)
- KFLT (830 AM; 50 kW; TUCSON, AZ; Owner: FAMILY LIFE B/CING SYSTEM, INC.)
- KEVT (1030 AM; 10 kW; CORTARO, AZ; Owner: ONE MART CORP.)
- KTKT (990 AM; 10 kW; TUCSON, AZ; Owner: ARIZONA LOTUS CORP.)
- KSAZ (580 AM; 5 kW; MARANA, AZ; Owner: OWL BROADCASTING & DEVELOPMENT, INC.)
- KNST (790 AM; 5 kW; TUCSON, AZ)
- KJLL (1330 AM; 5 kW; SOUTH TUCSON, AZ; Owner: HUDSON COMMUNICATIONS, INC)
- KQTL (1210 AM; 10 kW; SAHUARITA, AZ; Owner: RADIO UNICA OF TUCSON LICENSE CORP.)
- KCUB (1290 AM; 1 kW; TUCSON, AZ; Owner: CITADEL BROADCASTING COMPANY)
- KTUC (1400 AM; 1 kW; TUCSON, AZ; Owner: CITADEL BROADCASTING COMPANY)
- KGMS (940 AM; 1 kW; TUCSON, AZ)
- KMIK (1580 AM; 50 kW; TEMPE, AZ; Owner: ABC, INC.)
- KMIA (710 AM; 50 kW; BLACK CANYON CITY, AZ; Owner: ENTRAVISION HOLDINGS, LLC)
Strongest FM radio stations in Marana:
- KUAZ-FM (89.1 FM; TUCSON, AZ; Owner: ARIZONA BOARD OF REGENTS)
- KLPX (96.1 FM; TUCSON, AZ; Owner: ARIZONA LOTUS CORPORATION)
- KIIM-FM (99.5 FM; TUCSON, AZ; Owner: CITADEL BROADCASTING COMPANY)
- KOYT (92.9 FM; TUCSON, AZ; Owner: CAPSTAR TX LIMITED PARTNERSHIP)
- KHYT (107.5 FM; TUCSON, AZ; Owner: CITADEL BROADCASTING COMPANY)
- KRQQ (93.7 FM; TUCSON, AZ; Owner: CAPSTAR TX LIMITED PARTNERSHIP)
- KMXZ-FM (94.9 FM; TUCSON, AZ; Owner: JOURNAL BROADCAST CORPORATION)
- KZLZ-FM2 (105.3 FM; TUCSON, AZ; Owner: ENTRAVISION HOLDINGS, LLC)
- K263AA (100.5 FM; TUCSON, AZ; Owner: EDUCATIONAL MEDIA FOUNDATION)
- KXCI (91.3 FM; TUCSON, AZ; Owner: FOUNDATION FOR CREATIVE BROADCASTING, INC.)
- K255AC (98.9 FM; TUCSON, AZ; Owner: MARICOPA COUNTY COMMUN. COLLEGE DIST)
- KUAT-FM (90.5 FM; TUCSON, AZ; Owner: ARIZONA BOARD OF REGENTS)
- K292CM (106.3 FM; SUMMERHAVEN, AZ; Owner: ARIZONA LOTUS CORPORATION)
- KZLZ-FM1 (105.3 FM; TUCSON, AZ; Owner: ENTRAVISION HOLDINGS, LLC)
- KCDX (103.1 FM; FLORENCE, AZ; Owner: DESERT WEST AIR RANCHERS CORPORATION)
- KSZR (97.5 FM; ORO VALLEY, AZ; Owner: CITADEL BROADCASTING COMPANY)
- KOHT (98.3 FM; MARANA, AZ; Owner: CLEAR CHANNEL BROADCASTING LICENSES, INC.)
- KGMG (106.3 FM; ORACLE, AZ; Owner: JOURNAL BROADCAST CORPORATION)
- KWFM-FM (97.1 FM; GREEN VALLEY, AZ; Owner: CAPSTAR TX LIMITED PARTNERSHIP)
- K261CK (100.1 FM; SAN XAVIER, AZ; Owner: WORLD RADIO NETWORK, INC.)
TV broadcast stations around Marana:
- KHRR (Channel 40; TUCSON, AZ; Owner: NBC TELEMUNDO PHOENIX, INC.)
- K54FW (Channel 54; TUCSON, AZ; Owner: TRINITY BROADCASTING OF ARIZONA, INC)
- KTTU-TV (Channel 18; TUCSON, AZ; Owner: KTTU-TV, INC.)
- KTLL-LP (Channel 65; TUCSON, AZ; Owner: LA LUZ BROADCASTING, INC.)
- K48GX (Channel 48; TUCSON, AZ; Owner: KTVW LICENSE PARTNERSHIP, G.P.)
- KUVE-CA (Channel 38; TUCSON, AZ; Owner: KTVW LICENSE PARTNERSHIP, G.P.)
- K07DA (Channel 7; CASAS ADOBES, AZ; Owner: RAYCOM AMERICA, INC.)
- National Bridge Inventory (NBI) Statistics
- 87Number of bridges
- 1,099ft / 335mTotal length
- $35,000Total costs
- 2,060,324Total average daily traffic
- 264,510Total average daily truck traffic
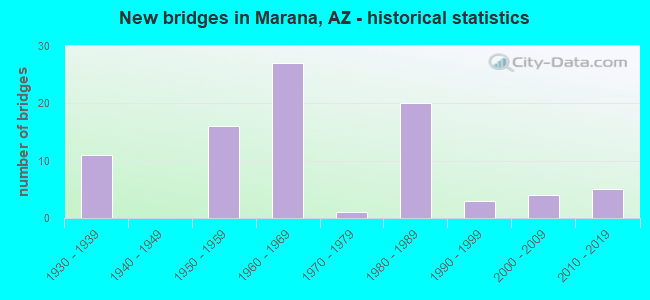
- New bridges - historical statistics
- 111930-1939
- 161950-1959
- 271960-1969
- 11970-1979
- 201980-1989
- 31990-1999
- 42000-2009
- 52010-2019
FCC Registered Antenna Towers: 109 (See the full list of FCC Registered Antenna Towers)
FCC Registered Commercial Land Mobile Towers: 1 (See the full list of FCC Registered Commercial Land Mobile Towers in Marana, AZ)
FCC Registered Private Land Mobile Towers: 2 (See the full list of FCC Registered Private Land Mobile Towers)
FCC Registered Broadcast Land Mobile Towers: 27 (See the full list of FCC Registered Broadcast Land Mobile Towers)
FCC Registered Microwave Towers: 94 (See the full list of FCC Registered Microwave Towers in this town)
FCC Registered Maritime Coast & Aviation Ground Towers: 12 (See the full list of FCC Registered Maritime Coast & Aviation Ground Towers)
FCC Registered Amateur Radio Licenses: 226 (See the full list of FCC Registered Amateur Radio Licenses in Marana)
FAA Registered Aircraft: 112 (See the full list of FAA Registered Aircraft in Marana)
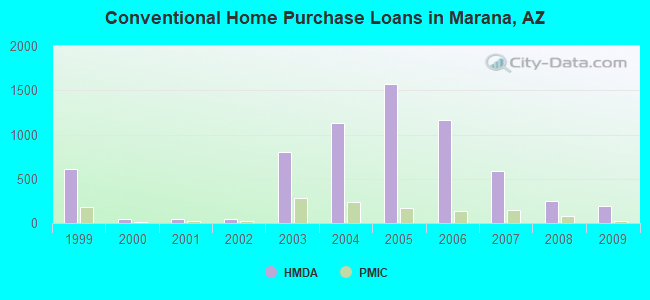
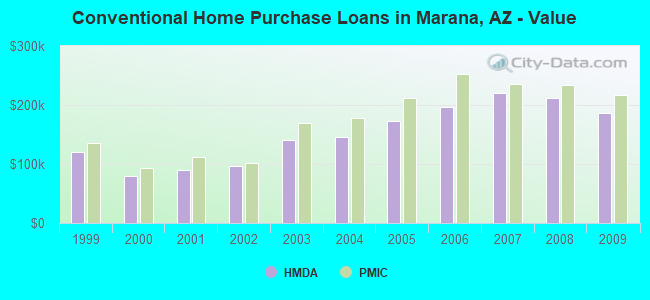
| Home Mortgage Disclosure Act Aggregated Statistics For Year 2009 (Based on 7 partial tracts) | ||||||||||||
| A) FHA, FSA/RHS & VA Home Purchase Loans | B) Conventional Home Purchase Loans | C) Refinancings | D) Home Improvement Loans | F) Non-occupant Loans on < 5 Family Dwellings (A B C & D) | G) Loans On Manufactured Home Dwelling (A B C & D) | |||||||
|---|---|---|---|---|---|---|---|---|---|---|---|---|
| Number | Average Value | Number | Average Value | Number | Average Value | Number | Average Value | Number | Average Value | Number | Average Value | |
| LOANS ORIGINATED | 296 | $184,041 | 189 | $187,077 | 720 | $195,393 | 13 | $108,907 | 93 | $195,616 | 21 | $110,218 |
| APPLICATIONS APPROVED, NOT ACCEPTED | 12 | $197,436 | 13 | $189,351 | 63 | $207,151 | 4 | $117,152 | 7 | $180,621 | 4 | $83,855 |
| APPLICATIONS DENIED | 36 | $183,330 | 14 | $234,799 | 246 | $212,123 | 14 | $101,584 | 19 | $251,842 | 17 | $99,672 |
| APPLICATIONS WITHDRAWN | 21 | $202,582 | 24 | $186,723 | 159 | $209,925 | 9 | $91,271 | 13 | $183,579 | 7 | $124,587 |
| FILES CLOSED FOR INCOMPLETENESS | 8 | $187,044 | 7 | $203,801 | 39 | $188,115 | 1 | $21,920 | 5 | $226,778 | 2 | $103,070 |
Detailed HMDA statistics for the following Tracts: 0044.16 , 0044.18, 0044.20, 0046.12, 0046.13, 0046.38, 0046.39
| Private Mortgage Insurance Companies Aggregated Statistics For Year 2009 (Based on 7 partial tracts) | ||||||
| A) Conventional Home Purchase Loans | B) Refinancings | C) Non-occupant Loans on < 5 Family Dwellings (A & B) | ||||
|---|---|---|---|---|---|---|
| Number | Average Value | Number | Average Value | Number | Average Value | |
| LOANS ORIGINATED | 25 | $216,132 | 10 | $208,858 | 1 | $267,680 |
| APPLICATIONS APPROVED, NOT ACCEPTED | 10 | $257,498 | 9 | $257,393 | 1 | $165,680 |
| APPLICATIONS DENIED | 1 | $337,360 | 4 | $253,775 | 0 | $0 |
| APPLICATIONS WITHDRAWN | 2 | $263,815 | 1 | $289,090 | 0 | $0 |
| FILES CLOSED FOR INCOMPLETENESS | 1 | $187,730 | 1 | $157,040 | 1 | $187,730 |
Detailed PMIC statistics for the following Tracts: 0044.16 , 0044.18, 0044.20, 0046.12, 0046.13, 0046.38, 0046.39
2003 - 2018 National Fire Incident Reporting System (NFIRS) incidents
- Fire incident types reported to NFIRS in Marana, AZ
- 87148.6%Outside Fires
- 47026.2%Mobile Property/Vehicle Fires
- 32418.1%Structure Fires
- 1287.1%Other
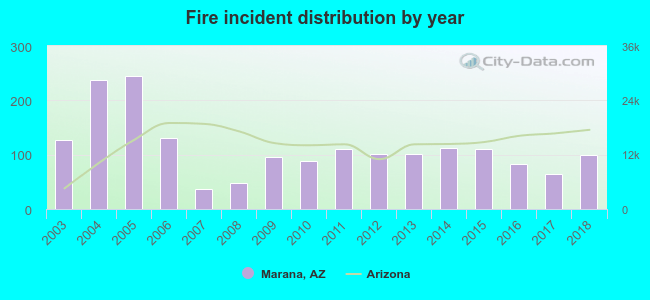 Based on the data from the years 2003 - 2018 the average number of fires per year is 112. The highest number of fire incidents - 244 took place in 2005, and the least - 37 in 2007. The data has a declining trend.
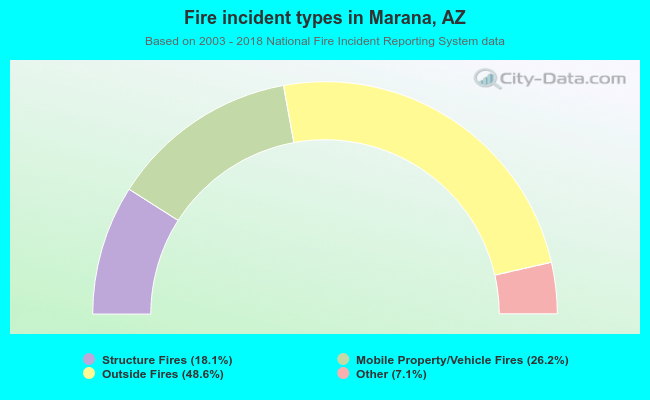 When looking into fire subcategories, the most reports belonged to: Outside Fires (48.6%), and Mobile Property/Vehicle Fires (26.2%).
Fire-safe hotels and motels in Marana, Arizona:
- Best Western Gold Poppy Inn, 4930 W Ina Rd, Marana, Arizona 85743 , Phone: (520) 579-7202, Fax: (520) 579-3894
- The Ritz-Carlton Dove Mountain, 15000 N Secret Springs Dr, Marana, Arizona 85658 , Phone: (520) 572-3000
- Holiday Inn Express, 8373 Cracker Barrel Rd, Marana, Arizona 85743 , Phone: (520) 572-4777, Fax: (520) 572-4666
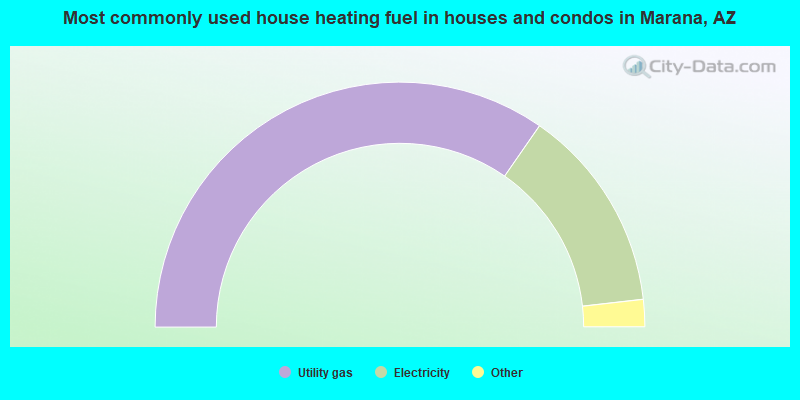
- 69.3%Utility gas
- 27.1%Electricity
- 2.6%Solar energy
- 1.0%Bottled, tank, or LP gas
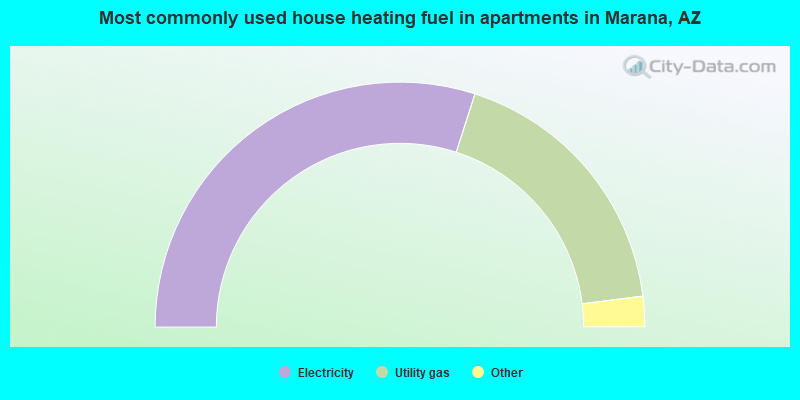
- 60.0%Electricity
- 36.1%Utility gas
- 3.1%Bottled, tank, or LP gas
- 0.8%No fuel used
Marana compared to Arizona state average:
- Unemployed percentage significantly below state average.
- Black race population percentage significantly above state average.
- Hispanic race population percentage significantly above state average.
- Foreign-born population percentage significantly above state average.
- Renting percentage below state average.
- House age significantly below state average.
- Number of college students above state average.
- Percentage of population with a bachelor's degree or higher above state average.
Marana on our top lists:
- #38 on the list of "Top 101 cities with most building permits per 10,000 residents (population 5,000+)"
- #11 on the list of "Top 101 counties with the highest Particulate Matter (PM10) Annual air pollution readings in 2012 (µg/m3)"
- #14 on the list of "Top 101 counties with the highest ground withdrawal of fresh water for public supply"
- #29 on the list of "Top 101 counties with the highest carbon monoxide air pollution readings in 2012 (ppm)"
- #35 on the list of "Top 101 counties with the most Other congregations"
- #45 on the list of "Top 101 counties with the highest total withdrawal of fresh water for public supply (pop. 50,000+)"

|
|
Total of 95 patent applications in 2008-2024.