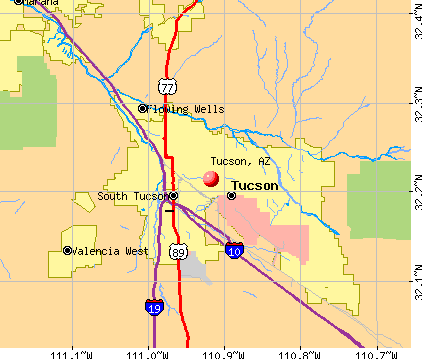
Tucson, Arizona
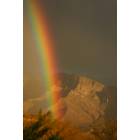
Tucson: Pusch Ridge rainbow
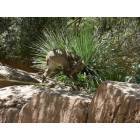
Tucson: "Darn Fleas!"
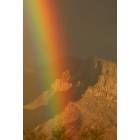
Tucson: Pusch Ridge rainbow
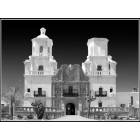
Tucson: San Xavier Mission built in the late 16th century
Tucson: Tranquility
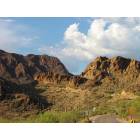
Tucson: Tucson Mt.Park-Tucson AZ.
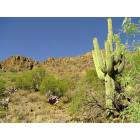
Tucson: Tucson Sonoran desert
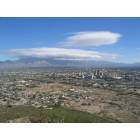
Tucson: Overlooking Tucson from Sentinel Peak
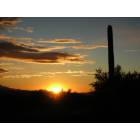
Tucson: Sunset in Tucson

Tucson: Downtown Tucson from "A peak" looking North
Tucson: Downton Tucson at night
- see
105
more - add
your
Submit your own pictures of this city and show them to the world
- OSM Map
- General Map
- Google Map
- MSN Map
Population change since 2000: +12.3%
 |
| Males: 272,497 | |
| Females: 274,077 |
| Median resident age: | 33.8 years |
| Arizona median age: | 38.8 years |
Zip codes: 85701, 85706, 85707, 85708, 85710, 85711, 85714, 85719, 85723, 85724, 85726, 85730, 85745.
Tucson Zip Code Map| Tucson: | $51,281 |
| AZ: | $74,568 |
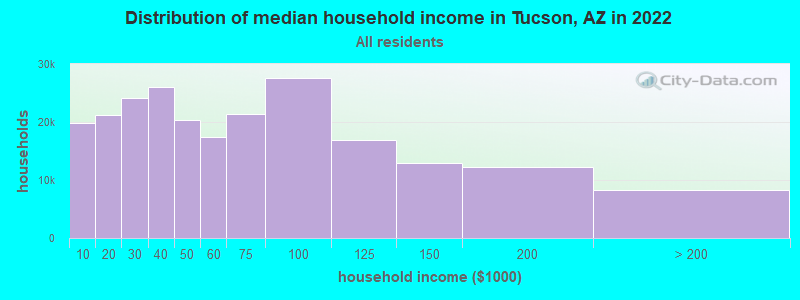
Estimated per capita income in 2022: $30,456 (it was $16,322 in 2000)
Tucson city income, earnings, and wages data
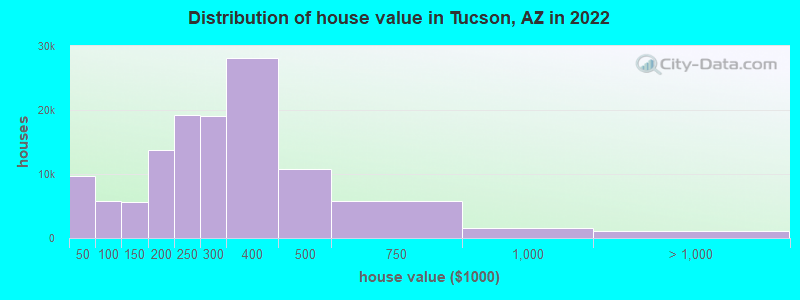
Estimated median house or condo value in 2022: $268,000 (it was $91,200 in 2000)
| Tucson: | $268,000 |
| AZ: | $402,800 |
Mean prices in 2022: all housing units: $295,085; detached houses: $308,227; townhouses or other attached units: $227,918; in 2-unit structures: over $1,000,000; in 3-to-4-unit structures: $196,320; in 5-or-more-unit structures: $226,703; mobile homes: $65,019; occupied boats, rvs, vans, etc.: $18,208
Median gross rent in 2022: $1,051.
(16.7% for White Non-Hispanic residents, 24.3% for Black residents, 21.5% for Hispanic or Latino residents, 30.7% for American Indian residents, 44.7% for Native Hawaiian and other Pacific Islander residents, 22.1% for other race residents, 18.2% for two or more races residents)
Detailed information about poverty and poor residents in Tucson, AZ


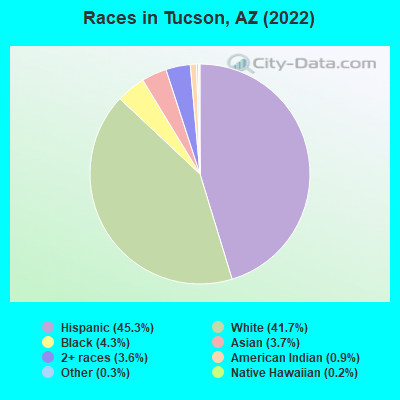
- 247,49845.3%Hispanic
- 227,76041.7%White alone
- 23,5694.3%Black alone
- 20,4213.7%Asian alone
- 19,9313.6%Two or more races
- 4,9260.9%American Indian alone
- 1,3970.3%Other race alone
- 1,0960.2%Native Hawaiian and Other
Pacific Islander alone
According to our research of Arizona and other state lists, there were 1,382 registered sex offenders living in Tucson, Arizona as of April 27, 2024.
The ratio of all residents to sex offenders in Tucson is 384 to 1.
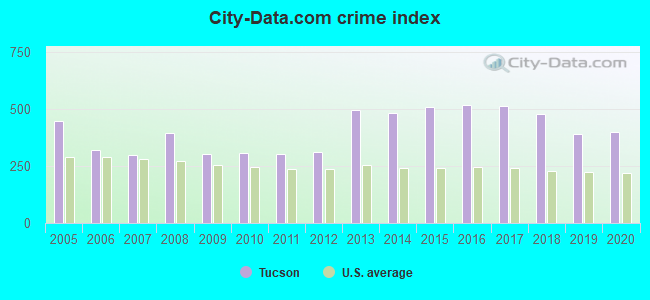
The City-Data.com crime index weighs serious crimes and violent crimes more heavily. Higher means more crime, U.S. average is 246.1. It adjusts for the number of visitors and daily workers commuting into cities.
- means the value is smaller than the state average.- means the value is about the same as the state average.
- means the value is bigger than the state average.
- means the value is much bigger than the state average.
Crime rate in Tucson detailed stats: murders, rapes, robberies, assaults, burglaries, thefts, arson
Full-time law enforcement employees in 2021, including police officers: 1,059 (820 officers - 696 male; 124 female).
| Officers per 1,000 residents here: | 1.47 |
| Arizona average: | 1.75 |
 Recent articles from our blog. Our writers, many of them Ph.D. graduates or candidates, create easy-to-read articles on a wide variety of topics.


Latest news from Tucson, AZ collected exclusively by city-data.com from local newspapers, TV, and radio stations
Ancestries: German (5.2%), English (3.9%), American (3.7%), Irish (3.6%), Italian (2.2%), European (2.1%).
Current Local Time: MST (no DST) time zone
Incorporated in 1877
Elevation: 2491 feet
Land area: 194.7 square miles.
Population density: 2,808 people per square mile (average).
78,928 residents are foreign born (9.6% Latin America, 2.5% Asia).
| This city: | 14.4% |
| Arizona: | 13.0% |
Median real estate property taxes paid for housing units with mortgages in 2022: $1,682 (0.6%)
Median real estate property taxes paid for housing units with no mortgage in 2022: $1,586 (0.7%)
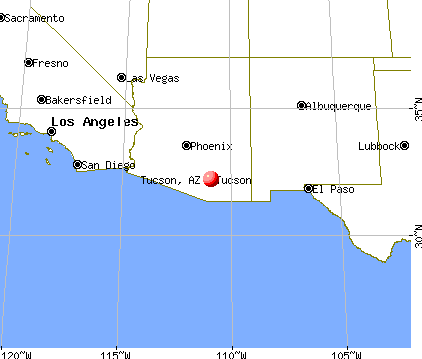
Nearest city with pop. 1,000,000+: Phoenix, AZ  (113.1 miles , pop. 1,321,045).
Nearest cities:
), ), ), ), )Latitude: 32.21 N, Longitude: 110.92 W
Daytime population change due to commuting: +58,258 (+10.7%)
Workers who live and work in this city: 207,307 (80.6%)
Area code: 520
Property values in Tucson, AZ
Detailed articles:
- Tucson: Introduction
- Tucson Basic Facts
- Tucson: Communications
- Tucson: Convention Facilities
- Tucson: Economy
- Tucson: Education and Research
- Tucson: Geography and Climate
- Tucson: Health Care
- Tucson: History
- Tucson: Municipal Government
- Tucson: Population Profile
- Tucson: Recreation
- Tucson: Transportation
Tucson tourist attractions:
- American Antique Mall - Tucson, AZ - Huge antique store
- Arizona State Museum - Tucson, AZ - Anthropology museum
- Arizona-Sonora Desert Museum in Tucson, Arizona
- Casino of the Sun - Tucson, AZ - Popular casino
- Catalina State Park - Tucson, Arizona - Large Arizona State Park
- Desert Diamond Casino - Tucson, AZ - Premier gambling facility
- El Con Mall - Tucson, Arizona - Shopping Mall
- El Presidio Park - Tucson, AZ - City park
- Foothills Mall - Tucson, Arizona - Shopping Center, Restaurants and Movie Theater
- Fourth Avenue - Tucson, AZ - Historic shopping district
- Funtasticks Family Fun Park - Tucson, Arizona - small family tourist attraction
- Golden Gate Mountain - Tucson, AZ - Scenic mountain
- International Wildlife Museum - Tucson, AZ - Natural history museum
- Kino Sports Complex - Tucson, AZ - Sports and baseball venue
- Kitt Peak National Optical Astronomy Observatory - Tucson, Arizona Astronomical Observatory and Space Center
- Miraval Arizona - Tucson, AZ - Luxurious and exclusive spa resort
- Mission San Xavier del Bac - Tucson, AZ - 18th Century church
- Edward Nye Fish House
- El Centro Cultural de las Americas
- El Rio Neighborhood Center Murals
- El Tiradito Shrine
- Environmental Research Lab
- Finger Rock Trail
- Fort Lowell Museum
- Franklin Museum
- Golf N' Stuff Family Fun Center
- Greasewood Park
- J. Knox Corbett House
- La Casa Cordova
- Main Street Arts District
- Mount Lemmon Ski Valley
- Museum of Contemporary Art - Tucson
- Old Pueblo Trolley
- Joesler Village
- Picture Rocks Miniature Horse Ranch
- Pima Canyon
- Pima County Courthouse
- Pinery Canyon Loop
- Pioneer Memorial
- Postal History Foundation
- Rialto Theatre
- Rillito Park Horse Racetrack
- Rillito River Park
- Romero House
- Santa Cruz Church
- Santa Fe Square and Galleria
- Sosa-Carillo-Fremont House Museum
- Arizona-Sonora Desert Museum
- Southside Presbyterian Church
- Spanish Trail Outfitters
- Madera Canyon
- Tohono Chul Park
- Aeroball Sports Courts
- A Mountain (Sentinel Park)
- Arizona Stadium
- Arizona Trail
- Bank One Building
- Barrio Historico
- Sportspark
- St. Augustine Cathedral
- St. Phillip's in the Hills
- Starr Pass Golf Club
- Steinfeld Mansion
- Stevens House
- The Mini-Time Machine Museum of Miniatures
- Traildust Adventure Tours
- Tucson Convention and Visitor Bureau
- University of Arizona Museum of Art
- University of Arizona
- Tucson Symphony Orchestra
- Tucson Raceway Park
- Tucson Electric Park
- Valley of the Moon
- Southwestern International Raceway
- Arizona Inn
- Canyon Ranch
- Hilton El Conquistador Resort and Country Club
- JW Marriott Starr Pass Resort and Spa
- Loews Ventana Canyon Resort
- Omni Tucson National Golf Resort and Spa
- Westin La Paloma Resort and Spa
- Westward Look Resort
- Arizona Historical Society Tucson Main Museum
- Gates Pass
- Berger Performing Arts Center
- Catalina American Baptist Church
- Center for Creative Photography
- Chapel of San Pedro
- Santa Catalina Mountains - Mount Lemmon, AZ - a large mountain range in Arizona
- Old Tucson Studios - Tucson, Arizona - Old West themed park
- P1 Kart Circuit - Tucson, AZ - Premier karting facility
- Park Place - Tucson, Arizona - Shopping Mall Featuring 20 Screen Cinema
- Pima Air & Space Museum - Tucson, Arizona - Large-Scale Aerospace Museum
- Reid Park Zoo - Tucson, Arizona - mid-sized zoo and tourist attraction
- Reid Park - Tucson, AZ - Park, playground and zoo
- Sabino Canyon - Tucson, Arizona - Natural Desert Oasis
- Sentinel Peak - Tucson, AZ - Mountain ridge in Arizona
- Tucson Botanical Gardens - Tucson, Arizona - Collection of Botanical Gardens
- Tucson Children's Museum - Tucson, Arizona - Southern Arizona's Only Children's Museum
- Tucson Convention Center - Tucson, AZ - Events and concert center
- Tucson International Airport
- Tucson Mall - Tucson, Arizona - Shopping and Entertainment Complex
- Tucson Mountain Park - Tucson, Arizona - Natural Desert Preserve
- Tucson Museum of Art - Tucson, AZ - Art museum
Tucson, Arizona accommodation & food services, waste management - Economy and Business Data
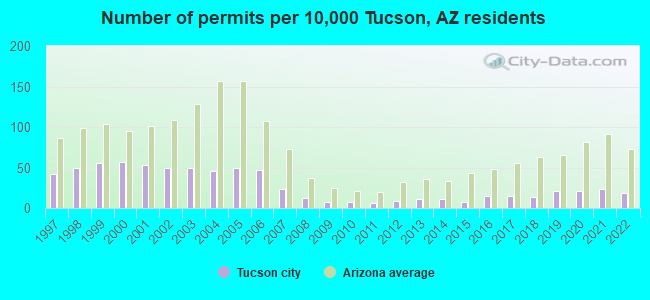
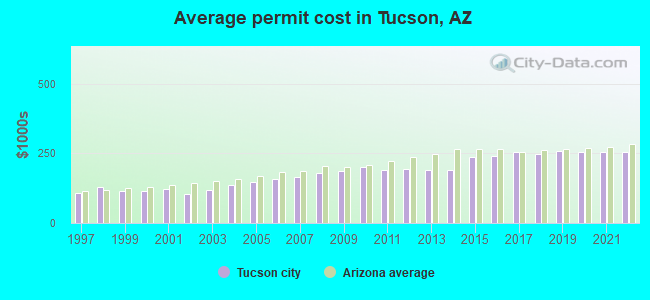
Single-family new house construction building permits:
- 2022: 918 buildings, average cost: $254,900
- 2021: 1134 buildings, average cost: $255,100
- 2020: 1043 buildings, average cost: $254,500
- 2019: 999 buildings, average cost: $256,500
- 2018: 680 buildings, average cost: $248,700
- 2017: 709 buildings, average cost: $255,100
- 2016: 713 buildings, average cost: $240,700
- 2015: 358 buildings, average cost: $238,400
- 2014: 517 buildings, average cost: $191,400
- 2013: 517 buildings, average cost: $191,400
- 2012: 426 buildings, average cost: $191,900
- 2011: 302 buildings, average cost: $189,800
- 2010: 344 buildings, average cost: $200,100
- 2009: 362 buildings, average cost: $187,700
- 2008: 565 buildings, average cost: $179,100
- 2007: 1131 buildings, average cost: $165,000
- 2006: 2297 buildings, average cost: $157,400
- 2005: 2421 buildings, average cost: $147,200
- 2004: 2243 buildings, average cost: $137,200
- 2003: 2425 buildings, average cost: $117,600
- 2002: 2407 buildings, average cost: $104,500
- 2001: 2564 buildings, average cost: $121,700
- 2000: 2764 buildings, average cost: $115,900
- 1999: 2715 buildings, average cost: $113,500
- 1998: 2404 buildings, average cost: $129,300
- 1997: 2063 buildings, average cost: $108,200
| Here: | 3.8% |
| Arizona: | 3.8% |
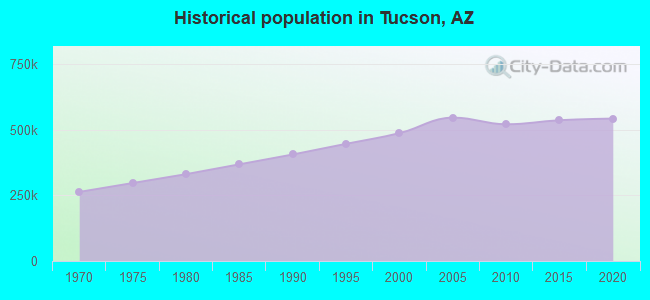
Population change in the 1990s: +68,770 (+16.5%).
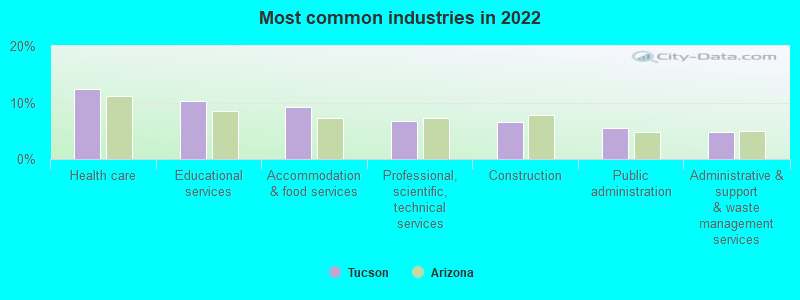
- Health care (12.4%)
- Educational services (10.2%)
- Accommodation & food services (9.3%)
- Professional, scientific, technical services (6.8%)
- Construction (6.6%)
- Public administration (5.5%)
- Administrative & support & waste management services (4.8%)
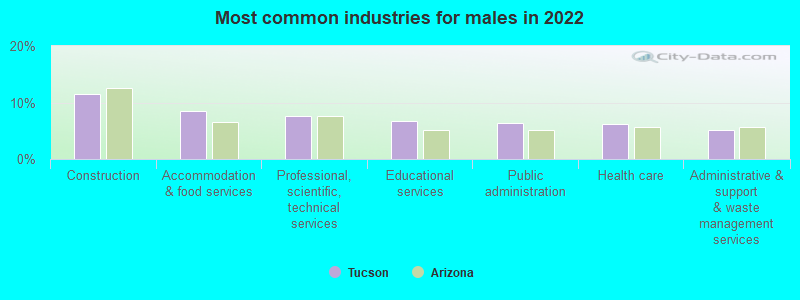
- Construction (11.4%)
- Accommodation & food services (8.4%)
- Professional, scientific, technical services (7.5%)
- Educational services (6.8%)
- Public administration (6.3%)
- Health care (6.3%)
- Administrative & support & waste management services (5.2%)
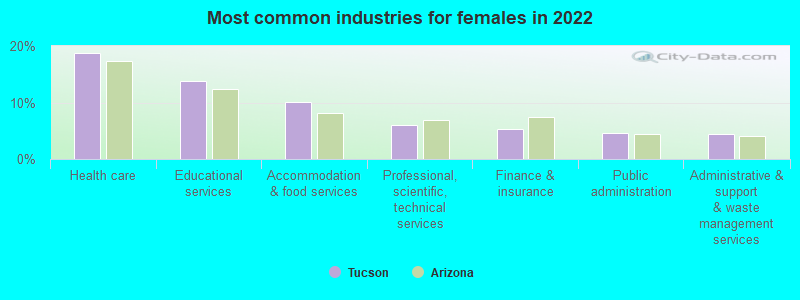
- Health care (18.8%)
- Educational services (13.9%)
- Accommodation & food services (10.2%)
- Professional, scientific, technical services (6.0%)
- Finance & insurance (5.3%)
- Public administration (4.6%)
- Administrative & support & waste management services (4.4%)
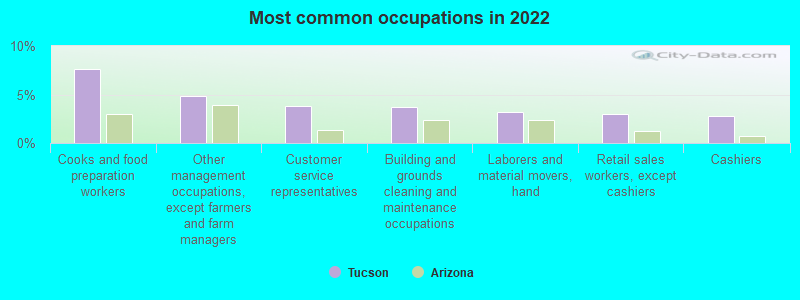
- Cooks and food preparation workers (7.7%)
- Other management occupations, except farmers and farm managers (4.9%)
- Customer service representatives (3.8%)
- Building and grounds cleaning and maintenance occupations (3.7%)
- Laborers and material movers, hand (3.2%)
- Retail sales workers, except cashiers (3.0%)
- Cashiers (2.8%)
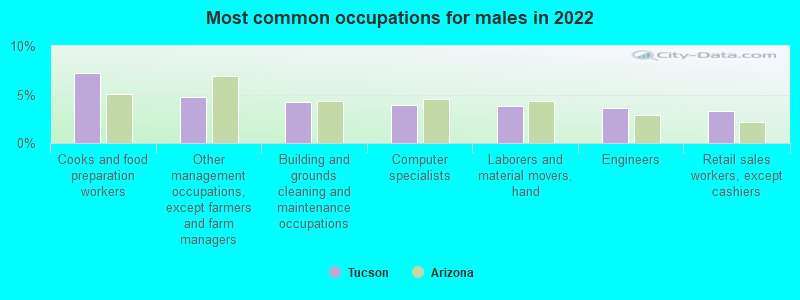
- Cooks and food preparation workers (7.2%)
- Other management occupations, except farmers and farm managers (4.7%)
- Building and grounds cleaning and maintenance occupations (4.3%)
- Computer specialists (3.9%)
- Laborers and material movers, hand (3.8%)
- Engineers (3.6%)
- Retail sales workers, except cashiers (3.3%)
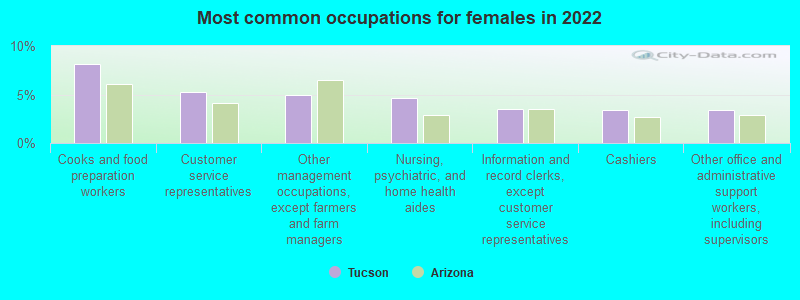
- Cooks and food preparation workers (8.2%)
- Customer service representatives (5.2%)
- Other management occupations, except farmers and farm managers (5.0%)
- Nursing, psychiatric, and home health aides (4.6%)
- Information and record clerks, except customer service representatives (3.5%)
- Cashiers (3.4%)
- Other office and administrative support workers, including supervisors (3.4%)
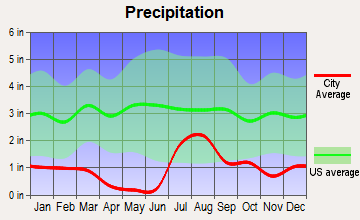
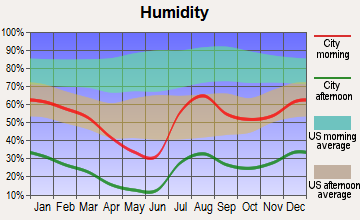
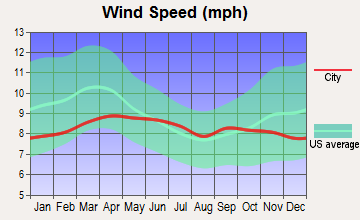
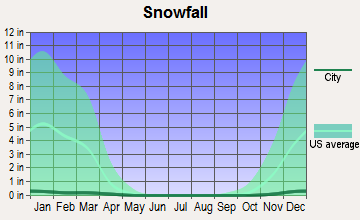
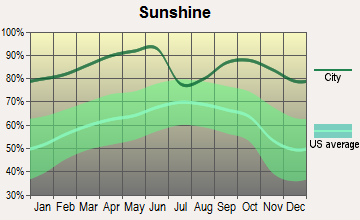
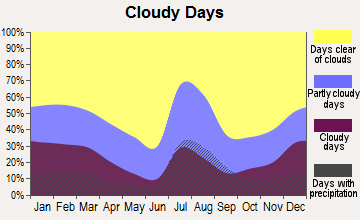
Average climate in Tucson, Arizona
Based on data reported by over 4,000 weather stations

|
|

(lower is better)
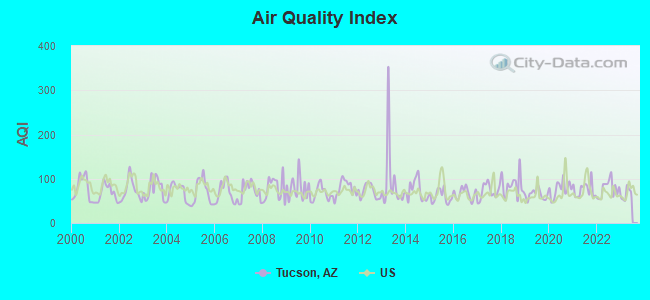
Air Quality Index (AQI) level in 2022 was 77.7. This is about average.
| City: | 77.7 |
| U.S.: | 72.6 |
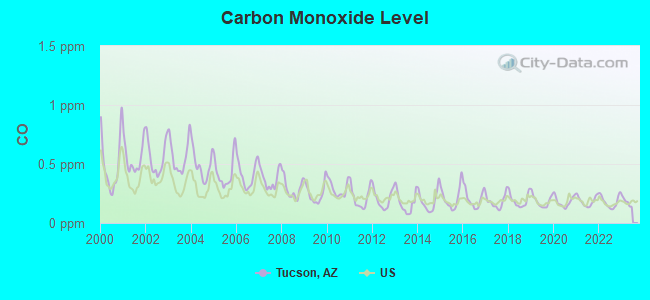
Carbon Monoxide (CO) [ppm] level in 2022 was 0.180. This is better than average. Closest monitor was 2.2 miles away from the city center.
| City: | 0.180 |
| U.S.: | 0.251 |
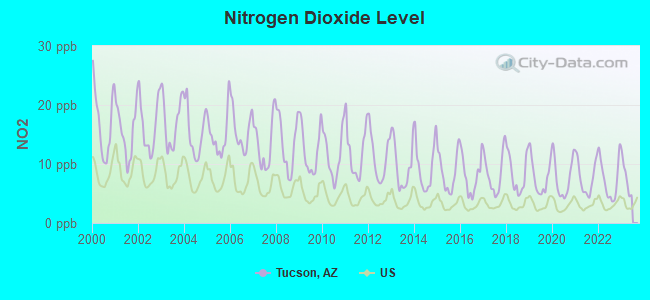
Nitrogen Dioxide (NO2) [ppb] level in 2022 was 7.42. This is significantly worse than average. Closest monitor was 2.3 miles away from the city center.
| City: | 7.42 |
| U.S.: | 5.11 |
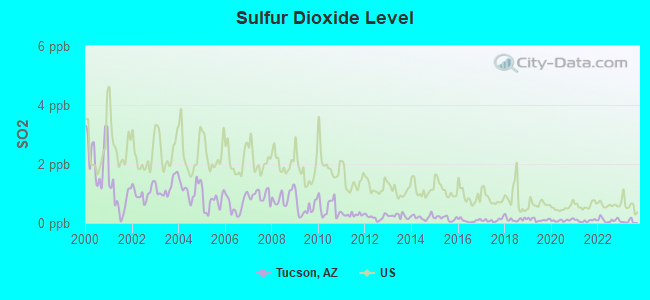
Sulfur Dioxide (SO2) [ppb] level in 2022 was 0.102. This is significantly better than average. Closest monitor was 2.3 miles away from the city center.
| City: | 0.102 |
| U.S.: | 1.515 |
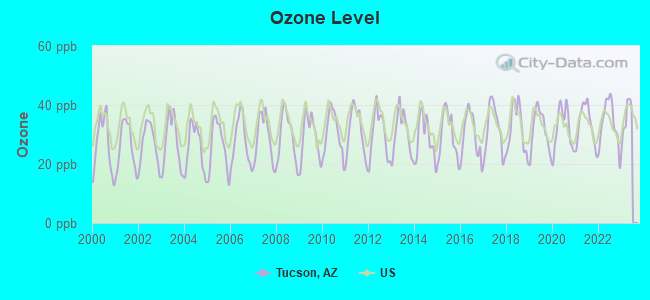
Ozone [ppb] level in 2022 was 33.8. This is about average. Closest monitor was 2.4 miles away from the city center.
| City: | 33.8 |
| U.S.: | 33.3 |
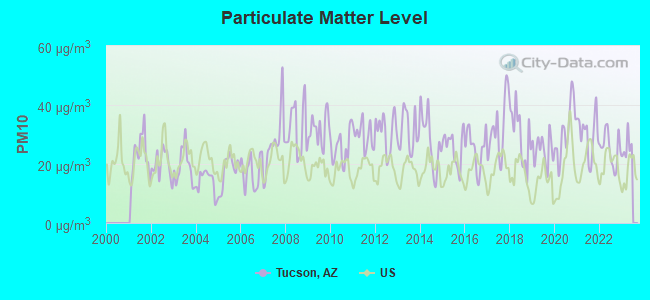
Particulate Matter (PM10) [µg/m3] level in 2022 was 25.2. This is worse than average. Closest monitor was 1.5 miles away from the city center.
| City: | 25.2 |
| U.S.: | 19.2 |
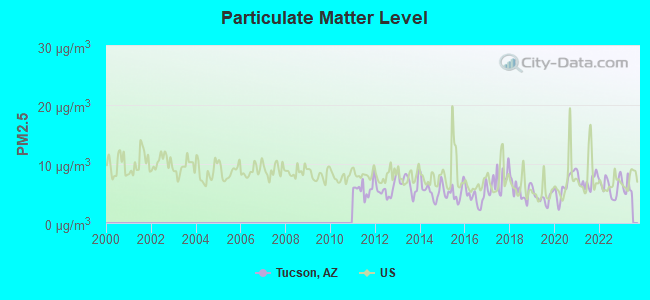
Particulate Matter (PM2.5) [µg/m3] level in 2022 was 6.13. This is better than average. Closest monitor was 6.7 miles away from the city center.
| City: | 6.13 |
| U.S.: | 8.11 |
Earthquake activity:
Tucson-area historical earthquake activity is significantly above Arizona state average. It is 1485% greater than the overall U.S. average.On 6/28/1992 at 11:57:34, a magnitude 7.6 (6.2 MB, 7.6 MS, 7.3 MW, Depth: 0.7 mi, Class: Major, Intensity: VIII - XII) earthquake occurred 352.2 miles away from the city center, causing 3 deaths (1 shaking deaths, 2 other deaths) and 400 injuries, causing $100,000,000 total damage and $40,000,000 insured losses
On 5/19/1940 at 04:36:40, a magnitude 7.2 (7.2 UK) earthquake occurred 286.7 miles away from Tucson center, causing $33,000,000 total damage
On 12/31/1934 at 18:45:56, a magnitude 7.1 (7.1 UK) earthquake occurred 284.5 miles away from the city center
On 10/16/1999 at 09:46:44, a magnitude 7.4 (6.3 MB, 7.4 MS, 7.2 MW, 7.3 ML) earthquake occurred 356.1 miles away from the city center
On 10/15/1979 at 23:16:54, a magnitude 7.0 (5.7 MB, 6.9 MS, 7.0 ML, 6.4 MW) earthquake occurred 278.4 miles away from the city center
On 11/24/1987 at 13:15:56, a magnitude 6.7 (6.0 MB, 6.6 MS, 6.7 ML, 6.1 ML, Class: Strong, Intensity: VII - IX) earthquake occurred 299.1 miles away from the city center
Magnitude types: body-wave magnitude (MB), local magnitude (ML), surface-wave magnitude (MS), moment magnitude (MW)
Natural disasters:
The number of natural disasters in Pima County (13) is near the US average (15).Major Disasters (Presidential) Declared: 10
Emergencies Declared: 1
Causes of natural disasters: Floods: 9, Storms: 8, Fires: 2, Hurricane: 1, Tornado: 1, Other: 1 (Note: some incidents may be assigned to more than one category).
Main business address for: LXU Healthcare, Inc. (ELECTROMEDICAL & ELECTROTHERAPEUTIC APPARATUS), VENTANA MEDICAL SYSTEMS INC (SURGICAL & MEDICAL INSTRUMENTS & APPARATUS), TUCSON ELECTRIC POWER CO (ELECTRIC SERVICES), UNISOURCE ENERGY CORP (ELECTRIC SERVICES), IONATRON, INC. (SEARCH, DETECTION, NAVIGATION, GUIDANCE, AERONAUTICAL SYS), BRONCO ENERGY FUND, INC. ([9995]).
Hospitals in Tucson:
- AMERICAN TRANSITIONAL HOSPITAL, INC (3838 NORTH CAMPBELL AVE)
- CARONDELET HOSPICE AND PALLIATIVE CARE (1802 WEST ST. MARY'S ROAD)
- CARONDELET ST JOSEPH'S HOSPITAL (Voluntary non-profit - Other, provides emergency services, 350 NORTH WILMOT ROAD)
- DESERT LIFE DAY SURGERY (2001 WEST ORANGE GROVE RD SUITE 114)
- HEARTLAND HOME HEALTH CARE AND HOSPICE (2980 NORTH CAMPBELL AVE, SUITE 190 B)
- JACOB C FRUCHTHENDLER JEWISH COMMUNITY HOSPICE (2221 NORTH ROSEMONT)
- QUALITY LIFESTYLES HOSPICE (6200 EAST 14TH STREET #B130)
- T M C HOSPICE AKA PEPPI'S HOUSE (HOME HOSPICE) (5301 EAST GRANT ROAD)
- UNIVERSITY OF ARIZONA MEDICAL CTR- SOUTH CAM, THE (Voluntary non-profit - Private, 2800 EAST AJO WAY)
- VA S. ARIZONA HEALTHCARE SYSTEM (Government Federal, 3601 SOUTH SIXTH AVENUE)
- VENCOR HOSPITAL - TUCSON (355 NORTH WILMOT ROAD)
Airports, heliports and other landing facilities located in Tucson:
- Tucson International Airport (TUS) (Runways: 3, Commercial Ops: 31,311, Air Taxi Ops: 19,195, Itinerant Ops: 38,970, Local Ops: 23,575, Military Ops: 15,904)
- Ryan Field Airport (RYN) (Runways: 3, Air Taxi Ops: 20, Itinerant Ops: 41,626, Local Ops: 69,247, Military Ops: 3,987)
- La Cholla Airpark Airport (57AZ) (Runways: 2, Local Ops: 4,000)
- Davis Monthan Afb Airport (DMA) (Runways: 1)
- Flying Diamond Airport (6AZ8) (Runways: 1)
- Heliports: 7
- El Tiro Gliderport (AZ67)
Biggest Colleges/Universities in Tucson:
- University of Arizona (Full-time enrollment: 36,324; Location: 1401 E University; Public; Website: www.arizona.edu; Offers Doctor's degree)
- Pima Community College (Full-time enrollment: 18,794; Location: 4905C East Broadway Blvd.; Public; Website: www.pima.edu)
- Pima Medical Institute-Tucson (Full-time enrollment: 2,357; Location: 3350 East Grant Road, Suite 200; Private, for-profit; Website: pmi.edu)
- University of Phoenix-Southern Arizona Campus (Full-time enrollment: 1,552; Location: 300 S. Craycroft Road; Private, for-profit; Website: www.phoenix.edu; Offers Master's degree)
- Brown Mackie College-Tucson (Full-time enrollment: 685; Location: 4585 E Speedway Blvd.; Private, for-profit; Website: www.brownmackie.edu)
- ITT Technical Institute-Tucson (Full-time enrollment: 468; Location: 1455 W. River Rd; Private, for-profit; Website: www.itt-tech.edu)
- The Art Institute of Tucson (Full-time enrollment: 451; Location: 5099 E. Grant Rd. #100; Private, for-profit; Website: www.artinstitutes.edu/tucson)
- Tucson College (Full-time enrollment: 391; Location: 5151 E Broadway Blvd, Ste.155; Private, for-profit; Website: www.tucsoncollege.edu)
- Brookline College-Tucson (Full-time enrollment: 387; Location: 5441 E. 22nd St, Ste.125; Private, for-profit; Website: www.brooklinecollege.edu)
- Carrington College-Tucson (Full-time enrollment: 379; Location: 3550 N Oracle Rd.; Private, for-profit; Website: www.carrington.edu)
- Southwest University of Visual Arts-Tucson (Full-time enrollment: 284; Location: 2525 N Country Club Rd; Private, for-profit; Website: www.suva.edu; Offers Master's degree)
- Empire Beauty School-Tucson (Full-time enrollment: 215; Location: 3030 E Speedway Blvd; Private, for-profit; Website: www.empire.edu)
- Cortiva Institute-Tucson (Full-time enrollment: 188; Location: 6390 E. Broadway, Suite 100; Private, for-profit; Website: www.cortiva.com/)
- Aveda Institute-Tucson (Full-time enrollment: 131; Location: 845 North Park Avenue; Private, for-profit; Website: www.avedaschooltucson.com)
- HDS Truck Driving Institute (Full-time enrollment: 115; Location: 6251 S. Wilmot Road; Private, for-profit; Website: www.hdstruckdrivinginstitute.com)
- Regency Beauty Institute-East Tucson (Full-time enrollment: 97; Location: 7225 E. Broadway Blvd., Suite 170; Private, for-profit; Website: www.regency.edu)
- Tucson College of Beauty (Full-time enrollment: 95; Location: 3955 N Flowing Wells Rd; Private, for-profit; Website: tucsoncollegeofbeauty.com)
- Regency Beauty Institute-North Tucson (Full-time enrollment: 94; Location: 625 E Wetmore, Suite F-109; Private, for-profit; Website: www.regency.edu)
- Arizona Academy of Beauty-East (Full-time enrollment: 61; Location: 5631 E Speedway Blvd; Private, for-profit; Website: www.arizonaacademy.com)
- Arizona Academy of Beauty-North (Full-time enrollment: 60; Location: 4066 N Oracle; Private, for-profit; Website: www.arizonaacademy.com)
Other colleges/universities with over 2000 students near Tucson:
- Central Arizona College (about 67 miles; Coolidge, AZ; Full-time enrollment: 4,893)
- Eastern Arizona College (about 81 miles; Thatcher, AZ; FT enrollment: 3,810)
- Arizona State University-Polytechnic (about 88 miles; Mesa, AZ; FT enrollment: 3,311)
- Chandler-Gilbert Community College (about 91 miles; Chandler, AZ; FT enrollment: 8,047)
- Cochise College (about 94 miles; Douglas, AZ; FT enrollment: 8,597)
- Mesa Community College (about 99 miles; Mesa, AZ; FT enrollment: 14,726)
- University of Phoenix-Phoenix Campus (about 103 miles; Tempe, AZ; FT enrollment: 3,862)
Biggest private high schools in Tucson:
- SALPOINTE CATHOLIC HIGH SCHOOL (Students: 1,071, Location: 1545 E COPPER ST, Grades: 9-12)
- PUSCH RIDGE CHRISTIAN ACADEMY (Students: 473, Location: 9500 N ORACLE RD, Grades: 6-12)
- DESERT CHRISTIAN SCHOOL (Students: 367, Location: 7525 E SPEEDWAY BLVD, Grades: KG-12)
- ST GREGORY COLLEGE PREPARATORY SCHOOL (Students: 303, Location: 3231 N CRAYCROFT RD, Grades: 6-12)
- GREEN FIELDS COUNTRY DAY SCHOOL (Students: 183, Location: 6000 N CAMINO DE LA TIERRA, Grades: KG-12)
- ST AUGUSTINE CATHOLIC HIGH SCHOOL (Students: 121, Location: 8800 E 22ND ST, Grades: 9-12)
- RIVER OF LIFE CHRISTIAN SCHOOL (Students: 85, Location: 6902 E GOLF LINKS RD, Grades: KG-12)
- NELLIE P COVERT SCHOOL (Students: 24, Location: 2700 S 8TH AVE, Grades: 1-12)
- FAITH CHRISTIAN ACADEMY (Students: 15, Location: 2555 W VALENCIA RD, Grades: 6-10)
- FENSTER SCHOOL (Students: 13, Location: 8505 E OCOTILLO DR, Grades: 9-12)
Biggest private elementary/middle schools in Tucson:
- ST ELIZABETH ANN SETON SCHOOL (Students: 530, Location: 8650 N SHANNON RD, Grades: PK-8)
- SS PETER & PAUL CATHOLIC SCHOOL (Students: 416, Location: 1436 N CAMPBELL AVE, Grades: KG-8)
- ST CYRIL ELEMENTARY SCHOOL (Students: 384, Location: 4725 E PIMA ST, Grades: KG-8)
- OUR MOTHER OF SORROWS SCHOOL (Students: 376, Location: 1800 S KOLB RD, Grades: PK-8)
- ST MICHAEL'S PARISH DAY SCHOOL (Students: 345, Location: 602 N WILMOT RD, Grades: KG-8)
- ST AMBROSE SCHOOL (Students: 271, Location: 300 S TUCSON BLVD, Grades: PK-8)
- ST JOSEPH CATHOLIC SCHOOL (Students: 262, Location: 215 S CRAYCROFT RD, Grades: PK-8)
- FAMILY LIFE ACADEMY (Students: 244, Location: 7801 E KENYON DR, Grades: PK-6)
- SANTA CRUZ CATHOLIC SCHOOL (Students: 193, Location: 29 W 22ND ST, Grades: PK-8)
- ST JOHN THE EVANGELIST NOTRE DAME ACE ACADEMY (Students: 165, Location: 600 W AJO WAY, Grades: PK-8)
Library in Tucson:
User-submitted facts and corrections:
- KTZR is now 97.1 FM... 1450 AM is KWFM...
- Kino Community hospital is now University Physicians Hospital at Kino
- Birthplace of: Sean Elliot College (Arizona Wildcats) basketball and NBA (San Antonio Spurs) player (born Feb. 2, 1968)
Points of interest:
Notable locations in Tucson: United States Geological Survey Magnetic Observatory (A), Amphi Plaza (B), Christopher City University of Arizona (C), El Rio Country Club (D), El Tangue Golf Course (E), Randolph Municipal Golf Course (F), Tucson Trap and Skeet Club (G), University of Arizona Experiment Farm (H), University of Arizona Farm (I), University of Arizona Geochronology Laboratories (J), El Dorado Country Club (K), El Paso Natural Gas Company Compressor Station (L), El Rio Golf Course (M), Fred Enke Golf Course (N), Silverbell Golf Course (O), Arizona Correctional Training Facility (P), Berkshire Village (Q), PFE Yard (R), Miracle Mile Exchange (S), Park Avenue Industrial Center (T). Display/hide their locations on the map
Shopping Centers: Campbell Plaza Shopping Center (1), Colonia Verde Shopping Center (2), Decorator Square Shopping Center (3), Del Norte Shopping Center (4), Desert Square Shopping Center (5), Flowing Wells Plaza Shopping Center (6), Fort Lowell Shopping Center (7), Grant Park Shopping Center (8), Grantstone Shopping Center (9). Display/hide their locations on the map
Main business address in Tucson include: TUCSON ELECTRIC POWER CO (A), UNISOURCE ENERGY CORP (B). Display/hide their locations on the map
Churches in Tucson include: Saint Judes Anglican Church (A), Saint Joseph Roman Catholic Church (B), Saint James United Methodist Church (C), Saint Demetrios Greek Orthodox Church (D), Saint Cyril's of Alexandria Roman Catholic Church (E), Saint Augustine Cathedral (F), Saint Andrew's Episcopal Church (G), Saint Ambrose Church (H), Sahuaro Baptist Church (I). Display/hide their locations on the map
Cemeteries: Holy Hope Cemetery and Mausoleum (1), South Lawn Memorial Cemetery (2), All Faiths Memorial Park (3), East Lawn Palms Cemetery (4), Tucson Pioneer Cemetery (5), Evergreen Memorial Park (6), Pima County Cemetery (7). Display/hide their locations on the map
Streams, rivers, and creeks: Kennedy Park Creek (A), Agua Caliente Wash (B), Pantano Wash (C), Pima Wash (D), Arroyo Chico (E), Julian Wash (F), West Branch Santa Cruz River (G). Display/hide their locations on the map
Parks in Tucson include: Hi Corbett Field (1), Navajo Park (2), Mission Park (3), Himmel Park (4), Fort Lowell Park (5), Santa Rita Park (6), Swan Park (7), John F Kennedy Park (8), Conner Park (9). Display/hide their locations on the map
Tourist attractions: GPD Toy Train Museum (3975 North Miller Avenue) (1), International Wildlife Museum (4800 West Gates Passage Road) (2), Ironwood Terraces (Museums; 2021 North Kinney Road) (3), Bates Dan Bronze Sculptures (Museums; 6541 East Tanque Verde Road) (4), International Biopcrk Foundation Inc (Museums; 1202 North Main Avenue) (5), Museum of the Horse Soldier (6541 East Tanque Verde Road) (6), C & L Electrostatic Painting (Museums; 837 East 36th Street) (7), Arizona Historical Society - FT Lowell Museum (2900 North Craycroft Road) (8), Arizona Historical Society - Sosa-Carrillo-Fremont House Museum (151 South Granada Avenue) (9). Display/hide their approximate locations on the map
Hotels: LA Quinta (6404 East Broadway Boulevard) (1), Casa Tierra Adobe B & B Inn (11155 West Calle Pima) (2), Best Western Executive Inn (333 West Drachman Street) (3), Days Inn (4855 South Palo Verde Road) (4), Lazy (8 Motel Highway I 10 & 6 A) (5), Arizonan Motel (437 West Miracle Mile) (6), Howard Johnson (1010 South Freeway Road) (7), Copper Cactus Inn (225 West Drachman Street) (8), Oasis Motel (1701 North Oracle Road) (9). Display/hide their approximate locations on the map
Courts: United States Government - Courts- District Court- Magistrate Judges- Camuth Jam (55 East Broadway Boulevard) (1), Arizona State - Court Of Appeals-Division Two- Court Of Appeals-Div (400 West Congress Street Suite 131) (2), Tucson City Government - City Court- City Court Information English-Spa (103 East Alameda Street) (3), Arizona State - Juvenile Corrections Department- Secure Schools-Assistant Dire (14500 North Oracle Road) (4), Arizona State Government - Supreme Court-Arizona- Judicial Administrative Assis (400 West Congress Street) (5), United States Government Courts Bankruptcy Court La Placita Vill (110 South Church) (6), Arizona State Government - Court Of Appeals-Div Two (400 West Congress Street) (7), United States Government - Courts- District Court- Evo A De Concini Federal Courth (450 West Paseo Redondo Suite 200) (8), Pima County Government - Juvenile Court Center- Center For Juvenile Alternat (630 East 9th Street) (9). Display/hide their approximate locations on the map
Birthplace of: Raúl Grijalva - Politician, Cornelius C. Smith - Army Medal of Honor recipient, Roy Brown (clown) - Puppeteer, Barbara Eden - (born 1934), actress, Kerri Strug - Gymnast, Mark Udall, Raymond Pettibon - American artist, Thad Allen - Coast Guard admiral, Sean Elliott - Basketball player, Dan Hicks (sportscaster).
Drinking water stations with addresses in Tucson and their reported violations in the past:
METROPOLITAN DWID (Address: 6265 N LA CANADA DR , Population served: 43,433, Groundwater):Past monitoring violations:FLOWING WELLS IRRIGATION DISTRICT (Address: 3901 N FAIRVIEW , Population served: 15,500, Groundwater):
- Follow-up Or Routine LCR Tap M/R - In OCT-01-2013, Contaminant: Lead and Copper Rule. Follow-up actions: St Violation/Reminder Notice (DEC-23-2013), St Compliance achieved (FEB-06-2014)
- Monitoring and Reporting (DBP) - Between OCT-2006 and DEC-2006, Contaminant: Chlorine. Follow-up actions: St Compliance achieved (FEB-06-2007)
- Monitoring and Reporting (DBP) - Between JUL-2006 and SEP-2006, Contaminant: Chlorine. Follow-up actions: St Compliance achieved (DEC-06-2006)
- Monitoring and Reporting (DBP) - Between JAN-2006 and MAR-2006, Contaminant: TTHM. Follow-up actions: St Compliance achieved (OCT-26-2007)
- Monitoring and Reporting (DBP) - Between JAN-2006 and MAR-2006, Contaminant: Total Haloacetic Acids (HAA5). Follow-up actions: St Compliance achieved (OCT-26-2007)
- 2 routine major monitoring violations
- 6 minor monitoring violations
- 142 regular monitoring violations
- 9 other older monitoring violations
Past monitoring violations:AVRA WATER COOP INC (Address: 11821 W PICTURE ROCKS RD , Population served: 8,360, Groundwater):
- Follow-up Or Routine LCR Tap M/R - In OCT-01-2009, Contaminant: Lead and Copper Rule. Follow-up actions: St Compliance achieved (SEP-16-2010)
- Monitoring and Reporting (DBP) - Between JUL-2009 and SEP-2009, Contaminant: Chlorine. Follow-up actions: St Compliance achieved (DEC-29-2009)
- Monitoring and Reporting (DBP) - Between JAN-2009 and MAR-2009, Contaminant: Total Haloacetic Acids (HAA5). Follow-up actions: St Compliance achieved (MAR-11-2014)
- Monitoring and Reporting (DBP) - Between JAN-2009 and MAR-2009, Contaminant: TTHM. Follow-up actions: St Compliance achieved (MAR-11-2014)
- Monitoring and Reporting (DBP) - Between JUL-2008 and SEP-2008, Contaminant: Total Haloacetic Acids (HAA5). Follow-up actions: St Compliance achieved (OCT-20-2008)
- 4 minor monitoring violations
- 248 regular monitoring violations
- 15 other older monitoring violations
Past health violations:METROPOLITAN DWID - HUB (Address: 6265 N LA CANADA DR , Population served: 4,570, Groundwater):Past monitoring violations:
- MCL, Average - Between OCT-2007 and DEC-2007, Contaminant: Arsenic. Follow-up actions: State No Longer Subject to Rule (APR-03-2008)
- MCL, Average - Between OCT-2007 and DEC-2007, Contaminant: Arsenic. Follow-up actions: State No Longer Subject to Rule (APR-03-2008)
- MCL, Average - Between OCT-2007 and DEC-2007, Contaminant: Arsenic. Follow-up actions: State No Longer Subject to Rule (APR-03-2008)
- MCL, Average - Between OCT-2007 and DEC-2007, Contaminant: Arsenic. Follow-up actions: State No Longer Subject to Rule (APR-03-2008)
- MCL, Average - Between OCT-2007 and DEC-2007, Contaminant: Arsenic. Follow-up actions: State No Longer Subject to Rule (APR-03-2008)
- MCL, Average - Between OCT-2007 and DEC-2007, Contaminant: Arsenic. Follow-up actions: State No Longer Subject to Rule (APR-03-2008)
- Monitoring and Reporting (DBP) - Between JAN-2008 and DEC-2008, Contaminant: TTHM. Follow-up actions: St Violation/Reminder Notice (FEB-12-2009), St Compliance achieved (MAR-25-2009)
- Monitoring and Reporting (DBP) - Between JAN-2008 and DEC-2008, Contaminant: Total Haloacetic Acids (HAA5). Follow-up actions: St Violation/Reminder Notice (FEB-12-2009), St Compliance achieved (MAR-25-2009)
- Monitoring and Reporting (DBP) - Between JAN-2007 and DEC-2007, Contaminant: TTHM. Follow-up actions: St Compliance achieved (MAR-25-2009)
- Monitoring and Reporting (DBP) - Between JAN-2007 and DEC-2007, Contaminant: Total Haloacetic Acids (HAA5). Follow-up actions: St Compliance achieved (MAR-25-2009)
- Monitoring and Reporting (DBP) - Between JAN-2006 and DEC-2006, Contaminant: TTHM. Follow-up actions: St Compliance achieved (MAR-25-2009)
- 9 minor monitoring violations
- 6 regular monitoring violations
- 5 other older monitoring violations
Past health violations:ADOC TUCSON (Population served: 4,500, Groundwater):Past monitoring violations:
- MCL, Monthly (TCR) - In JUL-2014, Contaminant: Coliform
- Monitoring, Repeat Major (TCR) - In JUL-2007, Contaminant: Coliform (TCR). Follow-up actions: St Compliance achieved (MAY-14-2008)
- Monitoring and Reporting (DBP) - Between JAN-2007 and DEC-2009, Contaminant: TTHM. Follow-up actions: St Compliance achieved (JUL-11-2012)
- Monitoring and Reporting (DBP) - Between JAN-2007 and DEC-2009, Contaminant: Total Haloacetic Acids (HAA5). Follow-up actions: St Compliance achieved (JUL-11-2012)
- Monitoring and Reporting (DBP) - Between OCT-2006 and DEC-2006, Contaminant: Chlorine. Follow-up actions: St Compliance achieved (FEB-06-2007)
- Monitoring, Repeat Major (TCR) - In AUG-2006, Contaminant: Coliform (TCR). Follow-up actions: St Compliance achieved (APR-18-2007)
- 6 routine major monitoring violations
- One minor monitoring violation
- 4 other older monitoring violations
Past monitoring violations:METROPOLITAN DWID - DIABLO VILLAGE (Address: 6265 N LA CANADA DR , Population served: 3,304, Groundwater):
- Monitoring and Reporting (DBP) - Between JUL-2013 and SEP-2013, Contaminant: Chlorine. Follow-up actions: St Compliance achieved (2 times from FEB-10-2014 to FEB-27-2014)
- Follow-up Or Routine LCR Tap M/R - In OCT-01-2009, Contaminant: Lead and Copper Rule. Follow-up actions: St Compliance achieved (MAR-03-2014)
- Monitoring and Reporting (DBP) - Between JAN-2008 and DEC-2008, Contaminant: TTHM. Follow-up actions: St Compliance achieved (SEP-30-2009)
- Monitoring and Reporting (DBP) - Between JUL-2007 and SEP-2007, Contaminant: Chlorine
- Monitoring and Reporting (DBP) - Between APR-2007 and JUN-2007, Contaminant: Chlorine. Follow-up actions: St Compliance achieved (OCT-03-2007)
- One routine major monitoring violation
- 7 minor monitoring violations
- 142 regular monitoring violations
- 17 other older monitoring violations
Past health violations:LOS CERROS WATER COMPANY (Address: 4003 N FLOWING WELLS RD , Population served: 3,295, Groundwater):Past monitoring violations:
- MCL, Average - Between OCT-2007 and DEC-2007, Contaminant: Arsenic. Follow-up actions: St Violation/Reminder Notice (APR-17-2008), St Compliance achieved (NOV-03-2008)
- Monitoring and Reporting (DBP) - Between OCT-2009 and DEC-2009, Contaminant: Chlorine. Follow-up actions: St Violation/Reminder Notice (FEB-01-2010), St Compliance achieved (APR-08-2010)
- Monitoring and Reporting (DBP) - Between JUL-2009 and SEP-2009, Contaminant: Chlorine. Follow-up actions: St Compliance achieved (FEB-18-2010)
- Monitoring and Reporting (DBP) - Between APR-2009 and JUN-2009, Contaminant: Chlorine. Follow-up actions: St Violation/Reminder Notice (JUL-31-2009), St Compliance achieved (AUG-10-2009)
- Monitoring and Reporting (DBP) - Between OCT-2008 and DEC-2008, Contaminant: Chlorine. Follow-up actions: St Compliance achieved (APR-20-2009)
- Monitoring and Reporting (DBP) - Between OCT-2008 and DEC-2008, Contaminant: Chlorine. Follow-up actions: St Violation/Reminder Notice (FEB-13-2009)
- 4 routine major monitoring violations
- 7 minor monitoring violations
- 18 regular monitoring violations
- 6 other older monitoring violations
Past monitoring violations:MARANA MUNICIPAL - HARTMAN VISTAS (Address: 5100 W INA RD , Population served: 2,698, Groundwater):
- Monitoring and Reporting (DBP) - Between JAN-2011 and DEC-2011, Contaminant: TTHM. Follow-up actions: St Compliance achieved (MAY-30-2012)
- Monitoring and Reporting (DBP) - Between JAN-2011 and DEC-2011, Contaminant: Total Haloacetic Acids (HAA5). Follow-up actions: St Compliance achieved (MAY-30-2012)
- Monitoring and Reporting (DBP) - Between JAN-2010 and DEC-2010, Contaminant: TTHM. Follow-up actions: St Compliance achieved (MAY-30-2012)
- Monitoring and Reporting (DBP) - Between JAN-2010 and MAR-2010, Contaminant: Chlorine. Follow-up actions: St Compliance achieved (JUN-10-2010)
- Monitoring and Reporting (DBP) - Between JAN-2010 and DEC-2010, Contaminant: Total Haloacetic Acids (HAA5). Follow-up actions: St Compliance achieved (MAY-30-2012)
- 3 routine major monitoring violations
- 4 minor monitoring violations
- 7 regular monitoring violations
- 9 other older monitoring violations
Past monitoring violations:
- Monitoring and Reporting (DBP) - Between JAN-2010 and DEC-2010, Contaminant: TTHM. Follow-up actions: St Compliance achieved (OCT-26-2012)
- Monitoring and Reporting (DBP) - Between JAN-2010 and DEC-2010, Contaminant: Total Haloacetic Acids (HAA5). Follow-up actions: St Compliance achieved (OCT-26-2012)
- Monitoring and Reporting (DBP) - Between APR-2008 and JUN-2008, Contaminant: Chlorine. Follow-up actions: St Compliance achieved (JUL-31-2008)
- Monitoring and Reporting (DBP) - Between JAN-2008 and DEC-2008, Contaminant: TTHM. Follow-up actions: St Violation/Reminder Notice (FEB-12-2009), St Compliance achieved (OCT-06-2009)
- Monitoring and Reporting (DBP) - Between JAN-2008 and DEC-2008, Contaminant: Total Haloacetic Acids (HAA5). Follow-up actions: St Violation/Reminder Notice (FEB-12-2009), St Compliance achieved (OCT-06-2009)
- 9 routine major monitoring violations
- One regular monitoring violation
- 13 other older monitoring violations
| This city: | 2.4 people |
| Arizona: | 2.6 people |
| This city: | 56.6% |
| Whole state: | 66.2% |
| This city: | 8.8% |
| Whole state: | 7.8% |
Likely homosexual households (counted as self-reported same-sex unmarried-partner households)
- Lesbian couples: 0.6% of all households
- Gay men: 0.4% of all households
People in group quarters in Tucson in 2010:
- 6,768 people in college/university student housing
- 4,409 people in state prisons
- 1,798 people in nursing facilities/skilled-nursing facilities
- 1,595 people in local jails and other municipal confinement facilities
- 1,497 people in federal prisons
- 1,144 people in other noninstitutional facilities
- 1,063 people in group homes intended for adults
- 658 people in military barracks and dormitories (nondisciplinary)
- 421 people in workers' group living quarters and job corps centers
- 393 people in emergency and transitional shelters (with sleeping facilities) for people experiencing homelessness
- 339 people in residential treatment centers for adults
- 231 people in group homes for juveniles (non-correctional)
- 106 people in correctional residential facilities
- 89 people in residential schools for people with disabilities
- 87 people in correctional facilities intended for juveniles
- 78 people in hospitals with patients who have no usual home elsewhere
- 22 people in in-patient hospice facilities
- 8 people in residential treatment centers for juveniles (non-correctional)
People in group quarters in Tucson in 2000:
- 6,861 people in college dormitories (includes college quarters off campus)
- 4,272 people in state prisons
- 2,425 people in other noninstitutional group quarters
- 1,343 people in local jails and other confinement facilities (including police lockups)
- 1,202 people in nursing homes
- 829 people in federal prisons and detention centers
- 672 people in other group homes
- 653 people in military barracks, etc.
- 304 people in homes or halfway houses for drug/alcohol abuse
- 88 people in homes for the physically handicapped
- 85 people in institutions for the deaf
- 70 people in homes for the mentally retarded
- 70 people in other nonhousehold living situations
- 60 people in mental (psychiatric) hospitals or wards
- 57 people in religious group quarters
- 40 people in halfway houses
- 40 people in homes for the mentally ill
- 37 people in institutions for the blind
- 36 people in orthopedic wards and institutions for the physically handicapped
- 21 people in hospitals/wards and hospices for chronically ill
- 21 people in hospices or homes for chronically ill
- 17 people in unknown juvenile institutions
Banks with most branches in Tucson (2011 data):
- JPMorgan Chase Bank, National Association: 38 branches. Info updated 2011/11/10: Bank assets: $1,811,678.0 mil, Deposits: $1,190,738.0 mil, headquarters in Columbus, OH, positive income, International Specialization, 5577 total offices, Holding Company: Jpmorgan Chase & Co.
- Wells Fargo Bank, National Association: 35 branches. Info updated 2011/04/05: Bank assets: $1,161,490.0 mil, Deposits: $905,653.0 mil, headquarters in Sioux Falls, SD, positive income, 6395 total offices, Holding Company: Wells Fargo & Company
- Bank of America, National Association: 22 branches. Info updated 2009/11/18: Bank assets: $1,451,969.3 mil, Deposits: $1,077,176.8 mil, headquarters in Charlotte, NC, positive income, 5782 total offices, Holding Company: Bank Of America Corporation
- Compass Bank: 15 branches. Info updated 2011/02/24: Bank assets: $63,107.0 mil, Deposits: $46,232.4 mil, headquarters in Birmingham, AL, negative income in the last year, Commercial Lending Specialization, 720 total offices, Holding Company: Banco Bilbao Vizcaya Argentaria, S.A.
- U.S. Bank National Association: 12 branches. Info updated 2012/01/30: Bank assets: $330,470.8 mil, Deposits: $236,091.5 mil, headquarters in Cincinnati, OH, positive income, 3121 total offices, Holding Company: U.S. Bancorp
- Washington Federal: 7 branches. Info updated 2011/12/19: Bank assets: $13,653.0 mil, Deposits: $8,905.8 mil, headquarters in Seattle, WA, positive income, Mortgage Lending Specialization, 174 total offices
- Bank of the West: 7 branches. Info updated 2009/11/16: Bank assets: $62,408.3 mil, Deposits: $43,995.2 mil, headquarters in San Francisco, CA, positive income, 647 total offices, Holding Company: Bnp Paribas
- National Bank of Arizona: National Bank Of Arizona, Riverside Crossing Branch, Stone And Pennington Branch, Prince And Campbell Branch. Info updated 2008/09/11: Bank assets: $4,485.6 mil, Deposits: $3,731.3 mil, local headquarters, positive income, Commercial Lending Specialization, 73 total offices, Holding Company: Zions Bancorporation
- Commerce Bank of Arizona: Commerce Bank Of Arizona, Campbell Branch, Northwest Tucson Branch. Info updated 2010/05/11: Bank assets: $267.3 mil, Deposits: $237.2 mil, local headquarters, negative income in the last year, Commercial Lending Specialization, 7 total offices, Holding Company: Cboa Financial, Inc.
- 8 other banks with 16 local branches
For population 15 years and over in Tucson:
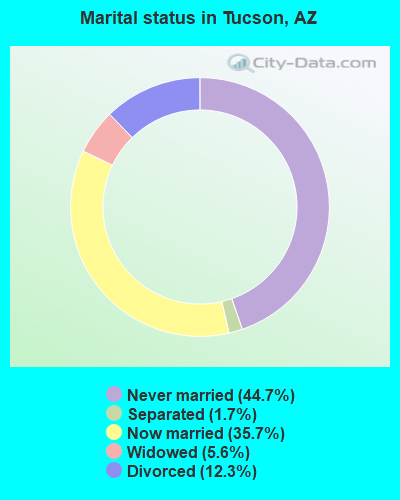
- Never married: 44.7%
- Now married: 35.7%
- Separated: 1.7%
- Widowed: 5.6%
- Divorced: 12.3%
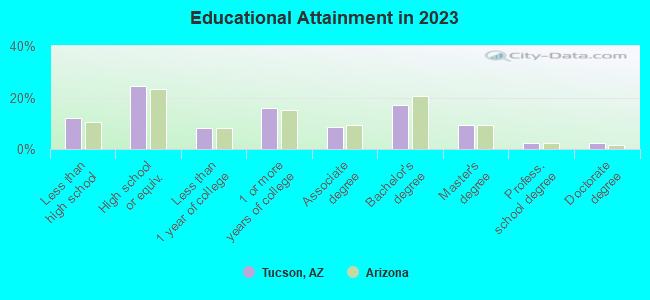
For population 25 years and over in Tucson:
- High school or higher: 88.0%
- Bachelor's degree or higher: 31.7%
- Graduate or professional degree: 13.1%
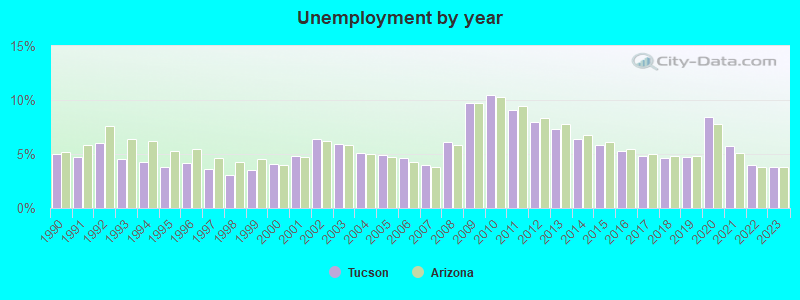
- Unemployed: 5.9%
- Mean travel time to work (commute): 18.9 minutes
| Here: | 12.5 |
| Arizona average: | 12.2 |


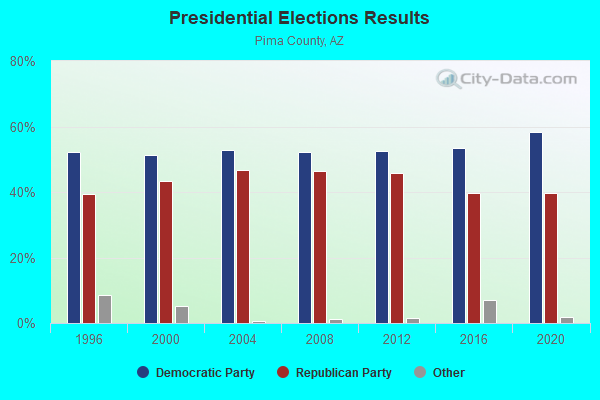
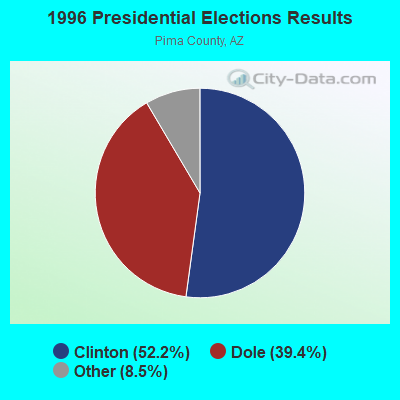
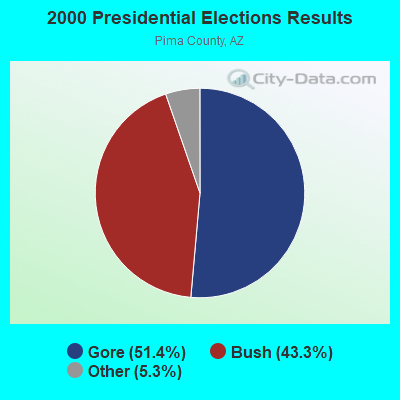
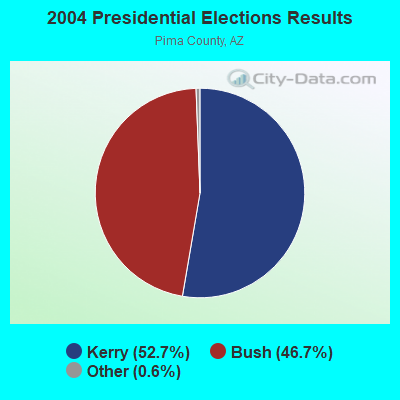
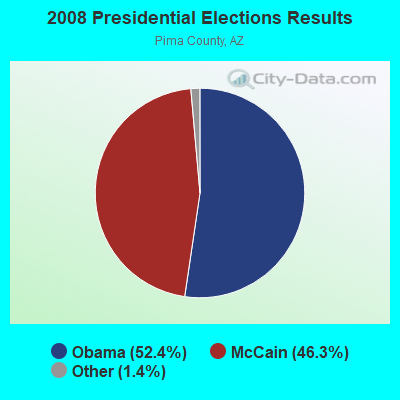

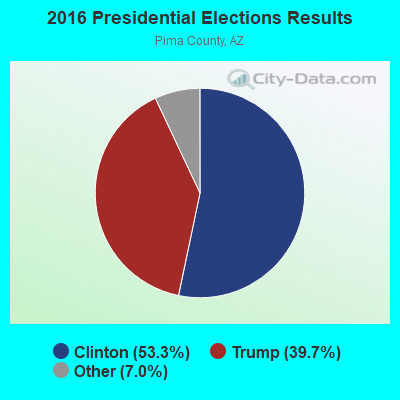
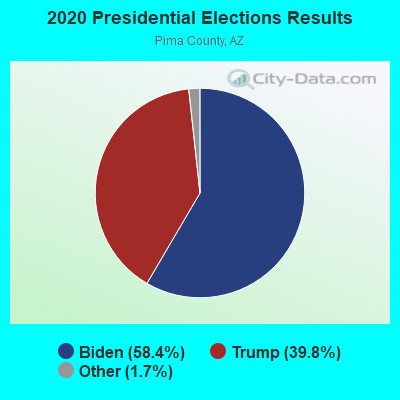
Graphs represent county-level data. Detailed 2008 Election Results
Neighborhoods in Tucson:
(Tucson, Arizona Neighborhood Map)- 12th Avenue - Valencia Road neighborhood
- Armory Park neighborhood
- Avondale neighborhood
- Barrio Viejo neighborhood
- Central neighborhood
- Civano neighborhood
- Congress Street neighborhood
- Convention neighborhood
- Cragin-Keeling neighborhood
- Downtown neighborhood
- Eastside neighborhood
- El Encanto neighborhood
- El Presidio neighborhood
- Fairgrounds neighborhood
- Fourth Avenue (4th Avenue) neighborhood
- Menlo Park neighborhood
- Northwest neighborhood
- Old Fort Lowell neighborhood
- Old Pascua (Adelanto) neighborhood
- Pullman neighborhood
- Sam Hughes neighborhood
- Santa Cruz Southwest neighborhood
- South Tucson neighborhood
- Sunnyside neighborhood
- University of Arizona Campus neighborhood
- Western Hills neighborhood
- Winter-haven neighborhood
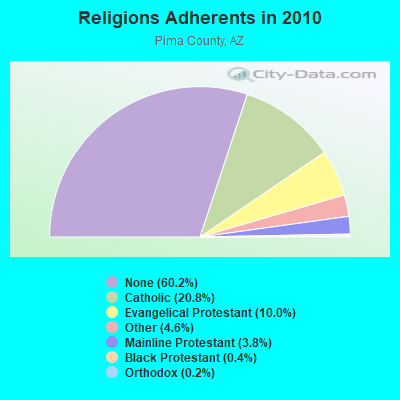
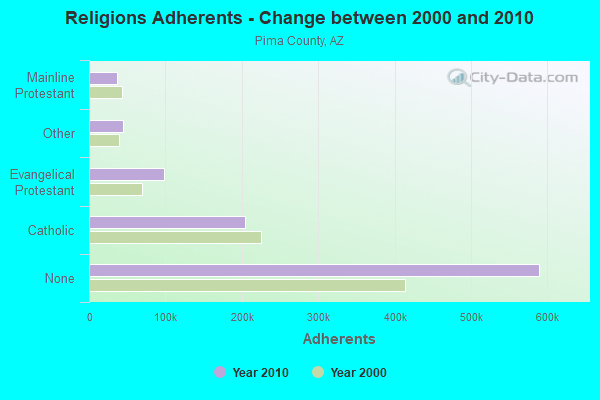
Religion statistics for Tucson, AZ (based on Pima County data)
| Religion | Adherents | Congregations |
|---|---|---|
| Catholic | 203,770 | 50 |
| Evangelical Protestant | 98,278 | 362 |
| Other | 45,011 | 128 |
| Mainline Protestant | 37,037 | 77 |
| Black Protestant | 4,190 | 14 |
| Orthodox | 2,260 | 5 |
| None | 589,717 | - |
Food Environment Statistics:
| Pima County: | 1.22 / 10,000 pop. |
| Arizona: | 1.36 / 10,000 pop. |
| Pima County: | 0.09 / 10,000 pop. |
| State: | 0.14 / 10,000 pop. |
| Pima County: | 0.52 / 10,000 pop. |
| State: | 0.55 / 10,000 pop. |
| This county: | 2.27 / 10,000 pop. |
| Arizona: | 2.47 / 10,000 pop. |
| Pima County: | 6.17 / 10,000 pop. |
| State: | 6.21 / 10,000 pop. |
| Pima County: | 7.8% |
| Arizona: | 8.0% |
| Here: | 21.2% |
| Arizona: | 22.8% |
| Here: | 15.2% |
| Arizona: | 14.2% |
Health and Nutrition:
| This city: | 48.7% |
| State: | 49.0% |
| Here: | 47.8% |
| Arizona: | 47.3% |
| Tucson: | 28.4 |
| Arizona: | 28.5 |
| Here: | 20.6% |
| Arizona: | 20.8% |
| Here: | 10.5% |
| Arizona: | 10.2% |
| Tucson: | 6.8 |
| State: | 6.8 |
| Tucson: | 32.8% |
| Arizona: | 33.5% |
| Tucson: | 56.3% |
| State: | 56.1% |
| Here: | 80.5% |
| State: | 79.4% |
More about Health and Nutrition of Tucson, AZ Residents
| Local government employment and payroll (March 2022) | |||||
| Function | Full-time employees | Monthly full-time payroll | Average yearly full-time wage | Part-time employees | Monthly part-time payroll |
|---|---|---|---|---|---|
| Police Protection - Officers | 1,075 | $6,840,728 | $76,362 | 14 | $22,225 |
| Firefighters | 538 | $4,209,658 | $93,896 | 2 | $6,103 |
| Water Supply | 492 | $2,480,193 | $60,493 | 1 | $1,648 |
| Police - Other | 376 | $1,967,749 | $62,801 | 25 | $54,427 |
| Financial Administration | 357 | $1,873,802 | $62,985 | 2 | $1,245 |
| Streets and Highways | 257 | $1,264,585 | $59,047 | 2 | $1,984 |
| Judicial and Legal | 214 | $1,107,289 | $62,091 | 9 | $12,834 |
| Airports | 213 | $1,340,905 | $75,544 | 14 | $12,314 |
| Parks and Recreation | 203 | $796,837 | $47,104 | 167 | $198,132 |
| Other Government Administration | 200 | $1,107,548 | $66,453 | 5 | $9,940 |
| Solid Waste Management | 185 | $909,367 | $58,986 | 0 | $0 |
| Fire - Other | 137 | $668,834 | $58,584 | 0 | $0 |
| Housing and Community Development (Local) | 123 | $565,223 | $55,144 | 0 | $0 |
| Other and Unallocable | 117 | $641,299 | $65,774 | 0 | $0 |
| Transit | 57 | $331,379 | $69,764 | 1 | $2,326 |
| Totals for Government | 4,544 | $26,105,397 | $68,940 | 242 | $323,178 |
Tucson government finances - Expenditure in 2021 (per resident):
- Construction - Water Utilities: $53,494,000 ($97.87)
Regular Highways: $43,701,000 ($79.95)
Air Transportation: $19,260,000 ($35.24)
Judicial and Legal Services: $1,960,000 ($3.59)
Parking Facilities: $1,526,000 ($2.79)
Parks and Recreation: $1,480,000 ($2.71)
Housing and Community Development: $462,000 ($0.85)
Solid Waste Management: $159,000 ($0.29)
- Current Operations - Police Protection: $241,323,000 ($441.52)
Water Utilities: $151,848,000 ($277.82)
Local Fire Protection: $114,858,000 ($210.14)
Transit Utilities: $83,557,000 ($152.87)
Housing and Community Development: $76,751,000 ($140.42)
Solid Waste Management: $52,274,000 ($95.64)
Parks and Recreation: $43,808,000 ($80.15)
Air Transportation: $40,808,000 ($74.66)
Regular Highways: $38,089,000 ($69.69)
Judicial and Legal Services: $29,312,000 ($53.63)
Financial Administration: $26,013,000 ($47.59)
General - Other: $25,608,000 ($46.85)
Central Staff Services: $25,332,000 ($46.35)
Parking Facilities: $4,543,000 ($8.31)
- General - Interest on Debt: $8,722,000 ($15.96)
- Intergovernmental to Local - Other - Air Transportation: $539,000 ($0.99)
- Intergovernmental to State - Air Transportation: $57,000 ($0.10)
- Other Capital Outlay - Regular Highways: $44,327,000 ($81.10)
Water Utilities: $23,160,000 ($42.37)
Solid Waste Management: $11,679,000 ($21.37)
Police Protection: $1,950,000 ($3.57)
General - Other: $1,607,000 ($2.94)
Judicial and Legal Services: $1,298,000 ($2.37)
Air Transportation: $1,259,000 ($2.30)
Housing and Community Development: $925,000 ($1.69)
General Public Building: $921,000 ($1.69)
Parks and Recreation: $533,000 ($0.98)
Central Staff Services: $89,000 ($0.16)
Parking Facilities: $60,000 ($0.11)
Financial Administration: $53,000 ($0.10)
Local Fire Protection: $50,000 ($0.09)
- Total Salaries and Wages: $212,483,000 ($388.75)
- Water Utilities - Interest on Debt: $19,347,000 ($35.40)
Tucson government finances - Revenue in 2021 (per resident):
- Charges - Solid Waste Management: $58,565,000 ($107.15)
Other: $49,024,000 ($89.69)
Parks and Recreation: $5,647,000 ($10.33)
Parking Facilities: $5,581,000 ($10.21)
Housing and Community Development: $4,451,000 ($8.14)
- Federal Intergovernmental - Housing and Community Development: $50,742,000 ($92.84)
Other: $13,983,000 ($25.58)
Air Transportation: $5,331,000 ($9.75)
- Miscellaneous - Fines and Forfeits: $9,440,000 ($17.27)
Interest Earnings: $2,089,000 ($3.82)
Donations From Private Sources: $1,316,000 ($2.41)
Special Assessments: $215,000 ($0.39)
Royalties: $200,000 ($0.37)
Sale of Property: $106,000 ($0.19)
- Revenue - Water Utilities: $231,731,000 ($423.97)
Transit Utilities: $14,788,000 ($27.06)
- State Intergovernmental - General Local Government Support: $157,406,000 ($287.99)
Highways: $45,982,000 ($84.13)
Other: $27,132,000 ($49.64)
- Tax - General Sales and Gross Receipts: $281,069,000 ($514.24)
Property: $68,358,000 ($125.07)
Public Utilities Sales: $32,054,000 ($58.65)
Other Selective Sales: $25,102,000 ($45.93)
Other License: $14,636,000 ($26.78)
Alcoholic Beverage License: $751,000 ($1.37)
Tucson government finances - Debt in 2021 (per resident):
- Long Term Debt - Beginning Outstanding - Unspecified Public Purpose: $438,561,000 ($802.38)
Outstanding Unspecified Public Purpose: $249,479,000 ($456.44)
Retired Unspecified Public Purpose: $189,082,000 ($345.94)
Tucson government finances - Cash and Securities in 2021 (per resident):
- Bond Funds - Cash and Securities: $3,243,000 ($5.93)
- Other Funds - Cash and Securities: $601,731,000 ($1100.91)
- Sinking Funds - Cash and Securities: $3,346,000 ($6.12)
5.84% of this county's 2021 resident taxpayers lived in other counties in 2020 ($71,876 average adjusted gross income)
| Here: | 5.84% |
| Arizona average: | 6.85% |
0.07% of residents moved from foreign countries ($644 average AGI)
Pima County: 0.07% Arizona average: 0.03%
Top counties from which taxpayers relocated into this county between 2020 and 2021:
| from Maricopa County, AZ | |
| from Pinal County, AZ | |
| from Cochise County, AZ |
5.17% of this county's 2020 resident taxpayers moved to other counties in 2021 ($65,979 average adjusted gross income)
| Here: | 5.17% |
| Arizona average: | 5.72% |
0.06% of residents moved to foreign countries ($677 average AGI)
Pima County: 0.06% Arizona average: 0.03%
Top counties to which taxpayers relocated from this county between 2020 and 2021:
| to Maricopa County, AZ | |
| to Pinal County, AZ | |
| to Cochise County, AZ |
| Businesses in Tucson, AZ | ||||
| Name | Count | Name | Count | |
|---|---|---|---|---|
| 7-Eleven | 17 | Journeys | 2 | |
| 99 Cents Only Stores | 4 | Justice | 1 | |
| ALDO | 2 | KFC | 11 | |
| AT&T | 10 | Kincaid | 4 | |
| Abercrombie & Fitch | 1 | Kmart | 1 | |
| Abercrombie Kids | 1 | Kohl's | 2 | |
| Ace Hardware | 22 | Kroger | 17 | |
| Aeropostale | 3 | LA Fitness | 7 | |
| Albertsons | 7 | La Quinta | 3 | |
| American Eagle Outfitters | 2 | La-Z-Boy | 3 | |
| Ann Taylor | 3 | Lane Bryant | 3 | |
| Apple Store | 1 | Lane Furniture | 7 | |
| Applebee's | 4 | LensCrafters | 3 | |
| Arby's | 10 | Levi Strauss & Co. | 1 | |
| Audi | 1 | Little Caesars Pizza | 12 | |
| AutoZone | 15 | Loews | 1 | |
| Avenue | 1 | Lowe's | 4 | |
| BMW | 1 | Macy's | 2 | |
| Bally Total Fitness | 2 | Marriott | 10 | |
| Banana Republic | 2 | Marshalls | 2 | |
| Barnes & Noble | 2 | MasterBrand Cabinets | 15 | |
| Baskin-Robbins | 10 | Mazda | 2 | |
| Bath & Body Works | 4 | McDonald's | 33 | |
| Bebe | 1 | Men's Wearhouse | 3 | |
| Bed Bath & Beyond | 4 | Motel 6 | 2 | |
| Best Western | 3 | Motherhood Maternity | 5 | |
| Big O Tires | 6 | New Balance | 26 | |
| Blockbuster | 19 | New York & Co | 2 | |
| Brooks Brothers | 2 | Nike | 33 | |
| Brunswick Bowling & Billiards | 1 | Nissan | 2 | |
| Budget Car Rental | 4 | Office Depot | 5 | |
| Buffalo Wild Wings | 2 | OfficeMax | 6 | |
| Burger King | 17 | Old Navy | 3 | |
| Burlington Coat Factory | 1 | Olive Garden | 3 | |
| CVS | 16 | On The Border | 1 | |
| Cache | 2 | Outback | 2 | |
| CarMax | 1 | Outback Steakhouse | 2 | |
| Carl\s Jr. | 11 | Pac Sun | 2 | |
| Casual Male XL | 2 | Panda Express | 14 | |
| Catherines | 1 | Papa John's Pizza | 9 | |
| Charlotte Russe | 2 | Payless | 14 | |
| Chevrolet | 2 | Penske | 7 | |
| Chick-Fil-A | 4 | PetSmart | 5 | |
| Chico's | 2 | Pier 1 Imports | 3 | |
| Chipotle | 7 | Pizza Hut | 15 | |
| Chuck E. Cheese's | 1 | Plato's Closet | 1 | |
| Church's Chicken | 8 | Popeyes | 1 | |
| Cinnabon | 2 | Pottery Barn | 1 | |
| Circle K | 93 | Quality | 3 | |
| Clarion | 2 | Quiznos | 8 | |
| Clarks | 1 | RadioShack | 11 | |
| Cold Stone Creamery | 7 | Ramada | 2 | |
| Coldwater Creek | 2 | Red Lobster | 3 | |
| Comfort Inn | 2 | Red Robin | 1 | |
| Comfort Suites | 3 | Red Roof Inn | 2 | |
| Costco | 2 | Rodeway Inn | 1 | |
| Crate & Barrel | 1 | Ruby Tuesday | 1 | |
| Cricket Wireless | 39 | Rue21 | 1 | |
| Crossland Economy Studios | 1 | Ryder Rental & Truck Leasing | 1 | |
| Curves | 7 | SAS Shoes | 2 | |
| Dairy Queen | 14 | SONIC Drive-In | 10 | |
| Days Inn | 4 | Safeway | 15 | |
| Decora Cabinetry | 1 | Sam's Club | 1 | |
| Dennys | 9 | Sears | 7 | |
| Discount Tire | 9 | Sephora | 2 | |
| Domino's Pizza | 15 | Sheraton | 1 | |
| DressBarn | 2 | Skechers USA | 2 | |
| Dressbarn | 3 | Soma Intimates | 1 | |
| Dunkin Donuts | 4 | Spencer Gifts | 2 | |
| Econo Lodge | 2 | Sprint Nextel | 10 | |
| Eddie Bauer | 2 | Staples | 2 | |
| El Pollo Loco | 1 | Starbucks | 50 | |
| Ethan Allen | 1 | Studio 6 | 1 | |
| Express | 2 | Subaru | 1 | |
| Extended Stay America | 1 | Subway | 47 | |
| Famous Footwear | 5 | Super 8 | 1 | |
| Fashion Bug | 1 | T-Mobile | 27 | |
| FedEx | 98 | T.G.I. Driday's | 1 | |
| Finish Line | 2 | T.J.Maxx | 2 | |
| Firestone Complete Auto Care | 5 | Taco Bell | 16 | |
| Ford | 2 | Talbots | 2 | |
| Forever 21 | 1 | Target | 7 | |
| Fredericks Of Hollywood | 1 | The Cheesecake Factory | 1 | |
| GNC | 8 | The Room Place | 1 | |
| GameStop | 12 | Torrid | 1 | |
| Gap | 2 | Toyota | 2 | |
| Goodwill | 8 | Toys"R"Us | 5 | |
| Gymboree | 3 | Trader Joe's | 3 | |
| H&M | 1 | Travelodge | 2 | |
| H&R Block | 36 | True Value | 3 | |
| Haworth | 1 | U-Haul | 30 | |
| Hilton | 9 | UPS | 87 | |
| Holiday Inn | 6 | Urban Outfitters | 1 | |
| Hollister Co. | 1 | Vans | 13 | |
| Home Depot | 5 | Verizon Wireless | 13 | |
| Honda | 2 | Victoria's Secret | 3 | |
| Hot Topic | 2 | Village Inn | 4 | |
| Howard Johnson | 1 | Volkswagen | 2 | |
| IHOP | 5 | Vons | 16 | |
| InTown Suites | 1 | Waffle House | 5 | |
| J. Jill | 2 | Walgreens | 37 | |
| J.Crew | 1 | Walmart | 9 | |
| JCPenney | 4 | Wendy's | 15 | |
| Jack In The Box | 22 | Westin | 1 | |
| Jamba Juice | 7 | Wet Seal | 2 | |
| JoS. A. Bank | 1 | Whole Foods Market | 2 | |
| Johnny Rockets | 1 | YMCA | 6 | |
| Jones New York | 11 | Z Gallerie | 1 | |
Strongest AM radio stations in Tucson:
- KTKT (990 AM; 10 kW; TUCSON, AZ; Owner: ARIZONA LOTUS CORP.)
- KTZR (1450 AM; 1 kW; TUCSON, AZ; Owner: CLEAR CHANNEL BROADCASTING LICENSES, INC.)
- KNST (790 AM; 5 kW; TUCSON, AZ)
- KFLT (830 AM; 50 kW; TUCSON, AZ; Owner: FAMILY LIFE B/CING SYSTEM, INC.)
- KUAZ (1550 AM; daytime; 50 kW; TUCSON, AZ; Owner: ARIZONA BOARD OF REGENTS)
- KFFN (1490 AM; 1 kW; TUCSON, AZ; Owner: JOURNAL BROADCAST CORPORATION)
- KEVT (1030 AM; 10 kW; CORTARO, AZ; Owner: ONE MART CORP.)
- KJLL (1330 AM; 5 kW; SOUTH TUCSON, AZ; Owner: HUDSON COMMUNICATIONS, INC)
- KQTL (1210 AM; 10 kW; SAHUARITA, AZ; Owner: RADIO UNICA OF TUCSON LICENSE CORP.)
- KXEW (1600 AM; 1 kW; SOUTH TUCSON, AZ; Owner: CAM BROADCASTING COMPANY, INC.)
- KGMS (940 AM; 1 kW; TUCSON, AZ)
- KVOI (690 AM; 0 kW; TUCSON, AZ; Owner: GOOD NEWS BROADCASTING, INC.)
- KCUB (1290 AM; 1 kW; TUCSON, AZ; Owner: CITADEL BROADCASTING COMPANY)
Strongest FM radio stations in Tucson:
- KXCI (91.3 FM; TUCSON, AZ; Owner: FOUNDATION FOR CREATIVE BROADCASTING, INC.)
- KLPX (96.1 FM; TUCSON, AZ; Owner: ARIZONA LOTUS CORPORATION)
- KZLZ-FM2 (105.3 FM; TUCSON, AZ; Owner: ENTRAVISION HOLDINGS, LLC)
- K263AA (100.5 FM; TUCSON, AZ; Owner: EDUCATIONAL MEDIA FOUNDATION)
- K255AC (98.9 FM; TUCSON, AZ; Owner: MARICOPA COUNTY COMMUN. COLLEGE DIST)
- KIIM-FM (99.5 FM; TUCSON, AZ; Owner: CITADEL BROADCASTING COMPANY)
- KOYT (92.9 FM; TUCSON, AZ; Owner: CAPSTAR TX LIMITED PARTNERSHIP)
- KHYT (107.5 FM; TUCSON, AZ; Owner: CITADEL BROADCASTING COMPANY)
- KRQQ (93.7 FM; TUCSON, AZ; Owner: CAPSTAR TX LIMITED PARTNERSHIP)
- KUAT-FM (90.5 FM; TUCSON, AZ; Owner: ARIZONA BOARD OF REGENTS)
- K292CM (106.3 FM; SUMMERHAVEN, AZ; Owner: ARIZONA LOTUS CORPORATION)
- KZLZ-FM1 (105.3 FM; TUCSON, AZ; Owner: ENTRAVISION HOLDINGS, LLC)
- KMXZ-FM (94.9 FM; TUCSON, AZ; Owner: JOURNAL BROADCAST CORPORATION)
- KWFM-FM (97.1 FM; GREEN VALLEY, AZ; Owner: CAPSTAR TX LIMITED PARTNERSHIP)
- KGMG (106.3 FM; ORACLE, AZ; Owner: JOURNAL BROADCAST CORPORATION)
- KCDX (103.1 FM; FLORENCE, AZ; Owner: DESERT WEST AIR RANCHERS CORPORATION)
- K261CK (100.1 FM; SAN XAVIER, AZ; Owner: WORLD RADIO NETWORK, INC.)
- KZPT (104.1 FM; TUCSON, AZ; Owner: JOURNAL BROADCAST CORPORATION)
- KUAZ-FM (89.1 FM; TUCSON, AZ; Owner: ARIZONA BOARD OF REGENTS)
- KXKQ (94.1 FM; SAFFORD, AZ; Owner: MCMURRAY COMMUNICATIONS, INC.)
TV broadcast stations around Tucson:
- KHRR (Channel 40; TUCSON, AZ; Owner: NBC TELEMUNDO PHOENIX, INC.)
- K54FW (Channel 54; TUCSON, AZ; Owner: TRINITY BROADCASTING OF ARIZONA, INC)
- KTTU-TV (Channel 18; TUCSON, AZ; Owner: KTTU-TV, INC.)
- KGUN (Channel 9; TUCSON, AZ; Owner: EMMIS TELEVISION LICENSE CORPORATION)
- K02BW (Channel 2; CASAS ADOBES, AZ; Owner: EMMIS TELEVISION LICENSE CORPORATION)
- K16EO (Channel 16; ORO VALLEY/TUCSON, AZ; Owner: EMMIS TELEVISION LICENSE CORPORATION)
- KUAT-TV (Channel 6; TUCSON, AZ; Owner: ARIZONA BOARD OF REGENTS/UNIV OF AZ.)
- KOLD-TV (Channel 13; TUCSON, AZ; Owner: RAYCOM AMERICA, INC.)
- KXGR (Channel 46; GREEN VALLEY, AZ; Owner: SUNGILT CORPORATION, INC.)
- K21CX (Channel 21; TUCSON, AZ; Owner: VENTANA TELEVISION, INC.)
- K43CW (Channel 43; TUCSON, AZ; Owner: POLAR BROADCASTING OF ARIZONA, INC.)
- KTLL-LP (Channel 65; TUCSON, AZ; Owner: LA LUZ BROADCASTING, INC.)
- KQBN-LP (Channel 14; TUCSON, AZ; Owner: TELEVISION APOGEO DE TUCSON, LLC)
- KUAS-TV (Channel 27; TUCSON, AZ; Owner: ARIZONA BOARD OF REGENTS FOR BENEFIT OF UNIV OF AZ.)
- KTAZ-CA (Channel 25; TUCSON, AZ; Owner: TELEFUTURA PARTNERSHIP OF TUCSON)
- KWTA-LP (Channel 31; TUCSON, AZ; Owner: VENTURE TECHNOLOGIES GROUP, LLC)
- KVOA (Channel 4; TUCSON, AZ; Owner: KVOA COMMUNICATIONS, INC.)
- K48GX (Channel 48; TUCSON, AZ; Owner: KTVW LICENSE PARTNERSHIP, G.P.)
- KUVE-CA (Channel 38; TUCSON, AZ; Owner: KTVW LICENSE PARTNERSHIP, G.P.)
- K64BV (Channel 64; CASAS ADOBES, AZ; Owner: KVOA COMMUNICATIONS, INC.)
Medal of Honor Recipients
Medal of Honor Recipient born in Tucson: Cornelius C. Smith.
- National Bridge Inventory (NBI) Statistics
- 573Number of bridges
- 5,620ft / 1,713mTotal length
- $151,000Total costs
- 12,896,552Total average daily traffic
- 1,465,120Total average daily truck traffic
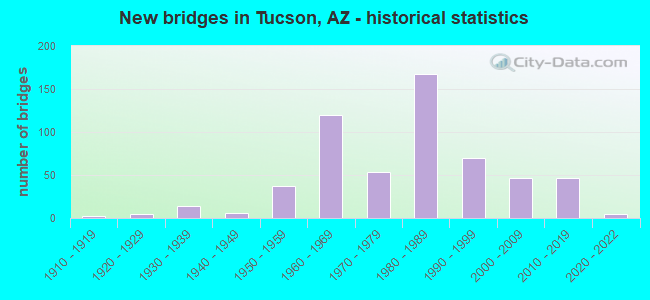
- New bridges - historical statistics
- 21910-1919
- 51920-1929
- 141930-1939
- 61940-1949
- 371950-1959
- 1201960-1969
- 541970-1979
- 1671980-1989
- 701990-1999
- 472000-2009
- 462010-2019
- 52020-2022
FCC Registered Antenna Towers: 1,596 (See the full list of FCC Registered Antenna Towers)
FCC Registered Commercial Land Mobile Towers: 35 (See the full list of FCC Registered Commercial Land Mobile Towers in Tucson, AZ)
FCC Registered Private Land Mobile Towers: 35 (See the full list of FCC Registered Private Land Mobile Towers)
FCC Registered Broadcast Land Mobile Towers: 419 (See the full list of FCC Registered Broadcast Land Mobile Towers)
FCC Registered Microwave Towers: 1,199 (See the full list of FCC Registered Microwave Towers in this town)
FCC Registered Paging Towers: 71 (See the full list of FCC Registered Paging Towers)
FCC Registered Maritime Coast & Aviation Ground Towers: 52 (See the full list of FCC Registered Maritime Coast & Aviation Ground Towers)
FCC Registered Amateur Radio Licenses: 5,913 (See the full list of FCC Registered Amateur Radio Licenses in Tucson)
FAA Registered Aircraft Manufacturers and Dealers: 14 (See the full list of FAA Registered Manufacturers and Dealers in Tucson)
FAA Registered Aircraft: 983 (See the full list of FAA Registered Aircraft)
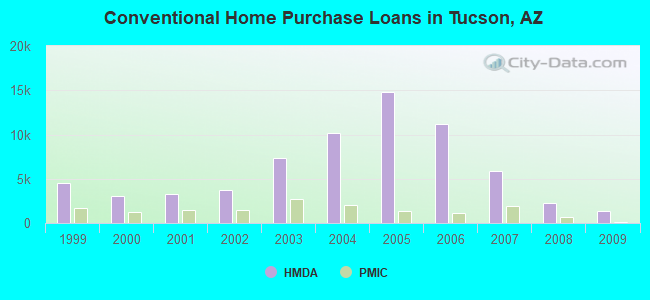
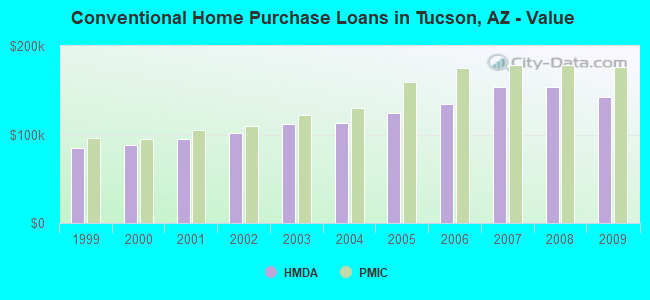
| Home Mortgage Disclosure Act Aggregated Statistics For Year 2009 (Based on 92 full and 20 partial tracts) | ||||||||||||||
| A) FHA, FSA/RHS & VA Home Purchase Loans | B) Conventional Home Purchase Loans | C) Refinancings | D) Home Improvement Loans | E) Loans on Dwellings For 5+ Families | F) Non-occupant Loans on < 5 Family Dwellings (A B C & D) | G) Loans On Manufactured Home Dwelling (A B C & D) | ||||||||
|---|---|---|---|---|---|---|---|---|---|---|---|---|---|---|
| Number | Average Value | Number | Average Value | Number | Average Value | Number | Average Value | Number | Average Value | Number | Average Value | Number | Average Value | |
| LOANS ORIGINATED | 2,185 | $145,056 | 1,411 | $142,062 | 6,600 | $159,648 | 242 | $81,577 | 19 | $1,470,756 | 942 | $130,264 | 111 | $66,715 |
| APPLICATIONS APPROVED, NOT ACCEPTED | 94 | $144,587 | 120 | $132,009 | 664 | $160,230 | 36 | $92,050 | 1 | $404,550 | 99 | $137,133 | 41 | $59,186 |
| APPLICATIONS DENIED | 333 | $126,600 | 386 | $108,875 | 2,753 | $152,533 | 323 | $50,977 | 10 | $623,745 | 423 | $124,560 | 155 | $49,135 |
| APPLICATIONS WITHDRAWN | 210 | $141,058 | 188 | $132,330 | 1,772 | $156,353 | 79 | $86,609 | 2 | $3,267,625 | 213 | $136,715 | 27 | $72,423 |
| FILES CLOSED FOR INCOMPLETENESS | 71 | $140,475 | 33 | $161,154 | 405 | $160,959 | 33 | $104,698 | 2 | $417,500 | 54 | $190,692 | 4 | $92,002 |
Detailed mortgage data for all 112 tracts in Tucson, AZ
| Private Mortgage Insurance Companies Aggregated Statistics For Year 2009 (Based on 74 full and 19 partial tracts) | ||||||
| A) Conventional Home Purchase Loans | B) Refinancings | C) Non-occupant Loans on < 5 Family Dwellings (A & B) | ||||
|---|---|---|---|---|---|---|
| Number | Average Value | Number | Average Value | Number | Average Value | |
| LOANS ORIGINATED | 164 | $176,298 | 106 | $198,855 | 8 | $150,642 |
| APPLICATIONS APPROVED, NOT ACCEPTED | 53 | $182,832 | 44 | $165,395 | 13 | $146,808 |
| APPLICATIONS DENIED | 26 | $167,570 | 25 | $201,296 | 2 | $169,935 |
| APPLICATIONS WITHDRAWN | 6 | $143,043 | 5 | $234,554 | 1 | $97,960 |
| FILES CLOSED FOR INCOMPLETENESS | 11 | $170,577 | 5 | $176,760 | 2 | $203,615 |
2002 - 2018 National Fire Incident Reporting System (NFIRS) incidents
- Fire incident types reported to NFIRS in Tucson, AZ
- 8,34750.2%Outside Fires
- 4,80828.9%Structure Fires
- 2,29813.8%Mobile Property/Vehicle Fires
- 1,1687.0%Other
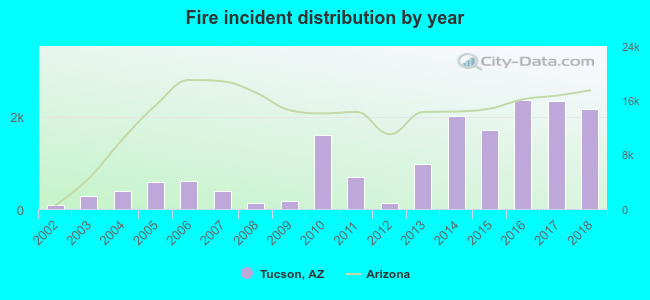 Based on the data from the years 2002 - 2018 the average number of fire incidents per year is 978. The highest number of fire incidents - 2,355 took place in 2016, and the least - 93 in 2002. The data has an increasing trend.
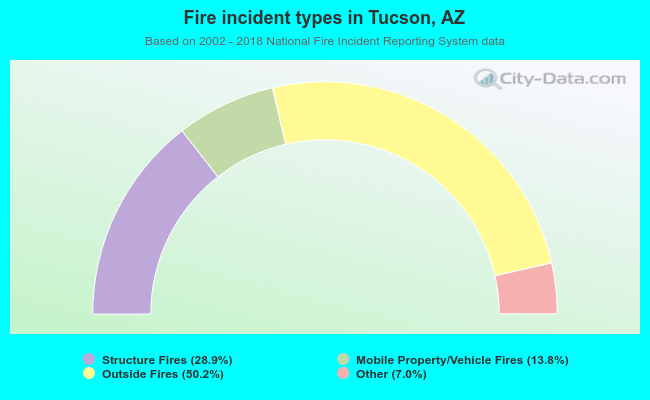 When looking into fire subcategories, the most reports belonged to: Outside Fires (50.2%), and Structure Fires (28.9%).
Fire-safe hotels and motels in Tucson, Arizona:
- Clarion Inn Downtown Tucson, 750 W Starr Pass Blvd, Tucson, Arizona 85713 , Phone: (520) 624-4455, Fax: (520) 624-3172
- Paloverde Inn & Suites, 5251 S Julian Dr, Tucson, Arizona 85706 , Phone: (520) 294-5250, Fax: (520) 889-1982
- Hilton Tucson El Conquistador Golf & Tennis Resort, 10000 N Oracle Rd, Tucson, Arizona 85737 , Phone: (520) 544-5000, Fax: (520) 544-1226
- Aloft Tucson University, 1900 E Speedway Blvd, Tucson, Arizona 85719 , Phone: (520) 908-6800, Fax: (520) 908-6805
- La Quinta Motor Inn #703,tucson, 655 N Fwy, Tucson, Arizona 85745 , Phone: (520) 622-6491
- Ramada Tucson Foothills, 6944 E Tanque Verde Rd, Tucson, Arizona 85715 , Phone: (520) 886-9595, Fax: (520) 721-8466
- Doubletree Hotel At Reid Park, 445 S Alvernon, Tucson, Arizona 85711 , Phone: (520) 881-4200, Fax: (520) 323-5223
- Quality Inn Tucson Airport, 2803 E Valencia Rd, Tucson, Arizona 85706 , Phone: (520) 294-2500, Fax: (520) 741-0851
- 82 other hotels and motels
| Most common first names in Tucson, AZ among deceased individuals | ||
| Name | Count | Lived (average) |
|---|---|---|
| John | 4,024 | 74.0 years |
| William | 3,441 | 74.2 years |
| Mary | 3,393 | 79.0 years |
| Robert | 3,223 | 71.5 years |
| James | 2,793 | 71.6 years |
| Charles | 2,092 | 74.9 years |
| George | 1,892 | 75.9 years |
| Helen | 1,713 | 80.6 years |
| Joseph | 1,713 | 75.1 years |
| Margaret | 1,510 | 79.7 years |
| Most common last names in Tucson, AZ among deceased individuals | ||
| Last name | Count | Lived (average) |
|---|---|---|
| Smith | 1,370 | 75.6 years |
| Johnson | 915 | 75.1 years |
| Brown | 726 | 75.0 years |
| Miller | 704 | 75.3 years |
| Williams | 596 | 74.9 years |
| Davis | 593 | 75.5 years |
| Jones | 586 | 75.5 years |
| Anderson | 571 | 75.5 years |
| Wilson | 512 | 76.4 years |
| Lopez | 435 | 71.4 years |
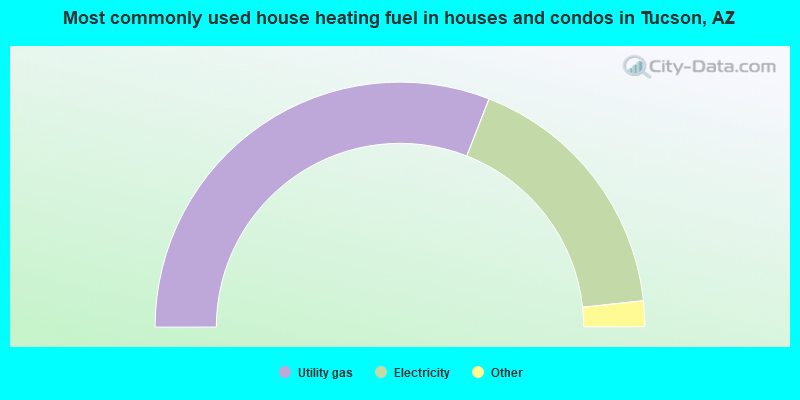
- 61.8%Utility gas
- 34.7%Electricity
- 1.4%Bottled, tank, or LP gas
- 1.2%Solar energy
- 0.5%No fuel used
- 0.2%Fuel oil, kerosene, etc.
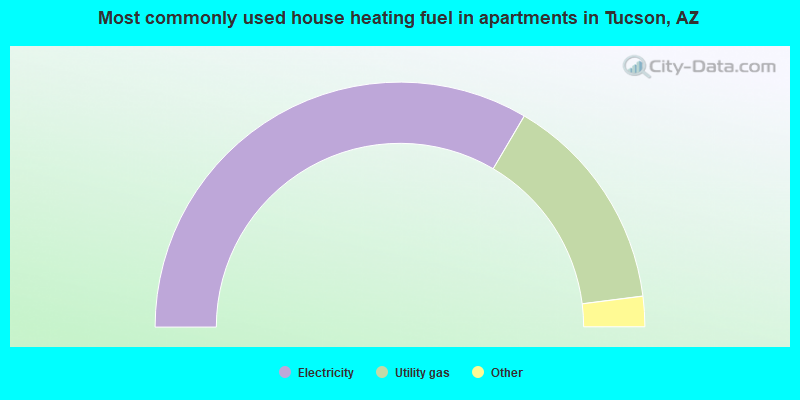
- 66.9%Electricity
- 29.0%Utility gas
- 2.3%Bottled, tank, or LP gas
- 1.5%No fuel used
- 0.2%Solar energy
Tucson compared to Arizona state average:
- Median house value below state average.
- Unemployed percentage below state average.
- House age above state average.
- Number of college students above state average.
Tucson, AZ compared to other similar cities:
Tucson on our top lists:
- #2 on the list of "Top 101 cities with the lowest average wind speeds (population 50,000+)"
- #28 on the list of "Top 101 cities with the highest average sunshine amount (population 50,000+)"
- #28 on the list of "Top 101 cities with the lowest maximum monthly morning or afternoon humidity (population 50,000+)"
- #29 on the list of "Top 101 cities with the lowest minimum monthly morning or afternoon humidity (population 50,000+)"
- #30 on the list of "Top 101 cities with the lowest average humidity (population 50,000+)"
- #31 on the list of "Top 101 cities with the hottest summers (population 50,000+)"
- #32 on the list of "Top 101 cities with the largest percentage of people in institutions for the deaf (population 1,000+)"
- #34 on the list of "Top 101 cities with the highest daily high temperatures (population 50,000+)"
- #37 on the list of "Top 101 cities with the highest number of days clear of clouds (population 50,000+)"
- #37 on the list of "Top 101 cities with the lowest number of days clear of clouds (population 50,000+)"
- #38 on the list of "Top 101 biggest cities in 2013"
- #38 on the list of "Top 100 biggest cities"
- #43 on the list of "Top 101 cities with the largest percentage of people in institutions for the blind (population 1,000+)"
- #47 on the list of "Top 101 cities with the highest city-data.com crime index, excludes tourist destinations and others with a lot of outsiders visiting based on city industries data (population 50,000+)"
- #55 on the list of "Top 101 cities with the largest city-data.com crime index per police officer (population 50,000+)"
- #56 on the list of "Top 100 cities with largest land areas (pop. 50,000+)"
- #68 on the list of "Top 101 cities with the most mentions on city-data.com forum"
- #74 on the list of "Top 100 highest located cities (pop. 50,000+)"
- #79 on the list of "Top 100 cities with strongest arts, entertainment, recreation, accommodation and food services industries (pop. 50,000+)"
- #81 on the list of "Top 101 cities with the highest number of thefts per 100,000 residents, excludes tourist destinations and others with a lot of outsiders visiting based on city industries data (population 50,000+)"
- #14 (85708) on the list of "Top 101 zip codes with the lowest 2012 average taxable interest for individuals (pop 5,000+)"
- #16 (85708) on the list of "Top 101 zip codes with the smallest percentage of taxpayers using paid preparers for 2012 taxes (pop 5,000+)"
- #30 (85708) on the list of "Top 101 zip codes with the smallest percentage of taxpayers reporting profit/loss from business in 2012 (pop 5,000+)"
- #51 (85708) on the list of "Top 101 zip codes with the largest percentage of returns reporting salary or wage in 2012 (pop 5,000+)"
- #83 (85706) on the list of "Top 101 zip codes with the smallest percentage of taxpayers reporting net capital gain/loss in 2012 (pop 5,000+)"
- #96 (85701) on the list of "Top 101 zip codes with the most offices of lawyers in 2005"
- #97 (85711) on the list of "Top 101 zip codes with the most Internet business establishments in 2005"
- #100 (85706) on the list of "Top 101 zip codes with the smallest percentage of taxpayers reporting taxable interest in 2012 (pop 5,000+)"
- #101 (85701) on the list of "Top 101 zip codes with the most museums in 2005"
- #11 on the list of "Top 101 counties with the highest Particulate Matter (PM10) Annual air pollution readings in 2012 (µg/m3)"
- #14 on the list of "Top 101 counties with the highest ground withdrawal of fresh water for public supply"
- #29 on the list of "Top 101 counties with the highest carbon monoxide air pollution readings in 2012 (ppm)"
- #35 on the list of "Top 101 counties with the most Other congregations"
- #45 on the list of "Top 101 counties with the highest total withdrawal of fresh water for public supply (pop. 50,000+)"
State forum archive:
- Arizona Pages: 2 3 4 5 6 7 8 9 10 11 12 13 14 15 16 17 18 19 20 21 22 23 24 25 26 27 28 29 30 31 32 33
- Flagstaff-Sedona Pages: 2 3 4 5 6
- Phoenix area Pages: 2 3 4 5 6 7 8 9 10 11 12 13 14 15 16 17 18 19 20 21 22 23 24 25 26 27 28 29 30 31 32 33 34 35 36 37 38 39 40 41 42 43 44 45 46 47 48 49 50 51 52 53 54 55 56 57 58 59 60 61 62 63 64 65 66 67 68 69 70 71 72 73 74 75 76 77 78 79 80 81 82 83 84 85 86 87 88 89 90 91 92 93 94 95 96 97 98 99 100 101 102 103 104 105 106 107 108 109 110 111 112 113 114 115 116 117 118 119
- Prescott Pages: 2 3 4 5 6 7 8 9 10
- Tucson Pages: 2 3 4 5 6 7 8 9 10 11 12 13 14 15 16 17 18 19 20 21 22 23 24

|
|
Total of 7072 patent applications in 2008-2024.