Estimated zip code population in 2022: 5,340 Zip code population in 2010: 4,983 Zip code population in 2000: 4,474
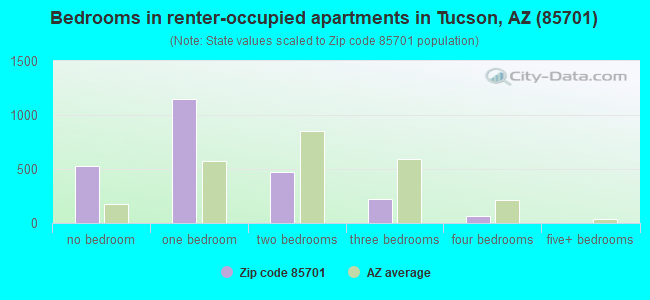
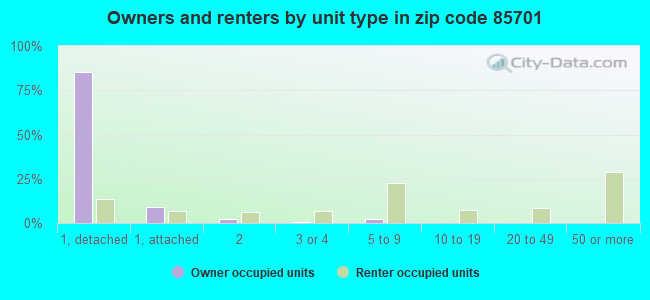
Houses and condos: 3,722 Renter-occupied apartments: 2,413
% of renters here:
78%
State:
33%
March 2022 cost of living index in zip code 85701: 95.7 (near average, U.S. average is 100)
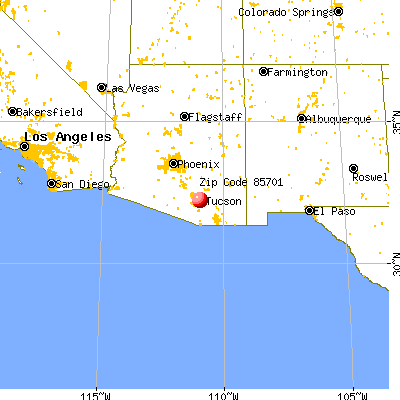
Land area: 1.4 sq. mi. Water area: 0.0 sq. mi.
Population density: 3,691 people per square mile
(average).
OSM Map
General Map
Google Map
MSN Map
OSM Map
General Map
Google Map
MSN Map
OSM Map
General Map
Google Map
MSN Map
OSM Map
General Map
Google Map
MSN Map
Please wait while loading the map...
Real estate property taxes paid for housing units in 2022:
This zip code:
0.4% ($2,172)
Arizona:
0.4% ($1,786)
Median real estate property taxes paid for housing units with mortgages in 2022: $2,484 (0.5%) Median real estate property taxes paid for housing units with no mortgage in 2022: $1,571 (0.3%)
Averages for the 2020 tax year for zip code 85701, filed in 2021:
Average Adjusted Gross Income (AGI) in 2020: $58,190 (Individual Income Tax Returns)
Here:
$58,190
State:
$73,499
Salary/wage: $50,223 (reported on 79.1% of returns)
Here:
$50,223
State:
$59,499
(% of AGI for various income ranges: 1175.5% for AGIs below $25k, 3717.2% for AGIs $25k-50k, 7102.4% for AGIs $50k-75k, 9811.5% for AGIs $75k-100k, 21299.2% for AGIs $100k-200k, 75473.3% for AGIs over 200k)
Taxable interest for individuals: $1,360 (reported on 26.7% of returns)
This zip code:
$1,360
Arizona:
$2,325
(% of AGI for various income ranges: 11.0% for AGIs below $25k, 5.8% for AGIs $25k-50k, 58.0% for AGIs $50k-75k, 65.4% for AGIs $75k-100k, 318.3% for AGIs $100k-200k, 893.3% for AGIs over 200k)
Ordinary dividends: $6,675 (reported on 20.9% of returns)
Here:
$6,675
State:
$8,711
(% of AGI for various income ranges: 32.1% for AGIs below $25k, 50.7% for AGIs $25k-50k, 172.8% for AGIs $50k-75k, 369.2% for AGIs $75k-100k, 912.5% for AGIs $100k-200k, 4250.0% for AGIs over 200k)
Net capital gain/loss in AGI: +$13,613 (reported on 19.8% of returns)
Here:
+$13,613
State:
+$31,332
(% of AGI for various income ranges: 28.1% for AGIs below $25k, 32.8% for AGIs $25k-50k, 202.8% for AGIs $50k-75k, 534.6% for AGIs $75k-100k, 1365.8% for AGIs $100k-200k, 13726.7% for AGIs over 200k)
Profit/loss from business: +$12,111 (reported on 16.8% of returns)
Here:
+$12,111
State:
+$13,214
(% of AGI for various income ranges: 137.4% for AGIs below $25k, 238.8% for AGIs $25k-50k, 262.8% for AGIs $50k-75k, 342.3% for AGIs $75k-100k, 504.2% for AGIs $100k-200k, 5000.0% for AGIs over 200k)
Taxable individual retirement arrangement distribution: $19,581 (reported on 5.9% of returns)
85701:
$19,581
Arizona:
$23,364
(% of AGI for various income ranges: 22.6% for AGIs below $25k, 69.3% for AGIs $25k-50k, 138.4% for AGIs $50k-75k, 711.5% for AGIs $75k-100k, 1085.0% for AGIs $100k-200k)
Total itemized deductions: $32,289 (reported on 6.6% of returns)
Here:
$32,289
State:
$36,308
(% of AGI for various income ranges: 127.0% for AGIs $25k-50k, 413.6% for AGIs $50k-75k, 675.4% for AGIs $75k-100k, 1149.2% for AGIs $100k-200k, 5990.0% for AGIs over 200k)
Charity contributions: $7,443 (reported on 5.1% of returns)
Here:
$7,443
State:
$11,955
(% of AGI for various income ranges: 21.4% for AGIs $25k-50k, 77.7% for AGIs $75k-100k, 278.3% for AGIs $100k-200k, 1616.7% for AGIs over 200k)
Taxes paid: $6,339 (reported on 6.6% of returns)
85701:
$6,339
State:
$6,820
(% of AGI for various income ranges: 14.7% for AGIs $25k-50k, 41.6% for AGIs $50k-75k, 122.3% for AGIs $75k-100k, 310.8% for AGIs $100k-200k, 1403.3% for AGIs over 200k)
Earned income credit: $1,915 (reported on 17.2% of returns)
Here:
$1,915
State:
$2,383
(% of AGI for various income ranges: 83.2% for AGIs below $25k, 51.4% for AGIs $25k-50k)
Percentage of individuals using paid preparers for their 2020 taxes: 93.8%
Here:
94%
State:
93%
(% for various income ranges: 93.1% for AGIs below $25k, 95.9% for AGIs $25k-50k, 94.6% for AGIs $50k-75k, 90.9% for AGIs $75k-100k, 92.6% for AGIs $100k-200k, 91.7% for AGIs over 200k)
Averages for the 2012 tax year for zip code 85701, filed in 2013:
Average Adjusted Gross Income (AGI) in 2012: $39,669 (Individual Income Tax Returns)
Here:
$39,669
State:
$57,644
Salary/wage: $34,912 (reported on 80.6% of returns)
Here:
$34,912
State:
$47,932
(% of AGI for various income ranges: 79.0% for AGIs below $25k, 81.7% for AGIs $25k-50k, 71.6% for AGIs $50k-75k, 66.3% for AGIs $75k-100k, 65.1% for AGIs $100k-200k, 54.1% for AGIs over 200k)
Taxable interest for individuals: $1,698 (reported on 25.4% of returns)
This zip code:
$1,698
Arizona:
$2,064
(% of AGI for various income ranges: 1.1% for AGIs below $25k, 0.8% for AGIs $25k-50k, 1.3% for AGIs $50k-75k, 1.0% for AGIs $75k-100k, 1.3% for AGIs $100k-200k, 1.1% for AGIs over 200k)
Ordinary dividends: $5,918 (reported on 17.7% of returns)
Here:
$5,918
State:
$7,268
(% of AGI for various income ranges: 2.6% for AGIs below $25k, 2.3% for AGIs $25k-50k, 3.7% for AGIs $50k-75k, 4.3% for AGIs $75k-100k, 1.9% for AGIs $100k-200k, 1.7% for AGIs over 200k)
Net capital gain/loss in AGI: +$2,347 (reported on 15.3% of returns)
Here:
+$2,347
State:
+$15,530
(% of AGI for various income ranges: 0.3% for AGIs below $25k, 0.8% for AGIs $25k-50k, 1.9% for AGIs $50k-75k, 0.2% for AGIs $75k-100k, 0.9% for AGIs $100k-200k, 0.9% for AGIs over 200k)
Profit/loss from business: +$10,902 (reported on 17.7% of returns)
Here:
+$10,902
State:
+$12,323
(% of AGI for various income ranges: 8.0% for AGIs below $25k, 4.0% for AGIs $25k-50k, 4.3% for AGIs $50k-75k, 5.5% for AGIs $75k-100k, 6.9% for AGIs $100k-200k)
Taxable individual retirement arrangement distribution: $13,746 (reported on 5.2% of returns)
85701:
$13,746
Arizona:
$18,280
(% of AGI for various income ranges: 1.3% for AGIs below $25k, 1.1% for AGIs $25k-50k, 3.0% for AGIs $50k-75k, 4.3% for AGIs $100k-200k)
Total itemized deductions: $22,267 (27% of AGI, reported on 22.2% of returns)
Here:
$22,267
State:
$23,651
Here:
26.6% of AGI
State:
20.6% of AGI
(% of AGI for various income ranges: 15.1% for AGIs below $25k, 9.3% for AGIs $25k-50k, 12.6% for AGIs $50k-75k, 16.1% for AGIs $75k-100k, 12.9% for AGIs $100k-200k, 11.2% for AGIs over 200k)
Charity contributions: $2,995 (reported on 14.9% of returns)
Here:
$2,995
State:
$4,114
(% of AGI for various income ranges: 0.5% for AGIs below $25k, 0.5% for AGIs $25k-50k, 0.9% for AGIs $50k-75k, 1.8% for AGIs $75k-100k, 1.6% for AGIs $100k-200k, 2.0% for AGIs over 200k)
Taxes paid: $5,269 (reported on 21.8% of returns)
85701:
$5,269
State:
$6,509
(% of AGI for various income ranges: 1.3% for AGIs below $25k, 1.4% for AGIs $25k-50k, 2.4% for AGIs $50k-75k, 3.8% for AGIs $75k-100k, 4.0% for AGIs $100k-200k, 5.7% for AGIs over 200k)
Earned income credit: $1,929 (reported on 25.4% of returns)
Here:
$1,929
State:
$2,432
(% of AGI for various income ranges: 6.9% for AGIs below $25k, 0.7% for AGIs $25k-50k)
Percentage of individuals using paid preparers for their 2012 taxes: 41.5%
Here:
42%
State:
52%
(% for various income ranges: 36.8% for AGIs below $25k, 36.9% for AGIs $25k-50k, 46.4% for AGIs $50k-75k, 66.7% for AGIs $75k-100k, 64.3% for AGIs $100k-200k, 75.0% for AGIs over 200k)
Averages for the 2004 tax year for zip code 85701, filed in 2005:
Average Adjusted Gross Income (AGI) in 2004: $34,100 (Individual Income Tax Returns)
Here:
$34,100
State:
$50,097
Salary/wage: $27,179 (reported on 81.3% of returns)
Here:
$27,179
State:
$42,146
(% of AGI for various income ranges: 139.6% for AGIs below $10k, 80.5% for AGIs $10k-25k, 83.7% for AGIs $25k-50k, 77.5% for AGIs $50k-75k, 52.2% for AGIs $75k-100k, 37.2% for AGIs over 100k)
Taxable interest for individuals: $3,006 (reported on 34.0% of returns)
This zip code:
$3,006
Arizona:
$2,374
(% of AGI for various income ranges: 7.0% for AGIs below $10k, 1.9% for AGIs $10k-25k, 2.0% for AGIs $25k-50k, 1.3% for AGIs $50k-75k, 3.5% for AGIs $75k-100k, 4.5% for AGIs over 100k)
Taxable dividends: $4,328 (reported on 19.0% of returns)
Here:
$4,328
State:
$3,888
(% of AGI for various income ranges: 8.6% for AGIs below $10k, 1.4% for AGIs $10k-25k, 1.2% for AGIs $25k-50k, 1.1% for AGIs $50k-75k, 5.4% for AGIs $75k-100k, 3.1% for AGIs over 100k)
Net capital gain/loss: +$15,909 (reported on 16.6% of returns)
Here:
+$15,909
State:
+$17,569
(% of AGI for various income ranges: -3.1% for AGIs below $10k, 0.7% for AGIs $10k-25k, 1.2% for AGIs $25k-50k, -0.0% for AGIs $50k-75k, 7.4% for AGIs $75k-100k, 19.3% for AGIs over 100k)
Profit/loss from business: +$14,572 (reported on 14.6% of returns)
Here:
+$14,572
State:
+$11,088
(% of AGI for various income ranges: 7.3% for AGIs below $10k, 5.3% for AGIs $10k-25k, 2.8% for AGIs $25k-50k, 6.3% for AGIs $50k-75k, 9.6% for AGIs $75k-100k, 8.3% for AGIs over 100k)
IRA payment deduction: $2,293 (reported on 1.9% of returns)
85701:
$2,293
Arizona:
$3,023
Self-employed pension: $13,500 (reported on 0.8% of returns)
Here:
$13,500
Arizona:
$15,785
Total itemized deductions: $23,484 (29% of AGI, reported on 23.1% of returns)
Here:
$23,484
State:
$19,781
Here:
28.5% of AGI
State:
21.8% of AGI
(% of AGI for various income ranges: 39.2% for AGIs below $10k, 13.7% for AGIs $10k-25k, 10.2% for AGIs $25k-50k, 15.2% for AGIs $50k-75k, 24.3% for AGIs $75k-100k, 17.5% for AGIs over 100k)
Charity contributions deductions: $2,686 (3% of AGI, reported on 16.6% of returns)
Here:
$2,686
State:
$3,389
Here:
2.7% of AGI
State:
3.5% of AGI
(% of AGI for various income ranges: 0.5% for AGIs $10k-25k, 0.9% for AGIs $25k-50k, 1.5% for AGIs $50k-75k, 1.5% for AGIs $75k-100k, 2.0% for AGIs over 100k)
Total tax: $6,670 (reported on 64.9% of returns)
85701:
$6,670
State:
$8,323
(% of AGI for various income ranges: 7.5% for AGIs below $10k, 4.5% for AGIs $10k-25k, 8.1% for AGIs $25k-50k, 11.8% for AGIs $50k-75k, 13.3% for AGIs $75k-100k, 20.2% for AGIs over 100k)
Earned income credit: $1,483 (reported on 26.3% of returns)
Here:
$1,483
State:
$1,786
Percentage of individuals using paid preparers for their 2004 taxes: 53.0%
Here:
53%
State:
60%
(% for various income ranges: 49.8% for AGIs below $10k, 50.8% for AGIs $10k-25k, 50.8% for AGIs $25k-50k, 59.0% for AGIs $50k-75k, 75.0% for AGIs $75k-100k, 72.2% for AGIs over 100k)
Likely homosexual households (counted as self-reported same-sex unmarried-partner households)
Lesbian couples: 0.2% of all households
Gay men: 1.0% of all households
Household received Food Stamps/SNAP in the past 12 months: 541 Household did not receive Food Stamps/SNAP in the past 12 months: 2,643
Women who had a birth in the past 12 months: 18 (9 now married, 8 unmarried) Women who did not have a birth in the past 12 months: 1,370 (322 now married, 1,056 unmarried)
Housing units in zip code 85701 with a mortgage: 380 (14 second mortgage, 15 both second mortgage and home equity loan) Median monthly owner costs for units with a mortgage: $1,575 Median monthly owner costs for units without a mortgage: $473
Residents with income below the poverty level in 2022:
This zip code:
24.4%
Whole state:
12.5%
Residents with income below 50% of the poverty level in 2022:
This zip code:
12.3%
Whole state:
6.0%
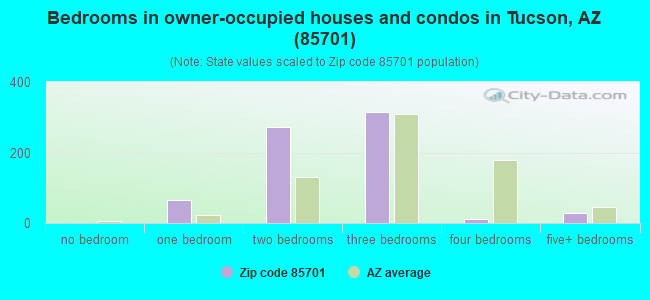
Median number of rooms in houses and condos:
Here:
5.4
State:
6.0
Median number of rooms in apartments:
Here:
2.9
State:
4.1
Notable locations in this zip code not listed on our city pages
Notable locations in zip code 85701: Cushing Business Center (A), James A Walsh United States Courthouse (B), Tucson City Hall (C), Tucson Museum of Art (D), Tucson Children's Museum (E), Pima County Public Library Santa Rosa Branch (F), Pima County Public Library Joel D Valdez Main Library (G), Tucson Police Department (H), Tucson Fire Station 1 (I). Display/hide their locations on the map
Churches in zip code 85701 include: Saint Augustine Cathedral (A), Saint Andrew's Episcopal Church (B), Wishing Shrine (C), Prince Chapel African Methodist Episcopal Church (D), First Mexican Baptist Church (E), Tucson Spanish Seventh Day Adventist Church (F). Display/hide their locations on the map
Parks in zip code 85701 include: Santa Rita Park (1), Tucson Community Center (2), Sunset Park (3), Santa Rosa Park (4), San Augustine Plaza (5), Military Plaza Park (6), De Anza Park (7), El Presidio Park (8), Echo Park (9). Display/hide their locations on the map
Tourist attractions (not listed on the city page) : Center for Creative Photography - Information (Museums; Speedway & Olive), Hazmat Gallery (Museums; 197 East Toole Avenue), Arizona State Museum (1013 East Univ Boulevard), Flandrau Science Center & Planetarium (Museums; 1601 East Univ Boulevard), Museum of Contemporary Art (197 East Toole Avenue), Southern Arizona Transportation Museum (Cultural Attractions- Events- & Facilities; 414 North Toole Avenue), Tucson's Childrens Museum (Cultural Attractions- Events- & Facilities; 200 South 6th Avenue), City Clerk (Recreation Areas; 255 West Alameda Street), Tucson Metropolitan Chamber of Commerce (465 West Saint Marys Road).
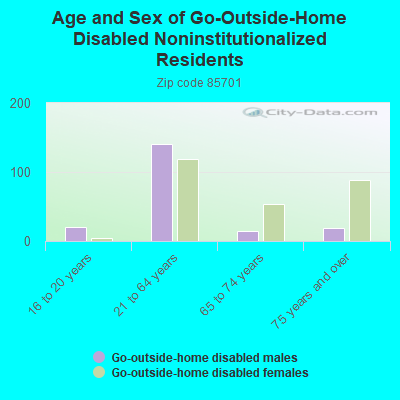
In group quarters: 98 (-1 institutionalized population)
Size of family households: 504 2-persons, 143 3-persons, 92 4-persons, 48 5-persons, 7 6-persons, 29 7-or-more-persons
Size of nonfamily households: 1,903 1-person, 379 2-persons, 86 3-persons
239 married couples with children.
259 single-parent households (90 men, 169 women).
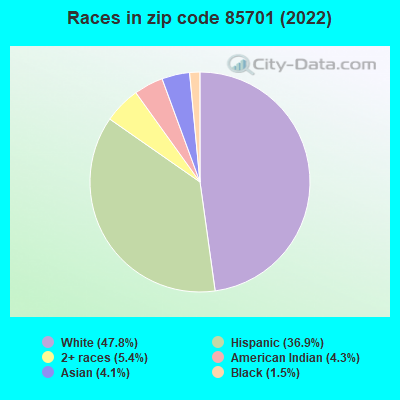
72.4% of residents of 85701 zip code speak English at home.
21.1% of residents speak Spanish at home (84% very well, 3% well, 4% not well, 9% not at all).
1.3% of residents speak other Indo-European language at home (100% very well).
2.9% of residents speak Asian or Pacific Island language at home (92% very well, 8% well).
2.5% of residents speak other language at home (78% very well, 11% well, 7% not well, 4% not at all).
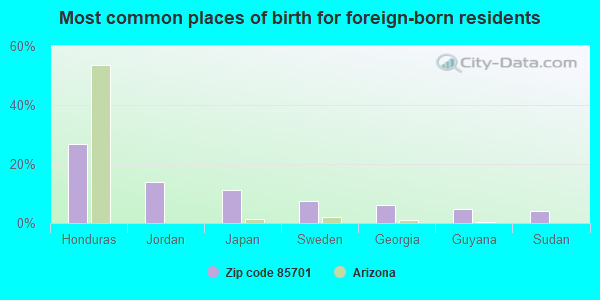
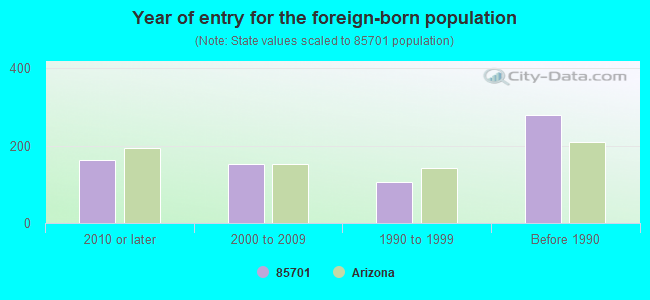
Foreign born population: 633 (11.9%) (67.9% of them are naturalized citizens)
Major facilities with environmental interests located in this zip code:
DOWNTOWN ALTERNATIVE HIGH SCHOOL (118 S 5TH AVENUE in TUCSON, AZ)
(National Center for Education Statistics) - STATE ID-677 Organizations: TUCSON UNIFIED DISTRICT (SCHOOL DISTRICT)
DRACHMAN PRIMARY MAGNET SCHOOL (1085 S 10TH AVE in TUCSON, AZ)
(National Center for Education Statistics) - STATE ID-203 Organizations: TUCSON UNIFIED DISTRICT (SCHOOL DISTRICT)
DOWNTOWN ARTS ACADEMY (210 E. BROADWAY BLVD. in TUCSON, AZ)
(National Center for Education Statistics) - STATE ID-001 Organizations: GLOBAL EDUCATION FOUNDATION (SCHOOL DISTRICT)
CALLI OLLIN ACADEMY (200 N. STONE AVE. in TUCSON, AZ)
(National Center for Education Statistics) - STATE ID-001
CAPE SCHOOL-ADULT (130 W CONGRESS ST in TUCSON, AZ)
(National Center for Education Statistics) - STATE ID-203 Organizations: PIMA ACCOMMODATION DISTRICT (SCHOOL DISTRICT)
CAPE SCHOOL-JUVENILE (130 W CONGRESS ST. in TUCSON, AZ)
(National Center for Education Statistics) - STATE ID-002 Organizations: PIMA ACCOMMODATION DISTRICT (SCHOOL DISTRICT)
CARRILLO INTERMEDIATE MAGNET SCHOOL (440 S MAIN AVE in TUCSON, AZ)
(National Center for Education Statistics) - STATE ID-161 Organizations: TUCSON UNIFIED DISTRICT (SCHOOL DISTRICT)
ARIZONA DEPT OF TRANSP (611 W MESA in TUCSON, AZ)
(Integrated Compliance Information System) - ICIS-09-1996-0060, FORMAL ENFORCEMENT ACTION
A T AND T CO TUCSON (120 E PENNINGTON in TUCSON, AZ)
(Resource Conservation and Recovery Act (tracking hazardous waste)) Organizations: MOUNTAIN BELL TELEPHONE CO (CONTACT/OWNER)
Alternative names: U S WEST BUSINESS RESOURCES
ADOT MATERIALS TESTING LAB (621 E 22ND ST in TUCSON, AZ)
(Resource Conservation and Recovery Act (tracking hazardous waste)) Organizations: ARIZONA DEPT OF TRANSPORTATION (CONTACT/OWNER)
FOX TUCSON THEATRE (17 W CONGRESS in TUCSON, AZ)
(Resource Conservation and Recovery Act (tracking hazardous waste)) Organizations: FOX THEATRE REHAB (CONTACT/OPERATOR)
, ARIZONA FOX THEATRE LLC (CONTACT/OWNER)
PACIFIC WASTE DISPOSAL SERVICES (8380 SOUTH NOGALES HIGHWAY in TUCSON, AZ)
SUPERFUND (Superfund database) (Resource Conservation and Recovery Act (tracking hazardous waste)) Organizations: RENZ MARTINEZ (CONTACT/OWNER)
Alternative names: AZ SAFETY DISPOSAL SERVICES INC
GENERAL SERVICES ADMIN JAMES WALSH COURT (38 S SCOTT AVE in TUCSON, AZ) . Federal Facility. GENERAL SERVICES ADMINISTRATION
(Resource Conservation and Recovery Act (tracking hazardous waste))
Housing units lacking complete plumbing facilities: 3.3% Housing units lacking complete kitchen facilities: 3.1%
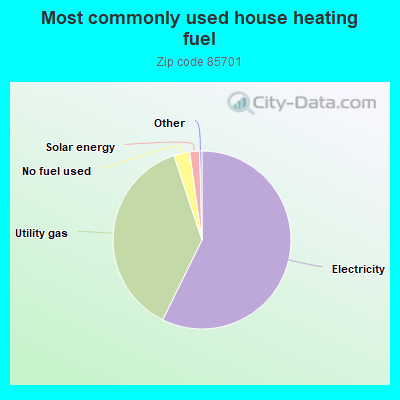
57.3%Electricity
37.6%Utility gas
2.9%No fuel used
1.8%Solar energy
Population in 1990: 5,191.
Place of birth for U.S.-born residents:
This state: 2,310
Northeast: 360
Midwest: 514
South: 385
West: 1,063
38% of the 85701 zip code residents lived in the same house 5 years ago. Out of people who lived in different houses, 62% lived in this county. Out of people who lived in different counties, 50% lived in Arizona.
78% of the 85701 zip code residents lived in the same house 1 year ago. Out of people who lived in different houses, 49% moved from this county. Out of people who lived in different houses, 7% moved from different county within same state. Out of people who lived in different houses, 38% moved from different state. Out of people who lived in different houses, 2% moved from abroad.
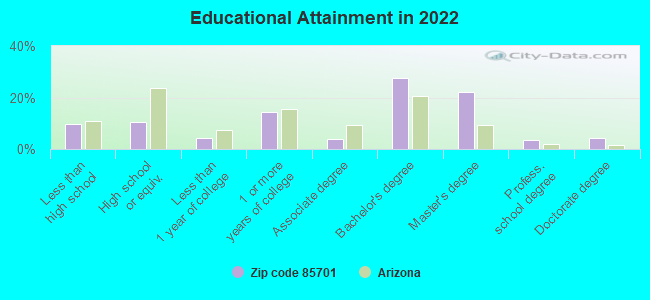
Private vs. public school enrollment:
Students in private schools in grades 1 to 8 (elementary and middle school): 45
Here:
15.2%
Arizona:
10.4%
Students in private schools in grades 9 to 12 (high school):
Here:
0.0%
Arizona:
8.8%
Students in private undergraduate colleges: 4
Here:
1.4%
Arizona:
13.1%
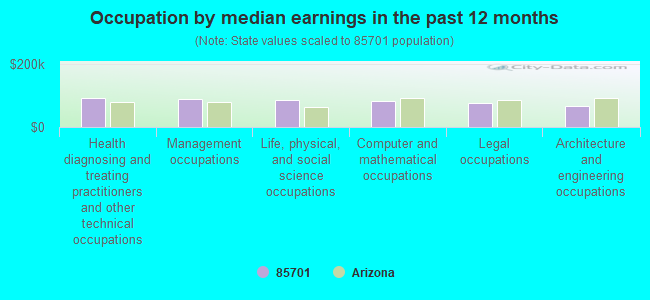
Occupation by median earnings in the past 12 months ($)
91,721Health diagnosing and treating practitioners and other technical occupations
87,683Management occupations
84,069Life, physical, and social science occupations
83,386Computer and mathematical occupations
76,105Legal occupations
68,020Architecture and engineering occupations
Companies with federal contracts located in this zip code (TUCSON, AZ):
RELIANCE CENTRO L P (1 SOUTH AVE 120) : $2,044,908 in 38 contractsfrom 1999 to 2006
Contracts for Lease or Rental of Facilities -- Office Buildings by Public Buildings Service Signed by year:2000: $339,000; 2001: $0; 2002: $0; 2003: $560,304; 2004: $140,076; 2005: $609,148; 2006: $283,380.
Biggest contracts:
$113,000 with Public Buildings Service for Lease or Rental of Facilities -- Office Buildings. Signed on 2000-06-15. Completion date: 2000-06-15.
$113,000, same as above.Signed on 1999-12-15. Completion date: 1999-12-15.
$113,000, same as above.Signed on 2000-03-15. Completion date: 2000-03-15.
$113,000, same as above.Signed on 2000-09-15. Completion date: 2000-09-15.
MCGANN & ASSOCIATES INC/NOVAK (378 N MAIN AVE; small business) : $1,760,500 in 13 contractsfrom 2000 to 2005
Contracts for Architect - Engineer Services (including landscaping, interior layout, and designing) by U.S. Army Corps of Engineers - civil program financing only, Army Signed by year:2000: $843,001; 2001: $74,256; 2002: $19,321; 2003: $290,000; 2004: $104,922; 2005: $429,000; 2006: $0.
Biggest contracts:
$349,938 with U.S. Army Corps of Engineers - civil program financing only for Architect - Engineer Services (including landscaping, interior layout, and designing). Signed on 2000-10-31. Completion date: 2001-04-30.
$300,000, same as above.Signed on 2000-04-10. Completion date: 2000-10-17.
$290,000, same as above.Signed on 2003-04-17. Completion date: 2003-12-11.
$214,500 with Army for Architect - Engineer Services (including landscaping, interior layout, and designing). Signed on 2005-08-23. Completion date: 2004-08-31.
COLLINS, PINA CONSULTING ENGIN (33 N STONE AVE STE 1500; small business) : $1,210,517 in 16 contractsfrom 2000 to 2005
Contracts for Architect - Engineer Services (including landscaping, interior layout, and designing), Other Architect and Engineering Services by U.S. Army Corps of Engineers - civil program financing only, Army Signed by year:2000: $1,040,047; 2001: $153,860; 2002: $0; 2003: $0; 2004: $0; 2005: $16,610; 2006: $0.
Biggest contracts:
$296,000 with U.S. Army Corps of Engineers - civil program financing only for Architect - Engineer Services (including landscaping, interior layout, and designing). Taking place in NV. Signed on 2000-12-08. Completion date: 2001-04-18.
$208,160 with U.S. Army Corps of Engineers - civil program financing only for Architect - Engineer Services (including landscaping, interior layout, and designing). Signed on 2000-04-10. Completion date: 2000-07-31.
$174,200 with U.S. Army Corps of Engineers - civil program financing only for Architect - Engineer Services (including landscaping, interior layout, and designing). Taking place in CA. Signed on 2000-04-13. Completion date: 2000-09-22.
$151,000, same as above.Signed on 2000-04-13. Completion date: 2000-09-08.
NATIONAL TRAFFIC SAFETY INSTIT (177 N CHURCH AVE STE 610) : $1,096,333 in 2 contractsfrom 2004 to 2005
$901,333 with Army for Other Education and Training Services. Taking place in VA. Signed on 2004-12-22. Completion date: 2005-12-26.
$195,000, same as above.Signed on 2005-06-24. Completion date: 2005-12-26.
PUEBLO CENTERS PARTNERSHIP (181 W BROADWAY BLVD; small business)
$61,615 with Army for Lodging - Hotel/Motel. Signed on 2006-07-07. Completion date: 2006-08-06.
AVIAR COMMERCIAL SPACE PLANNIN (180 E BROADWAY BLVD; small business) : $18,551 in 2 contractsin 2006
$10,000 with Air Force for Patent and Trademark Services. Signed on 2006-05-23. Completion date: 2006-05-24.
$8,551 with Air Force for Other Administrative Support Services. Signed on 2006-07-10. Completion date: 2006-07-17.
CHAPMAN-DYER STEEL MFG CO (575 E 19TH ST; small business) : $11,617 in 3 contractsfrom 2005 to 2006
$5,536 with Air Force for Bars and Rods. Signed on 2006-05-31. Completion date: 2006-06-09.
$3,537 with Bureau of Prisoners/Federal Prison System for Iron and Steel Primary and Semifinished Products. Signed on 2005-06-15. Completion date: 2005-06-24.
$2,544, same as above.Signed on 2005-08-19. Completion date: 2005-08-22.
Top industries in this zip code by the number of employees in 2005:
2013 - 2018 National Fire Incident Reporting System (NFIRS) incidents
Based on the data from the years 2013 - 2018 the average number of fire incidents per year is 30. The highest number of fire incidents - 42 took place in 2017, and the least - 11 in 2013. The data has a rising trend.
When looking into fire subcategories, the most incidents belonged to: Outside Fires (47.2%), and Structure Fires (37.8%).
Fire incident types reported to NFIRS in Zip Code 85701


 Nearest zip codes: 85726, 85724, 85723, 85719, 85713, 85714.
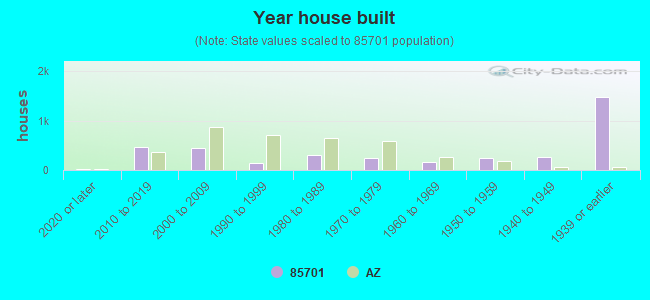


 Based on the data from the years 2013 - 2018 the average number of fire incidents per year is 30. The highest number of fire incidents - 42 took place in 2017, and the least - 11 in 2013. The data has a rising trend.
 When looking into fire subcategories, the most incidents belonged to: Outside Fires (47.2%), and Structure Fires (37.8%).