Estimated zip code population in 2022: 50,222 Zip code population in 2010: 43,989 Zip code population in 2000: 44,066
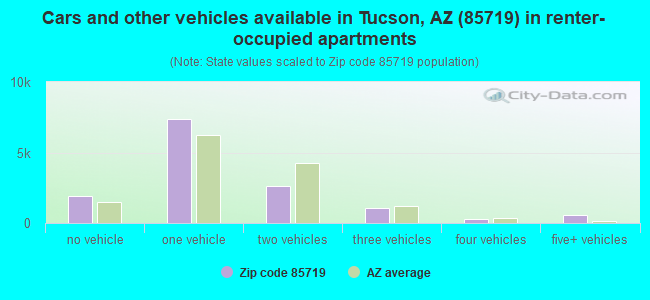
Houses and condos: 22,126 Renter-occupied apartments: 13,804
% of renters here:
71%
State:
33%
March 2022 cost of living index in zip code 85719: 94.1 (less than average, U.S. average is 100)
Land area: 8.2 sq. mi. Water area: 0.0 sq. mi.
Population density: 6,137 people per square mile
(high).
OSM Map
General Map
Google Map
MSN Map
OSM Map
General Map
Google Map
MSN Map
OSM Map
General Map
Google Map
MSN Map
OSM Map
General Map
Google Map
MSN Map
Please wait while loading the map...
Real estate property taxes paid for housing units in 2022:
This zip code:
0.6% ($2,061)
Arizona:
0.4% ($1,786)
Median real estate property taxes paid for housing units with mortgages in 2022: $2,116 (0.6%) Median real estate property taxes paid for housing units with no mortgage in 2022: $1,990 (0.6%)
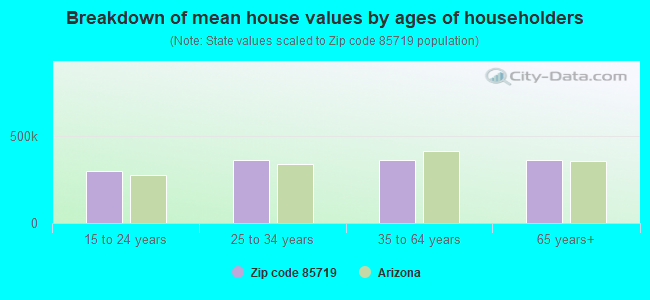
Estimated median house/condo value in 2022: $331,364
85719:
$331,364
Arizona:
$402,800
According to our research of Arizona and other state lists, there were 56 registered sex offenders living in 85719 zip code as of April 27, 2024. The ratio of all residents to sex offenders in zip code 85719 is 833 to 1. The ratio of registered sex offenders to all residents in this zip code is near the state average.
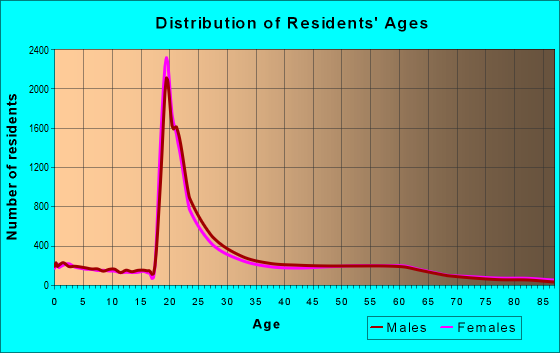
Median resident age:
This zip code:
23.4 years
Arizona median age:
38.8 years
Average household size:
This zip code:
2.1 people
Arizona:
2.5 people
Averages for the 2020 tax year for zip code 85719, filed in 2021:
Average Adjusted Gross Income (AGI) in 2020: $49,084 (Individual Income Tax Returns)
Here:
$49,084
State:
$73,499
Salary/wage: $39,834 (reported on 84.1% of returns)
Here:
$39,834
State:
$59,499
(% of AGI for various income ranges: 1221.6% for AGIs below $25k, 3816.1% for AGIs $25k-50k, 6812.6% for AGIs $50k-75k, 10303.2% for AGIs $75k-100k, 18380.0% for AGIs $100k-200k, 68299.2% for AGIs over 200k)
Taxable interest for individuals: $1,750 (reported on 21.6% of returns)
This zip code:
$1,750
Arizona:
$2,325
(% of AGI for various income ranges: 9.5% for AGIs below $25k, 15.5% for AGIs $25k-50k, 43.1% for AGIs $50k-75k, 89.6% for AGIs $75k-100k, 196.0% for AGIs $100k-200k, 2251.5% for AGIs over 200k)
Ordinary dividends: $8,438 (reported on 17.2% of returns)
Here:
$8,438
State:
$8,711
(% of AGI for various income ranges: 22.8% for AGIs below $25k, 38.1% for AGIs $25k-50k, 129.1% for AGIs $50k-75k, 332.5% for AGIs $75k-100k, 756.5% for AGIs $100k-200k, 10226.9% for AGIs over 200k)
Net capital gain/loss in AGI: +$16,023 (reported on 16.6% of returns)
Here:
+$16,023
State:
+$31,332
(% of AGI for various income ranges: 11.6% for AGIs below $25k, 38.1% for AGIs $25k-50k, 161.3% for AGIs $50k-75k, 336.8% for AGIs $75k-100k, 1322.0% for AGIs $100k-200k, 23091.5% for AGIs over 200k)
Profit/loss from business: +$13,193 (reported on 15.0% of returns)
Here:
+$13,193
State:
+$13,214
(% of AGI for various income ranges: 95.7% for AGIs below $25k, 121.6% for AGIs $25k-50k, 261.6% for AGIs $50k-75k, 572.6% for AGIs $75k-100k, 960.5% for AGIs $100k-200k, 8049.2% for AGIs over 200k)
Taxable individual retirement arrangement distribution: $20,174 (reported on 5.9% of returns)
85719:
$20,174
Arizona:
$23,364
(% of AGI for various income ranges: 27.1% for AGIs below $25k, 50.4% for AGIs $25k-50k, 190.2% for AGIs $50k-75k, 395.3% for AGIs $75k-100k, 1119.6% for AGIs $100k-200k, 4006.2% for AGIs over 200k)
Self-employed (Keogh) retirement plans: $19,688 (reported on 0.5% of returns)
85719:
$19,688
Arizona:
$26,938
(% of AGI for various income ranges: 7.5% for AGIs $25k-50k, 82.5% for AGIs $100k-200k, 643.1% for AGIs over 200k)
Total itemized deductions: $33,930 (reported on 4.8% of returns)
Here:
$33,930
State:
$36,308
(% of AGI for various income ranges: 37.1% for AGIs below $25k, 69.5% for AGIs $25k-50k, 235.2% for AGIs $50k-75k, 517.4% for AGIs $75k-100k, 1251.1% for AGIs $100k-200k, 7236.9% for AGIs over 200k)
Charity contributions: $10,743 (reported on 3.7% of returns)
Here:
$10,743
State:
$11,955
(% of AGI for various income ranges: 1.2% for AGIs below $25k, 5.9% for AGIs $25k-50k, 34.0% for AGIs $50k-75k, 118.1% for AGIs $75k-100k, 260.9% for AGIs $100k-200k, 2810.0% for AGIs over 200k)
Taxes paid: $6,453 (reported on 4.8% of returns)
85719:
$6,453
State:
$6,820
(% of AGI for various income ranges: 2.9% for AGIs below $25k, 8.7% for AGIs $25k-50k, 42.6% for AGIs $50k-75k, 116.6% for AGIs $75k-100k, 276.4% for AGIs $100k-200k, 1473.1% for AGIs over 200k)
Earned income credit: $1,948 (reported on 17.2% of returns)
Here:
$1,948
State:
$2,383
(% of AGI for various income ranges: 64.2% for AGIs below $25k, 47.9% for AGIs $25k-50k)
Percentage of individuals using paid preparers for their 2020 taxes: 93.4%
Here:
93%
State:
93%
(% for various income ranges: 93.2% for AGIs below $25k, 94.0% for AGIs $25k-50k, 93.0% for AGIs $50k-75k, 92.2% for AGIs $75k-100k, 93.0% for AGIs $100k-200k, 94.1% for AGIs over 200k)
Averages for the 2012 tax year for zip code 85719, filed in 2013:
Average Adjusted Gross Income (AGI) in 2012: $38,477 (Individual Income Tax Returns)
Here:
$38,477
State:
$57,644
Salary/wage: $32,687 (reported on 85.6% of returns)
Here:
$32,687
State:
$47,932
(% of AGI for various income ranges: 84.7% for AGIs below $25k, 84.8% for AGIs $25k-50k, 75.7% for AGIs $50k-75k, 71.0% for AGIs $75k-100k, 64.4% for AGIs $100k-200k, 52.2% for AGIs over 200k)
Taxable interest for individuals: $1,704 (reported on 24.1% of returns)
This zip code:
$1,704
Arizona:
$2,064
(% of AGI for various income ranges: 0.7% for AGIs below $25k, 0.6% for AGIs $25k-50k, 1.2% for AGIs $50k-75k, 1.0% for AGIs $75k-100k, 1.3% for AGIs $100k-200k, 1.8% for AGIs over 200k)
Ordinary dividends: $6,560 (reported on 16.7% of returns)
Here:
$6,560
State:
$7,268
(% of AGI for various income ranges: 1.4% for AGIs below $25k, 1.4% for AGIs $25k-50k, 1.9% for AGIs $50k-75k, 2.6% for AGIs $75k-100k, 3.6% for AGIs $100k-200k, 6.3% for AGIs over 200k)
Net capital gain/loss in AGI: +$8,410 (reported on 13.6% of returns)
Here:
+$8,410
State:
+$15,530
(% of AGI for various income ranges: 0.6% for AGIs $25k-50k, 1.4% for AGIs $50k-75k, 0.8% for AGIs $75k-100k, 2.5% for AGIs $100k-200k, 12.1% for AGIs over 200k)
Profit/loss from business: +$10,489 (reported on 14.4% of returns)
Here:
+$10,489
State:
+$12,323
(% of AGI for various income ranges: 6.5% for AGIs below $25k, 2.8% for AGIs $25k-50k, 3.1% for AGIs $50k-75k, 2.8% for AGIs $75k-100k, 4.8% for AGIs $100k-200k, 3.2% for AGIs over 200k)
Taxable individual retirement arrangement distribution: $14,034 (reported on 6.3% of returns)
85719:
$14,034
Arizona:
$18,280
(% of AGI for various income ranges: 1.3% for AGIs below $25k, 1.6% for AGIs $25k-50k, 2.3% for AGIs $50k-75k, 2.8% for AGIs $75k-100k, 3.6% for AGIs $100k-200k, 2.6% for AGIs over 200k)
Self-employment retirement plans: $19,014 (reported on 0.5% of returns)
85719:
$19,014
Arizona:
$22,154
(% of AGI for various income ranges: 0.2% for AGIs $25k-50k, 0.6% for AGIs $100k-200k, 0.6% for AGIs over 200k)
Total itemized deductions: $21,151 (22% of AGI, reported on 19.3% of returns)
Here:
$21,151
State:
$23,651
Here:
22.4% of AGI
State:
20.6% of AGI
(% of AGI for various income ranges: 6.3% for AGIs below $25k, 7.2% for AGIs $25k-50k, 13.3% for AGIs $50k-75k, 12.4% for AGIs $75k-100k, 13.0% for AGIs $100k-200k, 13.5% for AGIs over 200k)
Charity contributions: $3,686 (reported on 15.3% of returns)
Here:
$3,686
State:
$4,114
(% of AGI for various income ranges: 0.4% for AGIs below $25k, 0.8% for AGIs $25k-50k, 1.3% for AGIs $50k-75k, 1.8% for AGIs $75k-100k, 2.0% for AGIs $100k-200k, 2.7% for AGIs over 200k)
Taxes paid: $5,900 (reported on 19.2% of returns)
85719:
$5,900
State:
$6,509
(% of AGI for various income ranges: 1.0% for AGIs below $25k, 1.6% for AGIs $25k-50k, 3.3% for AGIs $50k-75k, 3.5% for AGIs $75k-100k, 4.2% for AGIs $100k-200k, 4.8% for AGIs over 200k)
Earned income credit: $1,969 (reported on 21.7% of returns)
Here:
$1,969
State:
$2,432
(% of AGI for various income ranges: 5.2% for AGIs below $25k, 0.8% for AGIs $25k-50k)
Percentage of individuals using paid preparers for their 2012 taxes: 40.6%
Here:
41%
State:
52%
(% for various income ranges: 35.7% for AGIs below $25k, 38.4% for AGIs $25k-50k, 50.4% for AGIs $50k-75k, 53.6% for AGIs $75k-100k, 60.6% for AGIs $100k-200k, 76.0% for AGIs over 200k)
Averages for the 2004 tax year for zip code 85719, filed in 2005:
Average Adjusted Gross Income (AGI) in 2004: $31,531 (Individual Income Tax Returns)
Here:
$31,531
State:
$50,097
Salary/wage: $26,817 (reported on 86.8% of returns)
Here:
$26,817
State:
$42,146
(% of AGI for various income ranges: 109.3% for AGIs below $10k, 87.9% for AGIs $10k-25k, 85.8% for AGIs $25k-50k, 74.1% for AGIs $50k-75k, 72.4% for AGIs $75k-100k, 49.1% for AGIs over 100k)
Taxable interest for individuals: $1,897 (reported on 32.5% of returns)
This zip code:
$1,897
Arizona:
$2,374
(% of AGI for various income ranges: 3.5% for AGIs below $10k, 1.2% for AGIs $10k-25k, 1.3% for AGIs $25k-50k, 2.4% for AGIs $50k-75k, 1.9% for AGIs $75k-100k, 2.6% for AGIs over 100k)
Taxable dividends: $3,479 (reported on 19.8% of returns)
Here:
$3,479
State:
$3,888
(% of AGI for various income ranges: 2.8% for AGIs below $10k, 1.0% for AGIs $10k-25k, 1.2% for AGIs $25k-50k, 2.2% for AGIs $50k-75k, 2.2% for AGIs $75k-100k, 3.7% for AGIs over 100k)
Net capital gain/loss: +$11,860 (reported on 16.0% of returns)
Here:
+$11,860
State:
+$17,569
(% of AGI for various income ranges: -1.1% for AGIs below $10k, 0.3% for AGIs $10k-25k, 1.0% for AGIs $25k-50k, 1.6% for AGIs $50k-75k, 3.0% for AGIs $75k-100k, 18.8% for AGIs over 100k)
Profit/loss from business: +$9,972 (reported on 12.5% of returns)
Here:
+$9,972
State:
+$11,088
(% of AGI for various income ranges: 4.2% for AGIs below $10k, 3.5% for AGIs $10k-25k, 2.7% for AGIs $25k-50k, 3.6% for AGIs $50k-75k, 3.4% for AGIs $75k-100k, 5.9% for AGIs over 100k)
Profit/loss from farming: +$455 (reported on 0.1% of returns)
Here:
+$455
State:
-$7,013
IRA payment deduction: $2,592 (reported on 2.3% of returns)
85719:
$2,592
Arizona:
$3,023
(% of AGI for various income ranges: 0.2% for AGIs below $10k, 0.2% for AGIs $10k-25k, 0.2% for AGIs $25k-50k, 0.2% for AGIs $50k-75k, 0.2% for AGIs $75k-100k, 0.1% for AGIs over 100k)
Self-employed pension: $12,567 (reported on 0.7% of returns)
Here:
$12,567
Arizona:
$15,785
(% of AGI for various income ranges: 0.1% for AGIs $25k-50k, 0.2% for AGIs $50k-75k, 0.3% for AGIs $75k-100k, 0.6% for AGIs over 100k)
Total itemized deductions: $14,973 (22% of AGI, reported on 22.8% of returns)
Here:
$14,973
State:
$19,781
Here:
21.8% of AGI
State:
21.8% of AGI
(% of AGI for various income ranges: 10.2% for AGIs below $10k, 5.8% for AGIs $10k-25k, 8.4% for AGIs $25k-50k, 13.8% for AGIs $50k-75k, 14.7% for AGIs $75k-100k, 13.6% for AGIs over 100k)
Charity contributions deductions: $3,207 (4% of AGI, reported on 16.7% of returns)
Here:
$3,207
State:
$3,389
Here:
3.9% of AGI
State:
3.5% of AGI
(% of AGI for various income ranges: 0.3% for AGIs below $10k, 0.5% for AGIs $10k-25k, 0.9% for AGIs $25k-50k, 2.1% for AGIs $50k-75k, 2.1% for AGIs $75k-100k, 3.1% for AGIs over 100k)
Total tax: $4,762 (reported on 70.5% of returns)
85719:
$4,762
State:
$8,323
(% of AGI for various income ranges: 2.8% for AGIs below $10k, 4.5% for AGIs $10k-25k, 7.8% for AGIs $25k-50k, 10.5% for AGIs $50k-75k, 11.9% for AGIs $75k-100k, 18.0% for AGIs over 100k)
Earned income credit: $1,514 (reported on 17.5% of returns)
Here:
$1,514
State:
$1,786
Percentage of individuals using paid preparers for their 2004 taxes: 45.4%
Here:
45%
State:
60%
(% for various income ranges: 38.6% for AGIs below $10k, 44.5% for AGIs $10k-25k, 45.2% for AGIs $25k-50k, 53.2% for AGIs $50k-75k, 57.4% for AGIs $75k-100k, 71.0% for AGIs over 100k)
Likely homosexual households (counted as self-reported same-sex unmarried-partner households)
Lesbian couples: 0.4% of all households
Gay men: 0.2% of all households
Household received Food Stamps/SNAP in the past 12 months: 2,882 Household did not receive Food Stamps/SNAP in the past 12 months: 16,992
Women who had a birth in the past 12 months: 506 (200 now married, 296 unmarried) Women who did not have a birth in the past 12 months: 18,648 (2,600 now married, 16,234 unmarried)
Housing units in zip code 85719 with a mortgage: 2,927 (218 second mortgage, 12 home equity loan, 188 both second mortgage and home equity loan) Houses without a mortgage: 62
Median monthly owner costs for units with a mortgage: $1,527 Median monthly owner costs for units without a mortgage: $483
Residents with income below the poverty level in 2022:
This zip code:
31.4%
Whole state:
12.5%
Residents with income below 50% of the poverty level in 2022:
This zip code:
9.5%
Whole state:
6.0%
Median number of rooms in houses and condos:
Here:
5.5
State:
6.0
Median number of rooms in apartments:
Here:
3.8
State:
4.1
Notable locations in this zip code not listed on our city pages
Notable locations in zip code 85719: Amphi Plaza (A), Prince Road Office Park (B), University of Arizona Hillenbrand Memorial Stadium (C), University of Arizona Hillenbrand Aquatic Center (D), University of Arizona - Arizona Stadium (E), Arizona State Highway Patrol (F), Arizona Pioneer Historical Society (G), University of Arizona Visitor Center (H), University of Arizona Steward Observatory (I), University of Arizona Museum of Art and Archive of Visual Arts (J), University of Arizona Grace H Flandrau Science Center (K), Arizona State Museum (L), University of Arizona Main Library (M), University of Arizona Science Library (N), University of Arizona Arizona Health Sciences Center Library (O), University of Arizona School of Information Resources and Library Sciences (P), University of Arizona Student Recreation Center (Q), University of Arizona Centennial Hall (R), University of Arizona Stevie Eller Dance Theater (S), University of Arizona Radiology Medical Research Center (T). Display/hide their locations on the map
Shopping Centers: Campbell Plaza Shopping Center (1), Grant Park Shopping Center (2), University Square Shopping Center (3), Grant Park Shopping Center (4). Display/hide their locations on the map
Churches in zip code 85719 include: Saint James United Methodist Church (A), Saint Demetrios Greek Orthodox Church (B), Saint Ambrose Church (C), Our Saviour's Lutheran Church (D), Northminster Presbyterian Church (E), Mountain Avenue Church of Christ (F), Monte Vista Christian Church (G), Metropolitan Community Church (H), Greater Faith Church (I). Display/hide their locations on the map
Parks in zip code 85719 include: Navajo Park (1), Conner Park (2), Mitchell Park (3), Tahoe Park (4), Jefferson Park (5). Display/hide their locations on the map
Tourist attractions (not listed on the city page) : Franklin Museum (1405 East Kleindale Road), Postal History Foundation (Cultural Attractions- Events- & Facilities; 920 North 1st Avenue), Noao (Cultural Attractions- Events- & Facilities; 950 North Cherry Avenue), National Optical Astronomy Observatories - Main Office (Cultural Attractions- Events- & Facilities; 950 North Cherry Avenue).
2,608 married couples with children.
1,765 single-parent households (306 men, 1,459 women).
75.8% of residents of 85719 zip code speak English at home.
13.6% of residents speak Spanish at home (75% very well, 12% well, 8% not well, 5% not at all).
4.3% of residents speak other Indo-European language at home (81% very well, 6% well, 8% not well, 6% not at all).
4.1% of residents speak Asian or Pacific Island language at home (66% very well, 26% well, 7% not well, 1% not at all).
2.1% of residents speak other language at home (72% very well, 22% well, 5% not well).
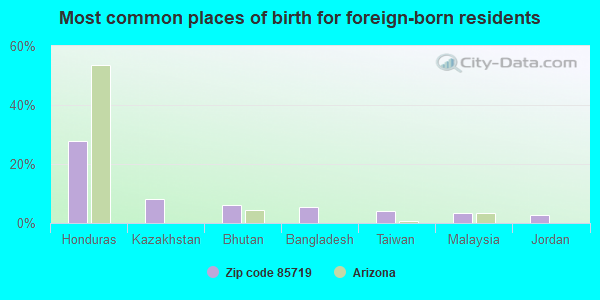
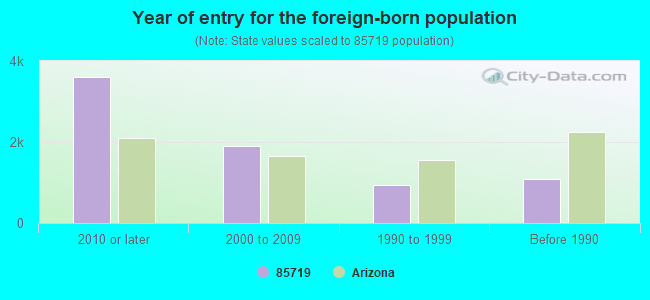
Foreign born population: 6,343 (12.6%) (33.4% of them are naturalized citizens)
Major facilities with environmental interests located in this zip code:
HOMEBOUND/TELETEACHING (445 S. PARK in TUCSON, AZ)
(National Center for Education Statistics) - STATE ID-122 (National Center for Education Statistics) - STATE ID-602 Organizations: TUCSON UNIFIED DISTRICT (SCHOOL DISTRICT)
HERCO INC (1959 EAST 19TH STREET in TUCSON, AZ)
COMPLIANCE ACTIVITY (Tracking inspections of insecticide, fungicide, and rodenticide, and toxic substances) (Resource Conservation and Recovery Act (tracking hazardous waste)) Small Quantity Generators, between 100 kg and 1000 kg of hazardous waste/month (Resource Conservation and Recovery Act (tracking hazardous waste)) TRI REPORTER (Tracking of toxic chemicals releasing facilities) Business SIC and NAICS classification: ELECTROPLATING, PLATING, POLISHING, ANODIZING, AND COLORING Organizations: JOE WASTSON (CONTACT/OPERATOR)
, RICHARD A YASKANICH (CONTACT/OWNER)
, GREGORY J KARI (CONTACT/OWNER)
, JOAN WATSON (CONTACT/OWNER)
Alternative names: QUALITY PLATING COMPANY INC
EARTHGRAINS BAKING COMPANY (827 EAST 17TH STREET in TUCSON, AZ)
AIR MINOR (AIRS/AFS) (Integrated Compliance Information System) - ICIS-09-2001-0034, FORMAL ENFORCEMENT ACTION Business SIC classification: BREAD AND OTHER BAKERY PRODUCTS, EXCEPT COOKIES AND CRACKERS Alternative names: EARTHGRAINS COMPANY
ART WORKS ACADEMY (3601 E. BROADWAY in TUCSON, AZ)
(National Center for Education Statistics) - STATE ID-685 Organizations: TUCSON UNIFIED DISTRICT (SCHOOL DISTRICT)
AZTEC MIDDLE COLLEGE - EAST (8181 E. IRVINGTON in TUCSON, AZ)
(National Center for Education Statistics) - STATE ID-669 Organizations: TUCSON UNIFIED DISTRICT (SCHOOL DISTRICT)
BROADWAY ALTERNATIVE MIDDLE SCHOOL (2120 E BROADWAY in TUCSON, AZ)
(National Center for Education Statistics) - STATE ID-579 Organizations: TUCSON UNIFIED DISTRICT (SCHOOL DISTRICT)
FRANCES OWEN HOLAWAY ELEMENTARY SCHOOL (3500 N CHERRY AVE in TUCSON, AZ)
(National Center for Education Statistics) - STATE ID-108 Organizations: AMPHITHEATER UNIFIED DISTRICT (SCHOOL DISTRICT)
HA:SAN PREPARATORY & LEADERSHIP CHARTER SCHOOL (1333 E. 10TH ST. in TUCSON, AZ)
(National Center for Education Statistics) - STATE ID-001 Organizations: HA:SAN PREPARATORY & LEADERSHIP CHARTER SCHOOL, INC. (SCHOOL DISTRICT)
HIGHLAND FREE SCHOOL (510 SOUTH HIGHLAND AVENUE in TUCSON, AZ)
(National Center for Education Statistics) - STATE ID-101
PACE ALTERNATIVE (594 S CAMPBELL in TUCSON, AZ)
(National Center for Education Statistics) - STATE ID-672 Organizations: TUCSON UNIFIED DISTRICT (SCHOOL DISTRICT)
PASS ALTERNATIVE HIGH SCHOOL (2102 E BROADWAY BLVD in TUCSON, AZ)
(National Center for Education Statistics) - STATE ID-671 Organizations: TUCSON UNIFIED DISTRICT (SCHOOL DISTRICT)
ALIGN RITE TOOL COMPANY (1942 EAST 17TH STREET in TUCSON, AZ)
(Resource Conservation and Recovery Act (tracking hazardous waste)) Organizations: MATT DUNNE & DON COOMBS (CONTACT/OWNER)
Alternative names: SIRUS INDUSTRIES
AMERICAN NATIONAL RED CROSS (222 S CHERRY AVE in TUCSON, AZ)
(Resource Conservation and Recovery Act (tracking hazardous waste)) Organizations: AMER NATL RED CROSS (CONTACT/OWNER)
Housing units lacking complete plumbing facilities: 0.8% Housing units lacking complete kitchen facilities: 1.6%
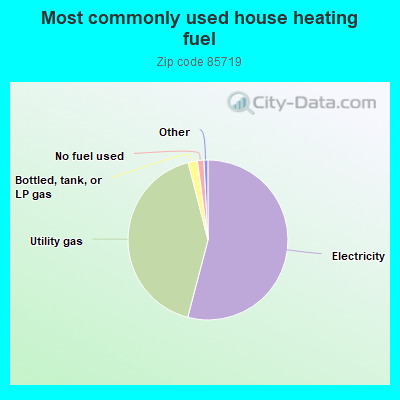
54.1%Electricity
41.9%Utility gas
1.9%Bottled, tank, or LP gas
1.3%No fuel used
Population in 1990: 39,019. Population change in the 1990s: +5,047 (+12.9%).
Place of birth for U.S.-born residents:
This state: 20,073
Northeast: 3,179
Midwest: 6,030
South: 3,918
West: 9,927
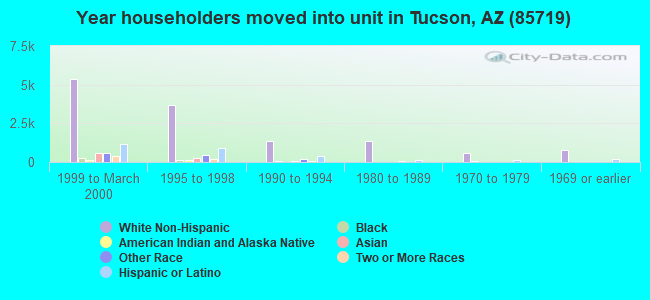
31% of the 85719 zip code residents lived in the same house 5 years ago. Out of people who lived in different houses, 45% lived in this county. Out of people who lived in different counties, 50% lived in Arizona.
74% of the 85719 zip code residents lived in the same house 1 year ago. Out of people who lived in different houses, 48% moved from this county. Out of people who lived in different houses, 11% moved from different county within same state. Out of people who lived in different houses, 30% moved from different state. Out of people who lived in different houses, 6% moved from abroad.
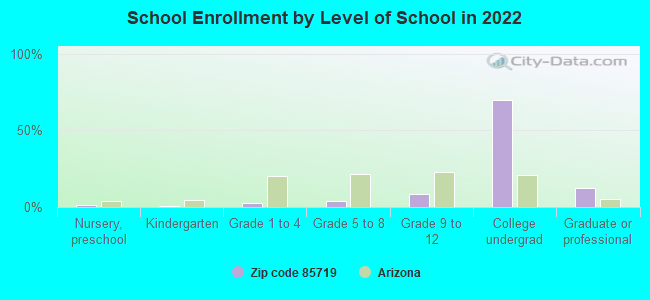
Private vs. public school enrollment:
Students in private schools in grades 1 to 8 (elementary and middle school): 164
Here:
9.6%
Arizona:
10.4%
Students in private schools in grades 9 to 12 (high school): 146
Here:
6.8%
Arizona:
8.8%
Students in private undergraduate colleges: 432
Here:
2.4%
Arizona:
13.1%
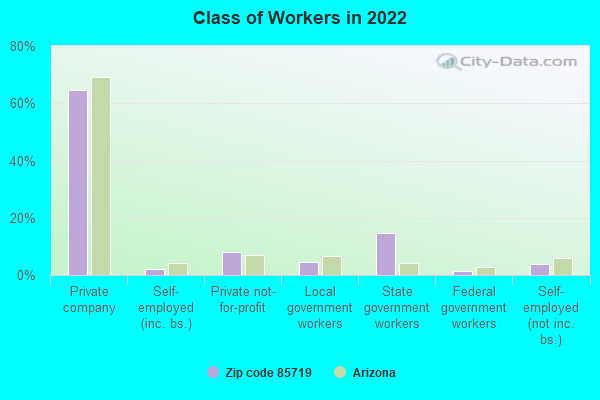
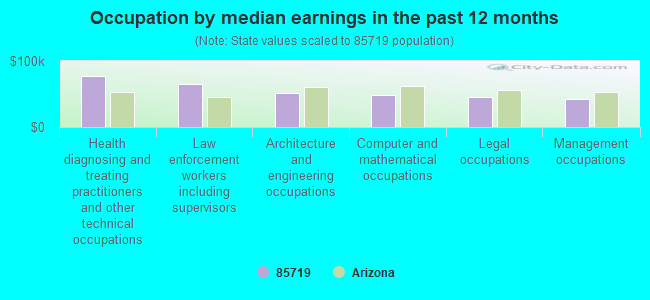
Occupation by median earnings in the past 12 months ($)
77,268Health diagnosing and treating practitioners and other technical occupations
65,098Law enforcement workers including supervisors
51,388Architecture and engineering occupations
48,632Computer and mathematical occupations
45,449Legal occupations
41,727Management occupations
Companies with biggest federal contracts located in this zip code (TUCSON, AZ):
TUCSON FRUIT AND PRODUCE, INC (810 E 17TH ST; small business) : $13,354,195 in 670 contractsfrom 2002 to 2006
Contracts for Non-Food Items For Resale, Fruits and Vegetables by Defense Commissary Agency, Defense Logistics Agency Signed by year:2000: $0; 2001: $0; 2002: $28,429; 2003: $462,471; 2004: $2,613,008; 2005: $6,949,114; 2006: $3,301,173.
Biggest contracts:
$65,675 with Defense Commissary Agency for Non-Food Items For Resale. Signed on 2004-10-01. Completion date: 2005-03-31.
$48,701 with Defense Logistics Agency for Fruits and Vegetables. Signed on 2004-06-05. Completion date: 2004-06-05.
$48,103, same as above.Signed on 2005-03-16. Completion date: 2005-03-16.
$44,940, same as above.Signed on 2003-10-04. Completion date: 2003-10-04.
UNIVERSITY OF ARIZONA (888 N EUCLID AVE) : $2,421,619 in 13 contractsfrom 1999 to 2005
Contracts for Other Research and Development -- Basic Research (R&D), Tuition, Registration, and Membership Fees, Chemical/Biological Studies and Analyses by Navy, U.S. Fish and Wildlife Service Signed by year:2000: $598,137; 2001: $559,969; 2002: $274,227; 2003: $0; 2004: $0; 2005: $631,943; 2006: $0.
Biggest contracts:
$357,343 with Navy for Other Research and Development -- Basic Research (R&D). Signed on 1999-12-13. Completion date: 2000-06-22.
$309,648 with Navy for Tuition, Registration, and Membership Fees. Signed on 2001-08-22. Completion date: 2001-12-09.
$307,077, same as above.Signed on 2005-08-19. Completion date: 2005-12-16.
$302,518, same as above.Signed on 2005-01-06. Completion date: 2005-05-06.
HOTCHKISS ELEVATOR COMPANY INC (203 S KINO PKWY; small business) : $1,544,999 in 70 contractsfrom 2000 to 2006
Contracts for Maintenance, Repair or Alteration of Real Property -- Hospitals and Infirmaries, Maintenance, Repair and Rebuilding of Equipment -- Miscellaneous, Maintenance, Repair and Rebuilding of Equipment -- Materials Handling Equipment, Maintenance, Repair or Alteration of Real Property -- Recreation Facilities (Non-Building), and moreby Department of Veterans Affairs, Public Buildings Service, Army, Air Force, and others Signed by year:2000: $199,000; 2001: $156,695; 2002: $610,406; 2003: $143,510; 2004: $268,520; 2005: $124,256; 2006: $42,612.
Biggest contracts:
$270,000 with Department of Veterans Affairs for Maintenance, Repair or Alteration of Real Property -- Hospitals and Infirmaries. Signed on 2002-07-15. Completion date: 2003-07-15.
$197,000 with Department of Veterans Affairs for Maintenance, Repair and Rebuilding of Equipment -- Miscellaneous. Signed on 2000-08-15. Completion date: 2001-08-15.
$190,000 with Department of Veterans Affairs for Maintenance, Repair or Alteration of Real Property -- Hospitals and Infirmaries. Signed on 2002-09-15. Completion date: 2003-09-15.
$87,561 with Public Buildings Service for Maintenance, Repair and Rebuilding of Equipment -- Materials Handling Equipment. Signed on 2005-09-28. Effective on 2005-10-01. Completion date: 2006-09-30.
INTERSECT TECHNOLOGIES, INC (2030 EAST BROADWAY BLVD) : $1,129,119 in 6 contractsfrom 2000 to 2003
Contracts for Other ADP and Telecommunications Services (includes data storage on tapes, compact disks, etc.), ADP Software by Army Signed by year:2000: $799,000; 2001: $334,000; 2002: -$1,000; 2003: -$2,881; 2004: $0; 2005: $0; 2006: $0.
Biggest contracts:
$499,000 with Army for Other ADP and Telecommunications Services (includes data storage on tapes, compact disks, etc.). Signed on 2000-11-16. Completion date: 2001-04-02.
$300,000 with Army for ADP Software. Signed on 2000-05-03. Completion date: 2001-04-02.
$220,000, same as above.Signed on 2001-04-05. Completion date: 2002-04-04.
$114,000, same as above.Signed on 2001-09-12. Completion date: 2002-04-04.
DTH ENTERPRISES (2016 E BROADWAY BLVD; small business) : $969,815 in 75 contractsin 1999
Contracts for Maintenance, Repair or Alteration of Real Property -- Family Housing Facilities by Navy Signed by year:2000: $0; 2001: $0; 2002: $0; 2003: $0; 2004: $0; 2005: $0; 2006: $0.
Biggest contracts:
$694,207 with Navy for Maintenance, Repair or Alteration of Real Property -- Family Housing Facilities. Taking place in TX. Signed on 1999-10-01. Completion date: 2001-07-31.
$70,800, same as above.Signed on 1999-10-01. Completion date: 2001-07-31.
$19,066, same as above.Signed on 1999-10-01. Completion date: 1999-01-30.
$12,519, same as above.Signed on 1999-10-01. Completion date: 1998-11-30.
EARTHGRAINS BAKING COMPANIES, (827 E 17TH ST) : $669,579 in 9 contractsfrom 2001 to 2005
Contracts for Food Items For Resale, Dairy Foods and Eggs, Bakery and Cereal Products by Defense Commissary Agency, Defense Logistics Agency Signed by year:2000: $0; 2001: $205,889; 2002: $0; 2003: $0; 2004: $118,609; 2005: $345,081; 2006: $0.
Biggest contracts:
$144,486 with Defense Commissary Agency for Food Items For Resale. Signed on 2005-04-01. Completion date: 2005-08-31.
$118,609, same as above.Signed on 2004-10-01. Completion date: 2005-02-28.
$94,338, same as above.Signed on 2005-10-01. Completion date: 2005-12-31.
$82,079 with Defense Logistics Agency for Dairy Foods and Eggs. Signed on 2001-09-11. Completion date: 2001-09-11.
INFRARED LABORATORIES INC (1808 E 17TH ST; small business) : $607,635 in 17 contractsfrom 2000 to 2005
Contracts for Lubrication and Fuel Dispensing Equipment, Miscellaneous Electrical and Electronic Components, Environmental Chambers and Related Equipment, Laboratory Equipment and Supplies, and moreby NASA, National Institute of Standards and Technology, National Oceanic and Atmospheric Administration/Under Secretary for Oceans and Atmosphere, Navy, and others Signed by year:2000: $163,000; 2001: $51,000; 2002: $139,710; 2003: $236,280; 2004: $5,645; 2005: $12,000; 2006: $0.
Biggest contracts:
$99,995 with NASA for Lubrication and Fuel Dispensing Equipment. Signed on 2003-05-15. Completion date: 2003-11-15.
$82,885 with NASA for Miscellaneous Electrical and Electronic Components. Signed on 2003-04-15. Completion date: 2003-07-15.
$51,000 with NASA for Environmental Chambers and Related Equipment. Signed on 2001-11-15. Completion date: 2002-03-15.
$47,000 with National Institute of Standards and Technology for Laboratory Equipment and Supplies. Signed on 2000-08-15. Completion date: 2001-01-15.
MISSION LINEN SUPPLY, A CALIFO (301 S PARK AVE) : $321,474 in 19 contractsfrom 2002 to 2006
Contracts for Laundry and DryCleaning Services, by Air Force, Army, U.S. Customs Service Signed by year:2000: $0; 2001: $0; 2002: $29,576; 2003: $83,628; 2004: $71,190; 2005: $90,799; 2006: $46,281.
Biggest contracts:
$52,400 with Air Force for Laundry and DryCleaning Services. Signed on 2003-10-01. Completion date: 2004-09-30.
$50,000 with Army for Laundry and DryCleaning Services. Signed on 2005-05-18. Completion date: 2004-09-30.
$38,164, same as above.Signed on 2006-04-24. Completion date: 2006-09-30.
$35,904, same as above.Signed on 2005-11-29. Completion date: 2006-09-30.
TUBBS CORDAGE CO , INC (815 E 18TH STREET; small business) : $125,541 in 2 contractsin 2002
$91,541 with Defense Logistics Agency for Fiber Rope, Cordage, and Twine. Signed on 2002-02-14. Completion date: 2002-04-01.
$34,000, same as above.Signed on 2002-04-09. Completion date: 2002-08-01.
INTEGRITY FENCE COMPANY INC (1122 S TYNDALL AVE; small business)
$108,000 with Air Force for Maintenance, Repair or Alteration of Real Property -- Other Non-Building Facilities. Signed on 2003-02-27. Completion date: 2003-09-10.
Top industries in this zip code by the number of employees in 2005:
Accommodation and Food Services: Hotels (except Casino Hotels) and Motels (250-499: 1, 100-249: 1, 50-99: 1)
Professional, Scientific, and Technical Services: Research and Development in the Physical, Engineering, and Life Sciences (250-499: 1, 20-49: 1, 5-9: 1, 1-4: 4)
Health Care and Social Assistance: Blood and Organ Banks (250-499: 1, 5-9: 1)
Administrative and Support and Waste Management and Remediation Services: Temporary Help Services (50-99: 4, 20-49: 2, 5-9: 1, 1-4: 2)
Information: Cable and Other Program Distribution (250-499: 1)
People in group quarters in 2010:
6,728 people in college/university student housing
196 people in nursing facilities/skilled-nursing facilities
169 people in workers' group living quarters and job corps centers
73 people in residential treatment centers for adults
60 people in other noninstitutional facilities
39 people in group homes intended for adults
22 people in residential schools for people with disabilities
18 people in group homes for juveniles (non-correctional)
People in group quarters in 2000:
6,833 people in college dormitories (includes college quarters off campus)
260 people in other noninstitutional group quarters
254 people in other group homes
18 people in nursing homes
10 people in other nonhousehold living situations
6 people in homes for the mentally ill
3 people in religious group quarters
2 people in homes for the mentally retarded
Fatal accident statistics in 2014:
Fatal accident count: 7
Vehicles involved in fatal accidents: 8
Fatal accidents caused by drunken drivers: 2
Fatalities: 7
Persons involved in fatal accidents: 12
Pedestrians involved in fatal accidents: 5
Fatal accident statistics in 2013:
Fatal accident count: 2
Vehicles involved in fatal accidents: 2
Fatal accidents caused by drunken drivers: 0
Fatalities: 2
Persons involved in fatal accidents: 3
Pedestrians involved in fatal accidents: 2
Home Mortgage Disclosure Act Aggregated Statistics For Year 2009 (Based on 5 full and 16 partial tracts)
A) FHA, FSA/RHS & VA Home Purchase Loans
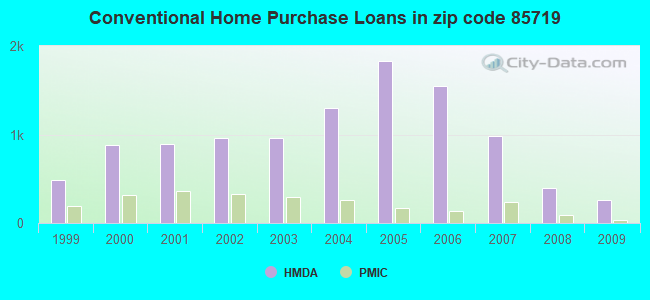
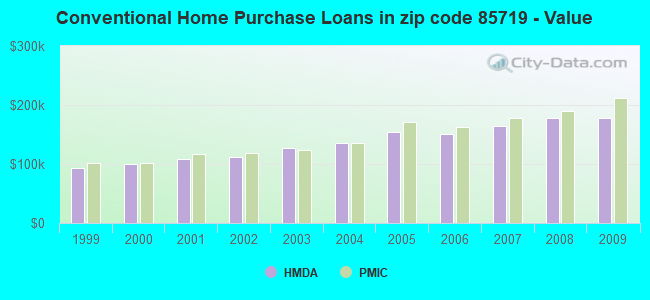
B) Conventional Home Purchase Loans
C) Refinancings
D) Home Improvement Loans
E) Loans on Dwellings For 5+ Families
F) Non-occupant Loans on < 5 Family Dwellings (A B C & D)
G) Loans On Manufactured Home Dwelling (A B C & D)
Number
Average Value
Number
Average Value
Number
Average Value
Number
Average Value
Number
Average Value
Number
Average Value
Number
Average Value
LOANS ORIGINATED
161
$171,294
261
$177,403
970
$182,030
43
$114,760
10
$553,423
253
$154,725
3
$91,197
APPLICATIONS APPROVED, NOT ACCEPTED
7
$165,627
23
$174,448
90
$202,938
14
$104,643
0
$0
33
$167,385
0
$0
APPLICATIONS DENIED
19
$171,661
44
$168,563
318
$185,217
42
$62,507
2
$650,000
90
$185,390
3
$53,100
APPLICATIONS WITHDRAWN
10
$139,167
32
$162,673
205
$172,768
10
$171,678
0
$0
43
$165,994
0
$0
FILES CLOSED FOR INCOMPLETENESS
9
$134,621
5
$237,698
48
$174,584
6
$126,378
2
$499,850
14
$184,311
0
$0
Aggregated Statistics For Year 2008 (Based on 5 full and 16 partial tracts)
A) FHA, FSA/RHS & VA Home Purchase Loans
B) Conventional Home Purchase Loans
C) Refinancings
D) Home Improvement Loans
E) Loans on Dwellings For 5+ Families
F) Non-occupant Loans on < 5 Family Dwellings (A B C & D)
G) Loans On Manufactured Home Dwelling (A B C & D)
Number
Average Value
Number
Average Value
Number
Average Value
Number
Average Value
Number
Average Value
Number
Average Value
Number
Average Value
LOANS ORIGINATED
107
$186,549
397
$178,511
612
$177,476
68
$138,721
17
$898,744
365
$168,223
4
$54,305
APPLICATIONS APPROVED, NOT ACCEPTED
2
$158,965
55
$111,113
96
$175,794
8
$111,210
0
$0
41
$153,562
2
$27,715
APPLICATIONS DENIED
24
$184,619
100
$171,263
384
$191,941
62
$80,098
9
$1,900,559
166
$186,248
8
$50,371
APPLICATIONS WITHDRAWN
18
$173,867
52
$189,807
157
$182,620
13
$82,748
2
$200,320
50
$173,101
3
$36,800
FILES CLOSED FOR INCOMPLETENESS
4
$192,362
19
$191,965
39
$223,118
3
$35,060
0
$0
15
$159,055
2
$155,210
Aggregated Statistics For Year 2007 (Based on 5 full and 16 partial tracts)
A) FHA, FSA/RHS & VA Home Purchase Loans
B) Conventional Home Purchase Loans
C) Refinancings
D) Home Improvement Loans
E) Loans on Dwellings For 5+ Families
F) Non-occupant Loans on < 5 Family Dwellings (A B C & D)
G) Loans On Manufactured Home Dwelling (A B C & D)
Number
Average Value
Number
Average Value
Number
Average Value
Number
Average Value
Number
Average Value
Number
Average Value
Number
Average Value
LOANS ORIGINATED
21
$150,429
978
$164,030
838
$164,383
120
$96,656
31
$2,458,594
758
$156,291
9
$75,314
APPLICATIONS APPROVED, NOT ACCEPTED
1
$186,660
155
$165,607
153
$177,074
49
$91,307
0
$0
133
$171,331
0
$0
APPLICATIONS DENIED
7
$154,966
194
$144,459
451
$179,582
75
$103,914
1
$431,700
184
$157,522
10
$103,618
APPLICATIONS WITHDRAWN
4
$176,570
90
$183,334
223
$166,061
22
$94,977
0
$0
86
$178,351
3
$99,333
FILES CLOSED FOR INCOMPLETENESS
4
$118,965
39
$193,215
73
$184,769
3
$130,900
0
$0
25
$268,876
1
$180,900
Aggregated Statistics For Year 2006 (Based on 5 full and 16 partial tracts)
A) FHA, FSA/RHS & VA Home Purchase Loans
B) Conventional Home Purchase Loans
C) Refinancings
D) Home Improvement Loans
E) Loans on Dwellings For 5+ Families
F) Non-occupant Loans on < 5 Family Dwellings (A B C & D)
G) Loans On Manufactured Home Dwelling (A B C & D)
Number
Average Value
Number
Average Value
Number
Average Value
Number
Average Value
Number
Average Value
Number
Average Value
Number
Average Value
LOANS ORIGINATED
24
$177,871
1,547
$150,238
1,169
$171,035
140
$91,976
13
$2,275,289
949
$157,959
5
$89,698
APPLICATIONS APPROVED, NOT ACCEPTED
1
$115,200
160
$158,216
212
$154,956
46
$56,194
0
$0
111
$157,226
4
$123,410
APPLICATIONS DENIED
6
$184,175
277
$136,262
474
$160,980
82
$61,372
4
$698,370
196
$161,315
25
$50,748
APPLICATIONS WITHDRAWN
3
$267,577
193
$150,859
449
$166,703
30
$121,302
2
$304,490
107
$184,310
0
$0
FILES CLOSED FOR INCOMPLETENESS
1
$29,450
42
$144,308
110
$161,425
11
$63,485
0
$0
22
$156,042
0
$0
Aggregated Statistics For Year 2005 (Based on 5 full and 16 partial tracts)
A) FHA, FSA/RHS & VA Home Purchase Loans
B) Conventional Home Purchase Loans
C) Refinancings
D) Home Improvement Loans
E) Loans on Dwellings For 5+ Families
F) Non-occupant Loans on < 5 Family Dwellings (A B C & D)
G) Loans On Manufactured Home Dwelling (A B C & D)
Number
Average Value
Number
Average Value
Number
Average Value
Number
Average Value
Number
Average Value
Number
Average Value
Number
Average Value
LOANS ORIGINATED
39
$136,407
1,833
$154,288
1,413
$150,338
151
$82,270
26
$1,383,342
1,123
$162,886
7
$75,750
APPLICATIONS APPROVED, NOT ACCEPTED
4
$130,822
143
$141,619
148
$140,651
32
$55,082
0
$0
73
$149,059
10
$69,352
APPLICATIONS DENIED
3
$115,640
255
$135,082
479
$150,503
116
$63,954
0
$0
177
$145,807
31
$67,507
APPLICATIONS WITHDRAWN
7
$128,846
307
$159,276
382
$148,845
69
$113,185
3
$79,097
164
$161,306
4
$90,805
FILES CLOSED FOR INCOMPLETENESS
0
$0
36
$162,036
164
$142,320
4
$37,642
0
$0
22
$137,674
1
$46,490
Aggregated Statistics For Year 2004 (Based on 5 full and 16 partial tracts)
A) FHA, FSA/RHS & VA Home Purchase Loans
B) Conventional Home Purchase Loans
C) Refinancings
D) Home Improvement Loans
E) Loans on Dwellings For 5+ Families
F) Non-occupant Loans on < 5 Family Dwellings (A B C & D)
G) Loans On Manufactured Home Dwelling (A B C & D)
Number
Average Value
Number
Average Value
Number
Average Value
Number
Average Value
Number
Average Value
Number
Average Value
Number
Average Value
LOANS ORIGINATED
41
$115,040
1,301
$134,777
1,419
$124,415
134
$67,861
14
$769,253
943
$136,089
11
$60,578
APPLICATIONS APPROVED, NOT ACCEPTED
2
$73,550
160
$123,476
223
$119,270
31
$46,328
0
$0
110
$130,683
13
$45,908
APPLICATIONS DENIED
3
$108,480
174
$122,694
483
$111,385
105
$41,502
7
$459,080
168
$133,535
28
$38,048
APPLICATIONS WITHDRAWN
10
$143,068
140
$144,493
361
$109,989
48
$47,731
0
$0
118
$146,803
3
$56,237
FILES CLOSED FOR INCOMPLETENESS
0
$0
19
$114,087
136
$122,709
9
$23,439
0
$0
17
$151,333
1
$56,830
Aggregated Statistics For Year 2003 (Based on 5 full and 16 partial tracts)
A) FHA, FSA/RHS & VA Home Purchase Loans
B) Conventional Home Purchase Loans
C) Refinancings
D) Home Improvement Loans
E) Loans on Dwellings For 5+ Families
F) Non-occupant Loans on < 5 Family Dwellings (A B C & D)
Number
Average Value
Number
Average Value
Number
Average Value
Number
Average Value
Number
Average Value
Number
Average Value
LOANS ORIGINATED
87
$113,464
958
$127,518
3,170
$108,357
90
$34,158
10
$740,525
994
$112,133
APPLICATIONS APPROVED, NOT ACCEPTED
2
$127,960
107
$100,200
362
$104,274
12
$22,452
0
$0
81
$102,378
APPLICATIONS DENIED
16
$102,868
163
$79,817
651
$96,940
71
$32,587
3
$663,950
127
$90,628
APPLICATIONS WITHDRAWN
11
$91,368
116
$122,741
495
$108,314
11
$70,094
1
$289,770
102
$120,636
FILES CLOSED FOR INCOMPLETENESS
2
$83,655
22
$147,098
103
$127,694
6
$33,290
1
$1,383,530
36
$128,288
Aggregated Statistics For Year 2002 (Based on 5 full and 16 partial tracts)
A) FHA, FSA/RHS & VA Home Purchase Loans
B) Conventional Home Purchase Loans
C) Refinancings
D) Home Improvement Loans
E) Loans on Dwellings For 5+ Families
F) Non-occupant Loans on < 5 Family Dwellings (A B C & D)
Number
Average Value
Number
Average Value
Number
Average Value
Number
Average Value
Number
Average Value
Number
Average Value
LOANS ORIGINATED
108
$100,101
959
$112,338
2,137
$106,366
88
$34,666
14
$1,941,521
752
$105,308
APPLICATIONS APPROVED, NOT ACCEPTED
8
$115,722
121
$85,967
270
$93,670
26
$30,765
0
$0
80
$90,457
APPLICATIONS DENIED
8
$52,600
160
$67,123
504
$91,402
67
$23,479
2
$1,901,880
78
$101,549
APPLICATIONS WITHDRAWN
10
$69,083
118
$90,344
358
$97,323
21
$35,866
0
$0
88
$86,642
FILES CLOSED FOR INCOMPLETENESS
1
$256,360
22
$113,275
70
$103,035
1
$6,200
0
$0
9
$93,786
Aggregated Statistics For Year 2001 (Based on 5 full and 16 partial tracts)
A) FHA, FSA/RHS & VA Home Purchase Loans
B) Conventional Home Purchase Loans
C) Refinancings
D) Home Improvement Loans
E) Loans on Dwellings For 5+ Families
F) Non-occupant Loans on < 5 Family Dwellings (A B C & D)
Number
Average Value
Number
Average Value
Number
Average Value
Number
Average Value
Number
Average Value
Number
Average Value
LOANS ORIGINATED
152
$94,216
888
$109,224
1,549
$223,548
147
$32,160
22
$924,653
682
$383,143
APPLICATIONS APPROVED, NOT ACCEPTED
3
$83,643
56
$101,232
152
$79,771
19
$23,100
0
$0
39
$84,393
APPLICATIONS DENIED
7
$98,624
153
$85,091
459
$75,469
61
$25,082
0
$0
85
$113,086
APPLICATIONS WITHDRAWN
8
$94,321
86
$120,722
295
$97,259
33
$44,289
3
$714,717
51
$96,635
FILES CLOSED FOR INCOMPLETENESS
6
$76,000
15
$117,243
75
$79,153
1
$11,180
0
$0
25
$99,795
Aggregated Statistics For Year 2000 (Based on 5 full and 16 partial tracts)
A) FHA, FSA/RHS & VA Home Purchase Loans
B) Conventional Home Purchase Loans
C) Refinancings
D) Home Improvement Loans
E) Loans on Dwellings For 5+ Families
F) Non-occupant Loans on < 5 Family Dwellings (A B C & D)
Number
Average Value
Number
Average Value
Number
Average Value
Number
Average Value
Number
Average Value
Number
Average Value
LOANS ORIGINATED
134
$83,787
886
$99,555
485
$83,423
125
$25,654
14
$921,594
376
$92,204
APPLICATIONS APPROVED, NOT ACCEPTED
15
$70,547
83
$75,646
71
$62,498
28
$30,101
0
$0
26
$72,324
APPLICATIONS DENIED
21
$78,723
193
$58,186
273
$71,933
61
$26,104
0
$0
65
$100,506
APPLICATIONS WITHDRAWN
20
$91,420
114
$102,410
141
$72,845
21
$35,530
2
$158,380
27
$86,974
FILES CLOSED FOR INCOMPLETENESS
2
$70,780
18
$146,872
63
$81,340
1
$46,090
0
$0
12
$105,876
Aggregated Statistics For Year 1999 (Based on 3 full and 9 partial tracts)
A) FHA, FSA/RHS & VA Home Purchase Loans
B) Conventional Home Purchase Loans
C) Refinancings
D) Home Improvement Loans
E) Loans on Dwellings For 5+ Families
F) Non-occupant Loans on < 5 Family Dwellings (A B C & D)
2013 - 2018 National Fire Incident Reporting System (NFIRS) incidents
Based on the data from the years 2013 - 2018 the average number of fires per year is 116. The highest number of reported fires - 144 took place in 2016, and the least - 64 in 2013. The data has a growing trend.
When looking into fire subcategories, the most incidents belonged to: Outside Fires (46.1%), and Structure Fires (32.8%).
Fire incident types reported to NFIRS in Zip Code 85719


+$455
-$7,013
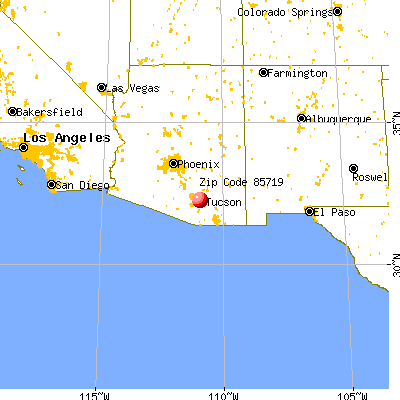
 Nearest zip codes: 85724, 85716, 85701, 85726, 85705, 85712.


 Based on the data from the years 2013 - 2018 the average number of fires per year is 116. The highest number of reported fires - 144 took place in 2016, and the least - 64 in 2013. The data has a growing trend.
 When looking into fire subcategories, the most incidents belonged to: Outside Fires (46.1%), and Structure Fires (32.8%).