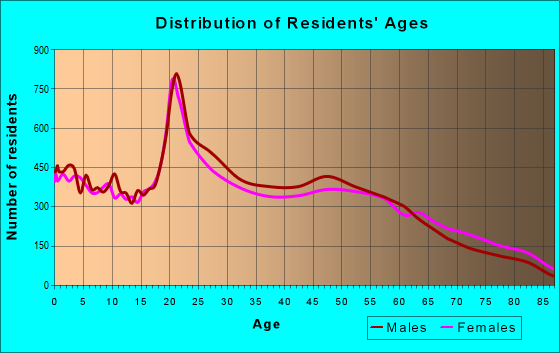
Estimated zip code population in 2022: 57,812 Zip code population in 2010: 57,521 Zip code population in 2000: 55,199
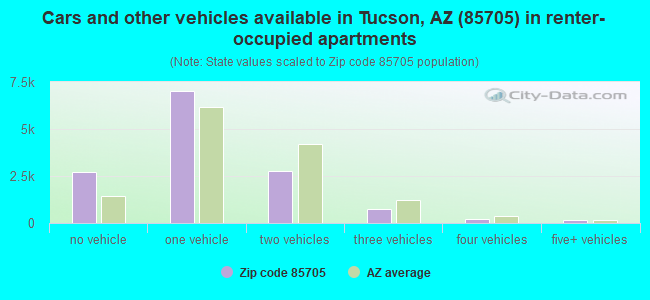
Houses and condos: 29,914 Renter-occupied apartments: 13,762
% of renters here:
53%
State:
33%
March 2022 cost of living index in zip code 85705: 89.1 (less than average, U.S. average is 100)
Land area: 13.6 sq. mi. Water area: 0.1 sq. mi.
Population density: 4,253 people per square mile
(average).
OSM Map
General Map
Google Map
MSN Map
OSM Map
General Map
Google Map
MSN Map
OSM Map
General Map
Google Map
MSN Map
OSM Map
General Map
Google Map
MSN Map
Please wait while loading the map...
Real estate property taxes paid for housing units in 2022:
This zip code:
0.7% ($964)
Arizona:
0.4% ($1,786)
Median real estate property taxes paid for housing units with mortgages in 2022: $1,192 (0.6%) Median real estate property taxes paid for housing units with no mortgage in 2022: $530 (1.5%)
Averages for the 2020 tax year for zip code 85705, filed in 2021:
Average Adjusted Gross Income (AGI) in 2020: $32,247 (Individual Income Tax Returns)
Here:
$32,247
State:
$73,499
Salary/wage: $29,830 (reported on 83.4% of returns)
Here:
$29,830
State:
$59,499
(% of AGI for various income ranges: 1190.5% for AGIs below $25k, 3672.3% for AGIs $25k-50k, 7158.6% for AGIs $50k-75k, 10796.1% for AGIs $75k-100k, 19136.1% for AGIs $100k-200k, 53236.7% for AGIs over 200k)
Taxable interest for individuals: $865 (reported on 10.9% of returns)
This zip code:
$865
Arizona:
$2,325
(% of AGI for various income ranges: 5.4% for AGIs below $25k, 5.5% for AGIs $25k-50k, 20.1% for AGIs $50k-75k, 54.9% for AGIs $75k-100k, 75.4% for AGIs $100k-200k, 1873.3% for AGIs over 200k)
Ordinary dividends: $3,338 (reported on 5.9% of returns)
Here:
$3,338
State:
$8,711
(% of AGI for various income ranges: 6.7% for AGIs below $25k, 10.6% for AGIs $25k-50k, 40.1% for AGIs $50k-75k, 145.7% for AGIs $75k-100k, 281.1% for AGIs $100k-200k, 4046.7% for AGIs over 200k)
Net capital gain/loss in AGI: +$11,265 (reported on 5.9% of returns)
Here:
+$11,265
State:
+$31,332
(% of AGI for various income ranges: 4.2% for AGIs below $25k, 10.2% for AGIs $25k-50k, 79.1% for AGIs $50k-75k, 270.6% for AGIs $75k-100k, 1154.6% for AGIs $100k-200k, 29256.7% for AGIs over 200k)
Profit/loss from business: +$8,862 (reported on 14.1% of returns)
Here:
+$8,862
State:
+$13,214
(% of AGI for various income ranges: 144.7% for AGIs below $25k, 123.3% for AGIs $25k-50k, 221.7% for AGIs $50k-75k, 305.5% for AGIs $75k-100k, 647.9% for AGIs $100k-200k, 3703.3% for AGIs over 200k)
Taxable individual retirement arrangement distribution: $11,220 (reported on 3.8% of returns)
85705:
$11,220
Arizona:
$23,364
(% of AGI for various income ranges: 19.9% for AGIs below $25k, 34.1% for AGIs $25k-50k, 129.8% for AGIs $50k-75k, 371.0% for AGIs $75k-100k, 521.1% for AGIs $100k-200k, 1850.0% for AGIs over 200k)
Total itemized deductions: $29,560 (reported on 1.5% of returns)
Here:
$29,560
State:
$36,308
(% of AGI for various income ranges: 11.6% for AGIs below $25k, 41.4% for AGIs $25k-50k, 104.2% for AGIs $50k-75k, 273.9% for AGIs $75k-100k, 881.1% for AGIs $100k-200k, 3663.3% for AGIs over 200k)
Charity contributions: $6,436 (reported on 1.1% of returns)
Here:
$6,436
State:
$11,955
(% of AGI for various income ranges: 0.7% for AGIs below $25k, 4.2% for AGIs $25k-50k, 15.8% for AGIs $50k-75k, 39.2% for AGIs $75k-100k, 218.6% for AGIs $100k-200k, 730.0% for AGIs over 200k)
Taxes paid: $4,709 (reported on 1.4% of returns)
85705:
$4,709
State:
$6,820
(% of AGI for various income ranges: 1.1% for AGIs below $25k, 3.8% for AGIs $25k-50k, 14.6% for AGIs $50k-75k, 46.3% for AGIs $75k-100k, 182.1% for AGIs $100k-200k, 930.0% for AGIs over 200k)
Earned income credit: $2,466 (reported on 30.3% of returns)
Here:
$2,466
State:
$2,383
(% of AGI for various income ranges: 124.3% for AGIs below $25k, 91.8% for AGIs $25k-50k, 2.2% for AGIs $50k-75k)
Percentage of individuals using paid preparers for their 2020 taxes: 92.7%
Here:
93%
State:
93%
(% for various income ranges: 91.9% for AGIs below $25k, 93.8% for AGIs $25k-50k, 93.1% for AGIs $50k-75k, 92.4% for AGIs $75k-100k, 91.4% for AGIs $100k-200k, 90.9% for AGIs over 200k)
Averages for the 2012 tax year for zip code 85705, filed in 2013:
Average Adjusted Gross Income (AGI) in 2012: $26,982 (Individual Income Tax Returns)
Here:
$26,982
State:
$57,644
Salary/wage: $24,792 (reported on 86.5% of returns)
Here:
$24,792
State:
$47,932
(% of AGI for various income ranges: 82.8% for AGIs below $25k, 85.9% for AGIs $25k-50k, 79.9% for AGIs $50k-75k, 76.2% for AGIs $75k-100k, 67.6% for AGIs $100k-200k, 40.8% for AGIs over 200k)
Taxable interest for individuals: $964 (reported on 13.1% of returns)
This zip code:
$964
Arizona:
$2,064
(% of AGI for various income ranges: 0.5% for AGIs below $25k, 0.3% for AGIs $25k-50k, 0.6% for AGIs $50k-75k, 0.7% for AGIs $75k-100k, 0.6% for AGIs $100k-200k, 0.9% for AGIs over 200k)
Ordinary dividends: $3,936 (reported on 6.8% of returns)
Here:
$3,936
State:
$7,268
(% of AGI for various income ranges: 0.5% for AGIs below $25k, 0.5% for AGIs $25k-50k, 0.9% for AGIs $50k-75k, 0.8% for AGIs $75k-100k, 1.9% for AGIs $100k-200k, 6.3% for AGIs over 200k)
Net capital gain/loss in AGI: +$3,412 (reported on 4.9% of returns)
Here:
+$3,412
State:
+$15,530
(% of AGI for various income ranges: 0.2% for AGIs $25k-50k, 0.6% for AGIs $50k-75k, 0.6% for AGIs $75k-100k, 2.1% for AGIs $100k-200k, 4.9% for AGIs over 200k)
Profit/loss from business: +$9,045 (reported on 12.7% of returns)
Here:
+$9,045
State:
+$12,323
(% of AGI for various income ranges: 8.0% for AGIs below $25k, 2.6% for AGIs $25k-50k, 2.3% for AGIs $50k-75k, 1.6% for AGIs $75k-100k, 5.2% for AGIs $100k-200k)
Taxable individual retirement arrangement distribution: $9,946 (reported on 4.3% of returns)
85705:
$9,946
Arizona:
$18,280
(% of AGI for various income ranges: 1.0% for AGIs below $25k, 1.2% for AGIs $25k-50k, 2.0% for AGIs $50k-75k, 3.5% for AGIs $75k-100k, 4.1% for AGIs $100k-200k)
Total itemized deductions: $15,745 (26% of AGI, reported on 11.0% of returns)
Here:
$15,745
State:
$23,651
Here:
26.1% of AGI
State:
20.6% of AGI
(% of AGI for various income ranges: 3.1% for AGIs below $25k, 5.9% for AGIs $25k-50k, 9.1% for AGIs $50k-75k, 11.0% for AGIs $75k-100k, 11.3% for AGIs $100k-200k, 8.5% for AGIs over 200k)
Charity contributions: $2,258 (reported on 8.0% of returns)
Here:
$2,258
State:
$4,114
(% of AGI for various income ranges: 0.2% for AGIs below $25k, 0.5% for AGIs $25k-50k, 0.9% for AGIs $50k-75k, 1.3% for AGIs $75k-100k, 1.7% for AGIs $100k-200k, 1.3% for AGIs over 200k)
Taxes paid: $3,597 (reported on 10.9% of returns)
85705:
$3,597
State:
$6,509
(% of AGI for various income ranges: 0.5% for AGIs below $25k, 1.2% for AGIs $25k-50k, 2.0% for AGIs $50k-75k, 2.7% for AGIs $75k-100k, 3.2% for AGIs $100k-200k, 3.2% for AGIs over 200k)
Earned income credit: $2,495 (reported on 34.7% of returns)
Here:
$2,495
State:
$2,432
(% of AGI for various income ranges: 8.5% for AGIs below $25k, 1.5% for AGIs $25k-50k)
Percentage of individuals using paid preparers for their 2012 taxes: 46.0%
Here:
46%
State:
52%
(% for various income ranges: 45.5% for AGIs below $25k, 44.9% for AGIs $25k-50k, 48.6% for AGIs $50k-75k, 49.0% for AGIs $75k-100k, 59.4% for AGIs $100k-200k, 85.7% for AGIs over 200k)
Averages for the 2004 tax year for zip code 85705, filed in 2005:
Average Adjusted Gross Income (AGI) in 2004: $24,960 (Individual Income Tax Returns)
Here:
$24,960
State:
$50,097
Salary/wage: $23,259 (reported on 88.1% of returns)
Here:
$23,259
State:
$42,146
(% of AGI for various income ranges: 92.8% for AGIs below $10k, 86.8% for AGIs $10k-25k, 87.2% for AGIs $25k-50k, 83.1% for AGIs $50k-75k, 78.2% for AGIs $75k-100k, 42.8% for AGIs over 100k)
Taxable interest for individuals: $1,148 (reported on 23.0% of returns)
This zip code:
$1,148
Arizona:
$2,374
(% of AGI for various income ranges: 2.9% for AGIs below $10k, 0.8% for AGIs $10k-25k, 0.8% for AGIs $25k-50k, 0.8% for AGIs $50k-75k, 1.0% for AGIs $75k-100k, 2.2% for AGIs over 100k)
Taxable dividends: $2,130 (reported on 9.4% of returns)
Here:
$2,130
State:
$3,888
(% of AGI for various income ranges: 1.3% for AGIs below $10k, 0.4% for AGIs $10k-25k, 0.4% for AGIs $25k-50k, 0.5% for AGIs $50k-75k, 1.3% for AGIs $75k-100k, 3.4% for AGIs over 100k)
Net capital gain/loss: +$7,008 (reported on 7.6% of returns)
Here:
+$7,008
State:
+$17,569
(% of AGI for various income ranges: -0.6% for AGIs below $10k, 0.0% for AGIs $10k-25k, 0.5% for AGIs $25k-50k, 1.2% for AGIs $50k-75k, 2.6% for AGIs $75k-100k, 17.9% for AGIs over 100k)
Profit/loss from business: +$6,579 (reported on 10.7% of returns)
Here:
+$6,579
State:
+$11,088
(% of AGI for various income ranges: 6.1% for AGIs below $10k, 3.4% for AGIs $10k-25k, 1.9% for AGIs $25k-50k, 2.4% for AGIs $50k-75k, 2.8% for AGIs $75k-100k, 3.9% for AGIs over 100k)
IRA payment deduction: $2,094 (reported on 2.0% of returns)
85705:
$2,094
Arizona:
$3,023
(% of AGI for various income ranges: 0.1% for AGIs below $10k, 0.1% for AGIs $10k-25k, 0.2% for AGIs $25k-50k, 0.2% for AGIs $50k-75k, 0.2% for AGIs $75k-100k, 0.1% for AGIs over 100k)
Self-employed pension: $10,625 (reported on 0.1% of returns)
Here:
$10,625
Arizona:
$15,785
Total itemized deductions: $12,970 (26% of AGI, reported on 14.9% of returns)
Here:
$12,970
State:
$19,781
Here:
25.6% of AGI
State:
21.8% of AGI
(% of AGI for various income ranges: 6.4% for AGIs below $10k, 4.1% for AGIs $10k-25k, 8.0% for AGIs $25k-50k, 10.9% for AGIs $50k-75k, 12.5% for AGIs $75k-100k, 9.8% for AGIs over 100k)
Charity contributions deductions: $2,068 (4% of AGI, reported on 11.9% of returns)
Here:
$2,068
State:
$3,389
Here:
3.8% of AGI
State:
3.5% of AGI
(% of AGI for various income ranges: 0.3% for AGIs below $10k, 0.4% for AGIs $10k-25k, 0.9% for AGIs $25k-50k, 1.5% for AGIs $50k-75k, 2.0% for AGIs $75k-100k, 1.8% for AGIs over 100k)
Total tax: $2,933 (reported on 61.6% of returns)
85705:
$2,933
State:
$8,323
(% of AGI for various income ranges: 2.3% for AGIs below $10k, 3.4% for AGIs $10k-25k, 6.2% for AGIs $25k-50k, 9.2% for AGIs $50k-75k, 11.5% for AGIs $75k-100k, 19.2% for AGIs over 100k)
Earned income credit: $1,808 (reported on 28.9% of returns)
Here:
$1,808
State:
$1,786
Percentage of individuals using paid preparers for their 2004 taxes: 58.9%
Here:
59%
State:
60%
(% for various income ranges: 54.7% for AGIs below $10k, 61.4% for AGIs $10k-25k, 58.5% for AGIs $25k-50k, 58.0% for AGIs $50k-75k, 59.0% for AGIs $75k-100k, 73.2% for AGIs over 100k)
Likely homosexual households (counted as self-reported same-sex unmarried-partner households)
Lesbian couples: 0.3% of all households
Gay men: 0.3% of all households
Household received Food Stamps/SNAP in the past 12 months: 5,995 Household did not receive Food Stamps/SNAP in the past 12 months: 20,462
Women who had a birth in the past 12 months: 767 (183 now married, 561 unmarried) Women who did not have a birth in the past 12 months: 14,846 (4,062 now married, 10,857 unmarried)
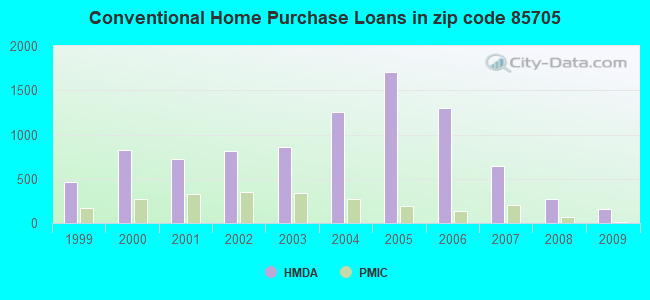
Housing units in zip code 85705 with a mortgage: 5,067 (276 second mortgage, 25 home equity loan, 170 both second mortgage and home equity loan) Houses without a mortgage: 60
Median monthly owner costs for units with a mortgage: $1,125 Median monthly owner costs for units without a mortgage: $459
Residents with income below the poverty level in 2022:
This zip code:
28.2%
Whole state:
12.5%
Residents with income below 50% of the poverty level in 2022:
This zip code:
13.1%
Whole state:
6.0%
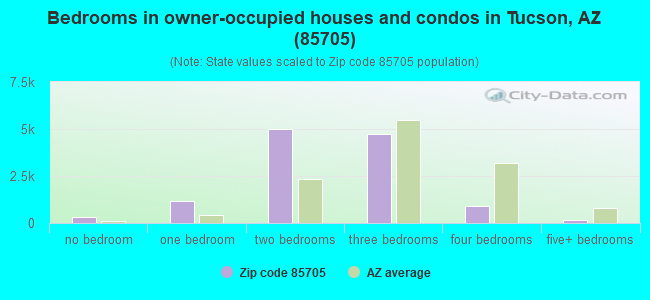
Median number of rooms in houses and condos:
Here:
4.9
State:
6.0
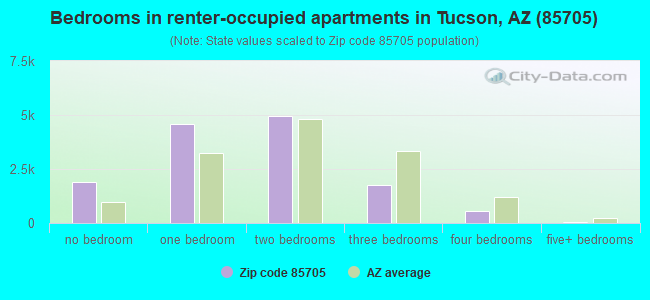
Median number of rooms in apartments:
Here:
3.5
State:
4.1
Notable locations in this zip code not listed on our city pages
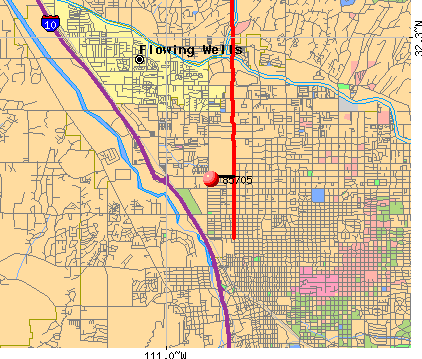
Notable locations in zip code 85705: University of Arizona Experiment Farm (A), Miracle Mile Exchange (B), Northwest Tucson Industrial Park (C), Majestic Business Park (D), North Tucson Business Center (E), Whispering Palms Recreational Vehicle Park (F), Pima County Wastewater Management Roger Road Wastewater Treatment Plant (G), Stockham Railroad Station (H), Jaynes Railroad Station (I), Pima County Public Library Woods Memorial Branch (J), Saint Luke's Home (K), The Oasis at El Corral Assisted Living Center (L), Tucson Fire Station 8 (M), Northwest Fire Station 31 (N), Petrie Railroad Station (O). Display/hide their locations on the map
Shopping Centers: Del Norte Shopping Center (1), Flowing Wells Plaza Shopping Center (2), Grantstone Shopping Center (3), Oracle Ridge Plaza Shopping Center (4), Prince Mall (5), San Juan Plaza Shopping Center (6), Tucson Mall (7), Tucson Mall Shopping Center (8), Tucson Place Shopping Center (9). Display/hide their locations on the map
Churches in zip code 85705 include: Pima Friends Meeting House (A), Phillips Chapel Christian Methodist Episcopal Church (B), Northwest Baptist Church (C), Holy Family Catholic Church (D), Flowing Wells Baptist Church (E), Flowing Wells Assembly of God (F), First Southern Baptist Church (G), Cornerstone Fellowship Church (H), Amphitheater Bible Church (I). Display/hide their locations on the map
Cemeteries: Holy Hope Cemetery and Mausoleum (1), Tucson Pioneer Cemetery (2), Evergreen Memorial Park (3), Pima County Cemetery (4). Display/hide their locations on the map
Parks in zip code 85705 include: Jacobs Park (1), Jacinto Park (2), Wetmore Park (3), Oury Park (4), Mansfield Park (5), Esteven Park (6), Francisco Elias Esquer Park (7), Catalina Park (8). Display/hide their locations on the map
Tourist attractions (not listed on the city page) : Old Pueblo Trolley Inc (Museums; 360 East 8th Street), Americana Unlimited (Cultural Attractions- Events- & Facilities; 302 West Elm Street), T Rex Museum of Dinosaurs (Cultural Attractions- Events- & Facilities; 1202 North Main Avenue), Funtasticks Family Fun Park (Amusement & Theme Parks; 221 East Wetmore Road), Fourth Avenue Merchants Association - Fair Information (329 East 7th Street), Southern Arizona Balloon Excursions (537 West Grant Road), T'S Piggy Banks (1310 West Roger Road), Tucson Symphony Box Office (2175 North 6th Avenue), Allstate Transportation Service (Tours & Charters; 4001 North Runway Drive Suite 151).
4,116 married couples with children.
4,642 single-parent households (1,581 men, 3,061 women).
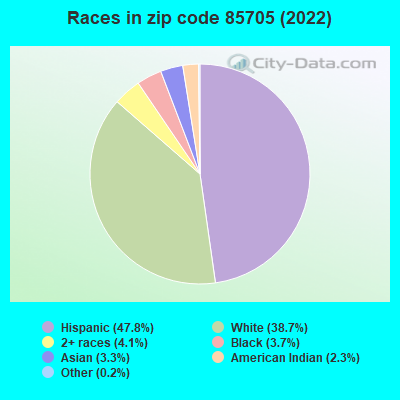
62.7% of residents of 85705 zip code speak English at home.
32.4% of residents speak Spanish at home (63% very well, 15% well, 13% not well, 9% not at all).
1.2% of residents speak other Indo-European language at home (63% very well, 11% well, 18% not well, 8% not at all).
2.7% of residents speak Asian or Pacific Island language at home (54% very well, 31% well, 10% not well, 5% not at all).
1.0% of residents speak other language at home (44% very well, 38% well, 13% not well, 5% not at all).
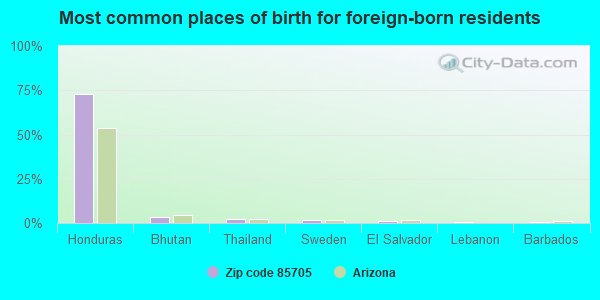
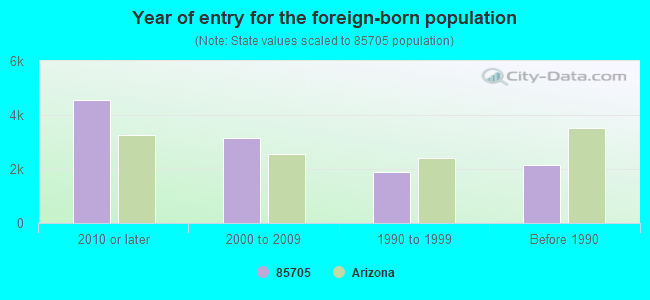
Foreign born population: 10,471 (18.1%) (33.0% of them are naturalized citizens)
Major facilities with environmental interests located in this zip code:
ADOT - TUCSON (1444 W GRANT RD in TUCSON, AZ)
STATE MASTER (Arizona's Tracking Of The Environment) - AZURITE-5918, LEAKING STORAGE TANK, UNDERGROUND STORAGE TANK PROGRAM, AIR PROGRAM (Resource Conservation and Recovery Act (tracking hazardous waste)) Business NAICS classification: AIR TRAFFIC CONTROL. Organizations: ARIZONA DEPARTMENT OF TRANSPORTATION - TUCSON (CONTACT/GENERAL)
, AZ DEPT OF TRANSPORT (CONTACT/OWNER)
Alternative names: ADOT EQUIPMENT SVCS SECTION, ADOT MATERIALS TESTING LAB, ARIZONA DEPARTMENT OF TRANSPORTATION
HARVEY TRUCKING (2435 W CURTIS RD in TUCSON, AZ)
STATE MASTER (Arizona's Tracking Of The Environment) - AZURITE-6361, GROUND WATER PROGRAM, SURFACE WATER STANDARDS, AIR PROGRAM (Resource Conservation and Recovery Act (tracking hazardous waste)) Business NAICS classification: GENERAL AUTOMOTIVE REPAIR. Organizations: HARVEY TRUCKING INC (CONTACT/GENERAL)
, REGINA HARVEY (CONTACT/OWNER)
HOLMES TUTTLE FORD (660 W AUTO MALL DRIVE in TUCSON, AZ)
STATE MASTER (Arizona's Tracking Of The Environment) - AZURITE-8090, AIR PROGRAM Small Quantity Generators, between 100 kg and 1000 kg of hazardous waste/month (Resource Conservation and Recovery Act (tracking hazardous waste)) - notification Organizations: ROBERT & DONNA TUTTLE (CONTACT/OWNER)
DON MACKEY OLDSMOBILE-CADILLAC-GMC (815 W AUTO MALL DR in TUCSON, AZ)
STATE MASTER (Arizona's Tracking Of The Environment) - AZURITE-13875, AIR PROGRAM Small Quantity Generators, between 100 kg and 1000 kg of hazardous waste/month (Resource Conservation and Recovery Act (tracking hazardous waste)) - notification Organizations: DONALD MACKEY (CONTACT/OWNER)
Alternative names: DON MACKEY OLDS CADILLAC INC
HART & COOLEY INC (2620 NORTH FLOWING WELLS ROAD in TUCSON, AZ)
AIR MAJOR (AIRS/AFS) COMPLIANCE ACTIVITY (Tracking inspections of insecticide, fungicide, and rodenticide, and toxic substances) CRITERIA AND HAZARDOUS AIR POLLUTANT INVENTORY (Inventory of air pollution sources) Conditionally Exempt Small Quantity Generators, less than 100 kg/month of hazardous waste (Resource Conservation and Recovery Act (tracking hazardous waste)) - notification Conditionally Exempt Small Quantity Generators, less than 100 kg/month of hazardous waste (Resource Conservation and Recovery Act (tracking hazardous waste)) TRI REPORTER (Tracking of toxic chemicals releasing facilities) Business SIC classification: SHEET METALWORK; FABRICATED METAL PRODUCTS Business NAICS classification: ALL OTHER MISCELLANEOUS FABRICATED METAL PRODUCT MANUFACTURING. Organizations: KRUEGER MFG CO (CONTACT/OWNER)
, TOMKINS INDUSTRIES INC (CONTACT/OWNER)
Alternative names: AIR SYSTEM COMPONENTS, AIR SYSTEM COMPONENTS LIMITED PARTNERSHIP, AIR SYSTEM COMPONENTS L P, AIR SYSTEM DIVISION TOMPKINS CORP
AMPHITHEATER HIGH SCHOOL (125 W YAVAPAI ROAD in TUCSON, AZ)
(Geographic Names Information System) (National Center for Education Statistics) - STATE ID-281 Organizations: AMPHITHEATER UNIFIED DISTRICT (SCHOOL DISTRICT)
FLOWING WELLS HIGH SCHOOL (3725 N FLOWING WELLS RD in TUCSON, AZ)
(Geographic Names Information System) (National Center for Education Statistics) - STATE ID-210 Organizations: FLOWING WELLS UNIFIED DISTRICT (SCHOOL DISTRICT)
ACADEMY OF MATH AND SCIENCE (1557 W. PRINCE RD. in TUCSON, AZ)
(National Center for Education Statistics) - STATE ID-101 Organizations: ACADEMY OF MATH AND SCIENCE, INC. (SCHOOL DISTRICT)
AMPHITHEATER MIDDLE SCHOOL (315 E PRINCE RD in TUCSON, AZ)
(National Center for Education Statistics) - STATE ID-166 Organizations: AMPHITHEATER UNIFIED DISTRICT (SCHOOL DISTRICT)
HELEN KEELING ELEMENTARY SCHOOL (2837 NORTH LOS ALTOS in TUCSON, AZ)
(National Center for Education Statistics) - STATE ID-109 Organizations: AMPHITHEATER UNIFIED DISTRICT (SCHOOL DISTRICT)
AT RISK TELETEACHING HIGH SCHOOL (400 N 2ND AVENUE in TUCSON, AZ)
(National Center for Education Statistics) - STATE ID-679 Organizations: TUCSON UNIFIED DISTRICT (SCHOOL DISTRICT)
AT RISK TELETEACHING MIDDLE SCHOOL (400 N 2ND STREET in TUCSON, AZ)
(National Center for Education Statistics) - STATE ID-581 Organizations: TUCSON UNIFIED DISTRICT (SCHOOL DISTRICT)
ALTERNATIVE COMPUTERIZED EDUCATION (ACE) CHARTER H (1929 N. STONE in TUCSON, AZ)
(National Center for Education Statistics) - STATE ID-201 Organizations: TUCSON YOUTH DEVELOPMENT/ACE CHARTER HIGH SCHOOL (SCHOOL DISTRICT)
Housing units lacking complete plumbing facilities: 2.1% Housing units lacking complete kitchen facilities: 3.3%
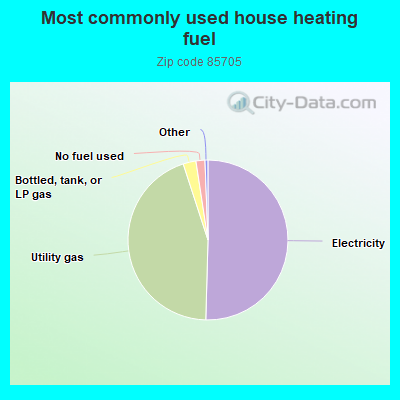
50.4%Electricity
44.5%Utility gas
2.6%Bottled, tank, or LP gas
1.8%No fuel used
Population in 1990: 52,751. Population change in the 1990s: +2,448 (+4.6%).
Place of birth for U.S.-born residents:
This state: 26,305
Northeast: 2,811
Midwest: 6,557
South: 3,571
West: 7,158
41% of the 85705 zip code residents lived in the same house 5 years ago. Out of people who lived in different houses, 69% lived in this county. Out of people who lived in different counties, 50% lived in Arizona.
81% of the 85705 zip code residents lived in the same house 1 year ago. Out of people who lived in different houses, 57% moved from this county. Out of people who lived in different houses, 16% moved from different county within same state. Out of people who lived in different houses, 15% moved from different state. Out of people who lived in different houses, 6% moved from abroad.
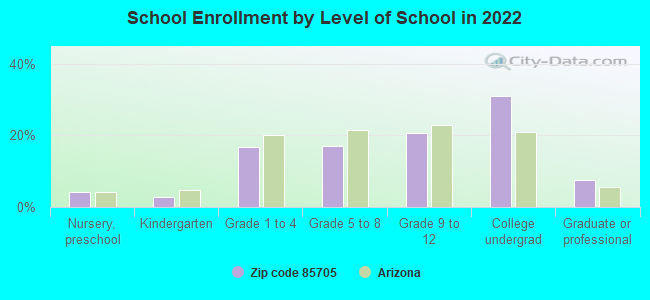
Private vs. public school enrollment:
Students in private schools in grades 1 to 8 (elementary and middle school): 391
Here:
7.9%
Arizona:
10.4%
Students in private schools in grades 9 to 12 (high school): 239
Here:
7.9%
Arizona:
8.8%
Students in private undergraduate colleges: 470
Here:
10.4%
Arizona:
13.1%
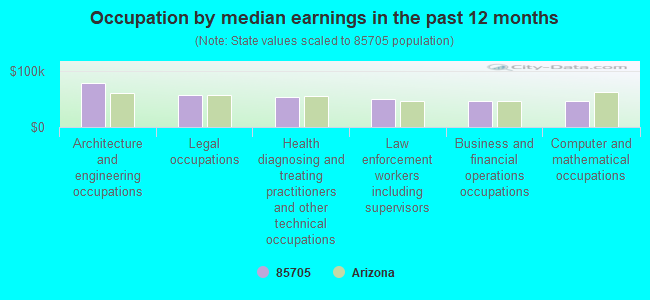
Occupation by median earnings in the past 12 months ($)
78,458Architecture and engineering occupations
56,258Legal occupations
53,319Health diagnosing and treating practitioners and other technical occupations
49,616Law enforcement workers including supervisors
46,500Business and financial operations occupations
45,913Computer and mathematical occupations
Companies with biggest federal contracts located in this zip code (TUCSON, AZ):
AMERICAN TURBO SYSTEMS, INC (4210 N SULLINGER AVE; small business) : $7,542,512 in 24 contractsfrom 2000 to 2006
Contracts for Air Conditioning Equipment, Gas Turbines and Jet Engines, Non-Aircraft; and Components, Maintenance, Repair and Rebuilding of Equipment -- Engines, Turbines, and Components, Maintenance, Repair and Rebuilding of Equipment -- Refrigeration, Air Conditioning, and Air Circulating Equipment, and moreby Air Force, Army, Defense Logistics Agency Signed by year:2000: $30,625; 2001: $109,916; 2002: $32,000; 2003: $0; 2004: $6,901,947; 2005: $341,054; 2006: $126,970.
Biggest contracts:
$6,611,725 with Air Force for Air Conditioning Equipment. Signed on 2004-05-24. Completion date: 2004-05-24.
$232,050 with Army for Gas Turbines and Jet Engines, Non-Aircraft; and Components. Signed on 2004-07-22. Completion date: 2006-05-30.
$150,000 with Air Force for Maintenance, Repair and Rebuilding of Equipment -- Engines, Turbines, and Components. Signed on 2005-01-05. Completion date: 2005-05-10.
$96,500 with Air Force for Maintenance, Repair and Rebuilding of Equipment -- Refrigeration, Air Conditioning, and Air Circulating Equipment. Signed on 2005-02-22. Completion date: 2009-02-28.
R E DARLING CO INC (3749 N ROMERO RD; small business) : $5,222,806 in 147 contractsfrom 1999 to 2006
Contracts for Hose and Flexible Tubing, Aircraft Air Conditioning, Heating, and Pressurizing Equipment, Miscellaneous Items, Engineering and Technical Services, and moreby Defense Logistics Agency, Navy, Air Force, NASA, and others Signed by year:2000: $637,804; 2001: $777,307; 2002: $572,268; 2003: $428,225; 2004: $826,662; 2005: $1,428,950; 2006: $516,186.
Biggest contracts:
$289,920 with Defense Logistics Agency for Hose and Flexible Tubing. Signed on 2000-09-25. Completion date: 2001-03-24.
$246,300, same as above.Signed on 2005-08-19. Completion date: 2006-01-16.
$234,773, same as above.Signed on 2005-07-22. Completion date: 2006-05-20.
$213,000, same as above.Signed on 2005-10-07. Completion date: 2006-09-30.
SOUTHWEST ENERGY SOLUTIONS (2450 N FLOWING WELLS ROAD; small business) : $1,047,853 in 2 contractsfrom 2001 to 2002
$1,044,000 with Indian Affairs (Assistant Secretary) for Lumber and Related Basic Wood Materials. Signed on 2001-01-15. Completion date: 2001-03-15.
$3,853 with Army for Construction of Structures and Facilities -- Other Non-Building Facilities. Signed on 2002-05-20. Completion date: 2002-05-03.
PRECISION SOUTHWEST MFG (3755 N ROMERO RD; small business) 50 employees, $0 revenue: $857,565 in 22 contractsfrom 2000 to 2006
Contracts for Hardware, Commercial, Gas Turbines and Jet Engines, Aircraft; Prime Moving, and Components, Airframe Structural Components by Air Force, Defense Logistics Agency Signed by year:2000: $91,929; 2001: $168,276; 2002: $230,920; 2003: $0; 2004: $145,960; 2005: $142,600; 2006: $77,880.
Biggest contracts:
$189,880 with Air Force for Hardware, Commercial. Signed on 2002-04-16. Completion date: 2002-10-11.
$73,800 with Defense Logistics Agency for Gas Turbines and Jet Engines, Aircraft; Prime Moving, and Components. Signed on 2006-03-13. Completion date: 2006-10-09.
$66,065 with Air Force for Hardware, Commercial. Signed on 2005-09-08. Completion date: 2006-05-31.
$63,921 with Defense Logistics Agency for Airframe Structural Components. Signed on 2001-01-23. Completion date: 2001-07-22.
G R O ENTERPRISES, INC (44 W SAHUARO ST; small business) : $263,099 in 4 contractsfrom 2001 to 2006
$203,465 with Army for Maintenance, Repair or Alteration of Real Property -- Heating and Cooling Plants. Signed on 2001-09-30. Completion date: 2002-09-29.
$34,505 with Department of Veterans Affairs for Other Housekeeping Services. Signed on 2003-09-15. Completion date: 2004-07-15.
$14,583 with Air Force for Maintenance, Repair and Rebuilding of Equipment -- Refrigeration, Air Conditioning, and Air Circulating Equipment. Signed on 2006-03-01. Completion date: 2006-04-03.
$10,546 with Army for Maintenance, Repair or Alteration of Real Property -- Heating and Cooling Plants. Signed on 2001-11-05. Completion date: 2002-09-29.
NEFF RENTAL, INC (2819 W RUTHRAUFF RD; small business) : $256,298 in 5 contractsfrom 2005 to 2006
Contracts for Lease or Rental of Equipment -- Construction, Mining, Excavating, and Highway Maintenance Equipment by Army Signed by year:2000: $0; 2001: $0; 2002: $0; 2003: $0; 2004: $0; 2005: $52,230; 2006: $204,068.
Biggest contracts:
$136,110 with Army for Lease or Rental of Equipment -- Construction, Mining, Excavating, and Highway Maintenance Equipment. Signed on 2006-04-24. Completion date: 2006-12-18.
$52,230, same as above.Signed on 2005-12-20. Completion date: 2006-06-08.
$35,813, same as above.Signed on 2006-05-17. Completion date: 2006-12-18.
$28,665, same as above.Signed on 2006-06-02. Completion date: 2006-12-18.
GRO ENTERPRISES, INC (44 W SAHUARO STREET; small business) : $213,272 in 8 contractsfrom 2002 to 2005
Contracts for Facilities Operations Support Services, Custodial Janitorial Services, Other Housekeeping Services by Department of Veterans Affairs, Air Force Signed by year:2000: $0; 2001: $0; 2002: $21,760; 2003: $185,679; 2004: $6,489; 2005: -$656; 2006: $0.
Biggest contracts:
$157,224 with Department of Veterans Affairs for Facilities Operations Support Services. Taking place in CO. Signed on 2003-09-15. Completion date: 2004-01-15.
$21,414 with Air Force for Custodial Janitorial Services. Signed on 2003-10-01. Completion date: 2004-09-30.
$15,100, same as above.Signed on 2002-10-01. Completion date: 2003-09-30.
$7,989 with Air Force for Other Housekeeping Services. Signed on 2004-11-29. Completion date: 2004-12-20.
THE BEE WORKS (1870 WEST PRINCE ROAD SUIT; small business) : $175,000 in 10 contractsfrom 2003 to 2005
Contracts for Other Special Studies and Analyses, Endangered Species Studies - Plant and Animal by Army, Bureau of Land Management Signed by year:2000: $0; 2001: $0; 2002: $0; 2003: $75,000; 2004: $50,000; 2005: $50,000; 2006: $0.
Biggest contracts:
$50,000 with Army for Other Special Studies and Analyses. Taking place in NM. Signed on 2005-04-28. Completion date: 2003-12-31.
$50,000, same as above.Signed on 2003-12-10. Completion date: 2003-12-31.
$25,000, same as above.Signed on 2004-12-21. Completion date: 2003-12-31.
$25,000, same as above.Signed on 2004-04-21. Completion date: 2003-12-31.
D METRIX INC (1141 W GRANT RD STE 100; small business)
$168,000 with Army for Medical and Surgical Instruments, Equipment, and Supplies. Signed on 2005-09-22. Completion date: 2005-10-10.
ABRAMS AIRBORNE MANUFACTURING, (3735 N ROMERO RD; small business) : $118,004 in 4 contractsin 2005
$78,717 with Navy for Assemblies Interchangeable Between Weapons in Two or More Classes. Signed on 2005-07-28. Completion date: 2005-09-30.
$20,546, same as above.Signed on 2005-05-10. Completion date: 2005-07-29.
$18,744, same as above.Signed on 2005-03-30. Completion date: 2005-06-15.
-$3, same as above.Signed on 2005-10-21. Completion date: 2005-09-30.
Top industries in this zip code by the number of employees in 2005:
2003 - 2018 National Fire Incident Reporting System (NFIRS) incidents
Based on the data from the years 2003 - 2018 the average number of fire incidents per year is 137. The highest number of fire incidents - 322 took place in 2018, and the least - 1 in 2008. The data has a rising trend.
When looking into fire subcategories, the most incidents belonged to: Outside Fires (51.5%), and Structure Fires (30.1%).
Fire incident types reported to NFIRS in Zip Code 85705
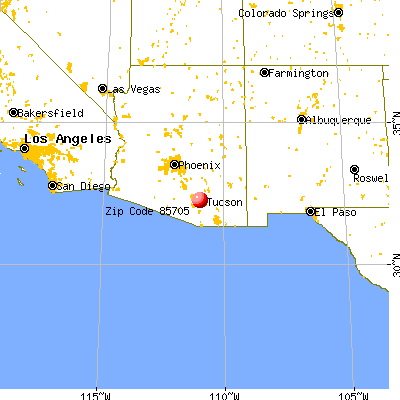


 Nearest zip codes: 85719, 85724, 85701, 85704, 85716, 85713.
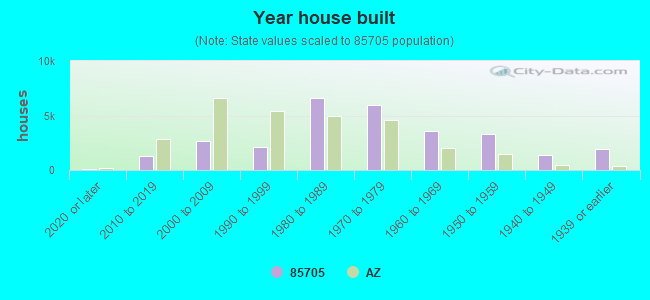


 Based on the data from the years 2003 - 2018 the average number of fire incidents per year is 137. The highest number of fire incidents - 322 took place in 2018, and the least - 1 in 2008. The data has a rising trend.
 When looking into fire subcategories, the most incidents belonged to: Outside Fires (51.5%), and Structure Fires (30.1%).