Estimated zip code population in 2022: 19,993 Zip code population in 2010: 22,517 Zip code population in 2000: 20,673
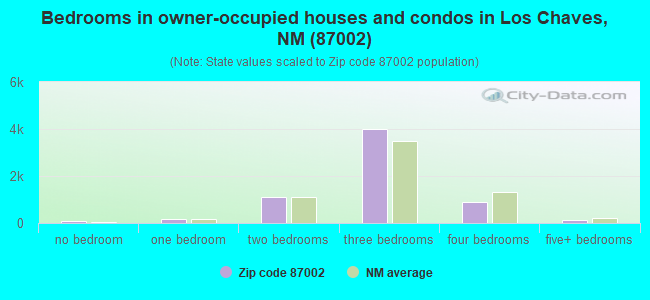
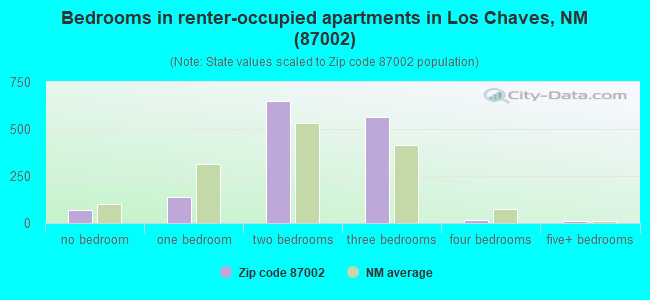
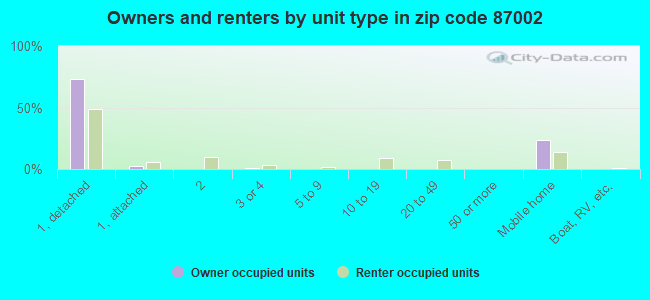
Houses and condos: 9,082 Renter-occupied apartments: 1,457
% of renters here:
19%
State:
29%
March 2022 cost of living index in zip code 87002: 91.9 (less than average, U.S. average is 100)
Land area: 344.4 sq. mi. Water area: 0.6 sq. mi.
Population density: 58 people per square mile
(very low).
OSM Map
General Map
Google Map
MSN Map
OSM Map
General Map
Google Map
MSN Map
OSM Map
General Map
Google Map
MSN Map
OSM Map
General Map
Google Map
MSN Map
Please wait while loading the map...
Real estate property taxes paid for housing units in 2022:
This zip code:
0.6% ($1,091)
New Mexico:
0.7% ($1,638)
Median real estate property taxes paid for housing units with mortgages in 2022: $1,206 (0.6%) Median real estate property taxes paid for housing units with no mortgage in 2022: $943 (0.7%)
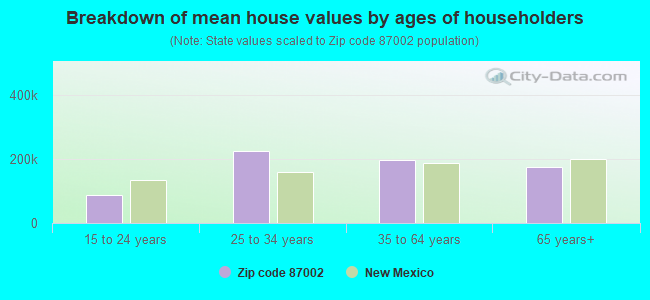
Estimated median house/condo value in 2022: $171,521
87002:
$171,521
New Mexico:
$243,100
According to our research of New Mexico and other state lists, there were 29 registered sex offenders living in 87002 zip code as of April 27, 2024. The ratio of all residents to sex offenders in zip code 87002 is 758 to 1. The ratio of registered sex offenders to all residents in this zip code is near the state average.
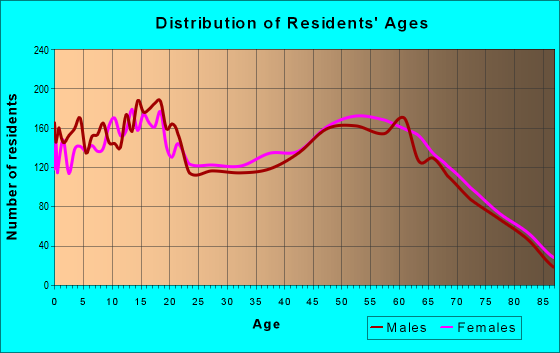
Median resident age:
This zip code:
48.4 years
New Mexico median age:
39.4 years
Average household size:
This zip code:
2.6 people
New Mexico:
2.4 people
Averages for the 2020 tax year for zip code 87002, filed in 2021:
Average Adjusted Gross Income (AGI) in 2020: $44,646 (Individual Income Tax Returns)
Here:
$44,646
State:
$59,146
Salary/wage: $39,182 (reported on 77.1% of returns)
Here:
$39,182
State:
$48,327
(% of AGI for various income ranges: 1101.7% for AGIs below $25k, 3435.0% for AGIs $25k-50k, 6278.2% for AGIs $50k-75k, 9160.2% for AGIs $75k-100k, 16034.2% for AGIs $100k-200k, 41730.0% for AGIs over 200k)
Taxable interest for individuals: $1,300 (reported on 24.5% of returns)
This zip code:
$1,300
New Mexico:
$1,616
(% of AGI for various income ranges: 13.3% for AGIs below $25k, 19.9% for AGIs $25k-50k, 50.1% for AGIs $50k-75k, 68.3% for AGIs $75k-100k, 219.7% for AGIs $100k-200k, 1570.0% for AGIs over 200k)
Ordinary dividends: $4,400 (reported on 8.7% of returns)
Here:
$4,400
State:
$7,816
(% of AGI for various income ranges: 11.4% for AGIs below $25k, 15.0% for AGIs $25k-50k, 39.9% for AGIs $50k-75k, 46.9% for AGIs $75k-100k, 367.0% for AGIs $100k-200k, 2550.0% for AGIs over 200k)
Net capital gain/loss in AGI: +$12,129 (reported on 7.8% of returns)
Here:
+$12,129
State:
+$19,595
(% of AGI for various income ranges: 1.6% for AGIs below $25k, 16.0% for AGIs $25k-50k, 91.4% for AGIs $50k-75k, 115.2% for AGIs $75k-100k, 479.0% for AGIs $100k-200k, 16080.0% for AGIs over 200k)
Profit/loss from business: +$9,409 (reported on 10.8% of returns)
Here:
+$9,409
State:
+$11,430
(% of AGI for various income ranges: 73.5% for AGIs below $25k, 68.8% for AGIs $25k-50k, 120.5% for AGIs $50k-75k, 224.0% for AGIs $75k-100k, 910.8% for AGIs $100k-200k)
Taxable individual retirement arrangement distribution: $15,375 (reported on 6.2% of returns)
87002:
$15,375
New Mexico:
$20,970
(% of AGI for various income ranges: 34.9% for AGIs below $25k, 42.5% for AGIs $25k-50k, 142.0% for AGIs $50k-75k, 323.8% for AGIs $75k-100k, 1015.8% for AGIs $100k-200k)
Total itemized deductions: $29,150 (reported on 3.1% of returns)
Here:
$29,150
State:
$33,187
(% of AGI for various income ranges: 19.0% for AGIs below $25k, 60.3% for AGIs $25k-50k, 198.6% for AGIs $50k-75k, 270.2% for AGIs $75k-100k, 677.2% for AGIs $100k-200k, 2953.3% for AGIs over 200k)
Charity contributions: $7,705 (reported on 2.4% of returns)
Here:
$7,705
State:
$11,850
(% of AGI for various income ranges: 8.2% for AGIs $25k-50k, 31.2% for AGIs $50k-75k, 50.5% for AGIs $75k-100k, 244.0% for AGIs $100k-200k)
Taxes paid: $5,556 (reported on 3.0% of returns)
87002:
$5,556
State:
$7,150
(% of AGI for various income ranges: 1.6% for AGIs below $25k, 8.8% for AGIs $25k-50k, 31.1% for AGIs $50k-75k, 46.9% for AGIs $75k-100k, 150.0% for AGIs $100k-200k, 723.3% for AGIs over 200k)
Earned income credit: $2,391 (reported on 23.5% of returns)
Here:
$2,391
State:
$2,323
(% of AGI for various income ranges: 117.1% for AGIs below $25k, 86.0% for AGIs $25k-50k, 1.9% for AGIs $50k-75k)
Percentage of individuals using paid preparers for their 2020 taxes: 92.4%
Here:
92%
State:
92%
(% for various income ranges: 92.6% for AGIs below $25k, 93.0% for AGIs $25k-50k, 92.7% for AGIs $50k-75k, 88.9% for AGIs $75k-100k, 91.9% for AGIs $100k-200k, 88.9% for AGIs over 200k)
Averages for the 2012 tax year for zip code 87002, filed in 2013:
Average Adjusted Gross Income (AGI) in 2012: $39,253 (Individual Income Tax Returns)
Here:
$39,253
State:
$50,343
Salary/wage: $34,030 (reported on 77.7% of returns)
Here:
$34,030
State:
$41,171
(% of AGI for various income ranges: 69.7% for AGIs below $25k, 73.2% for AGIs $25k-50k, 68.8% for AGIs $50k-75k, 70.9% for AGIs $75k-100k, 68.1% for AGIs $100k-200k, 29.5% for AGIs over 200k)
Taxable interest for individuals: $1,639 (reported on 28.2% of returns)
This zip code:
$1,639
New Mexico:
$1,677
(% of AGI for various income ranges: 1.4% for AGIs below $25k, 0.8% for AGIs $25k-50k, 0.7% for AGIs $50k-75k, 0.8% for AGIs $75k-100k, 1.4% for AGIs $100k-200k, 3.6% for AGIs over 200k)
Ordinary dividends: $4,529 (reported on 11.3% of returns)
Here:
$4,529
State:
$6,939
(% of AGI for various income ranges: 1.0% for AGIs below $25k, 0.6% for AGIs $25k-50k, 0.8% for AGIs $50k-75k, 0.8% for AGIs $75k-100k, 1.6% for AGIs $100k-200k, 6.0% for AGIs over 200k)
Net capital gain/loss in AGI: +$10,872 (reported on 9.4% of returns)
Here:
+$10,872
State:
+$14,311
(% of AGI for various income ranges: 0.3% for AGIs below $25k, 0.2% for AGIs $25k-50k, 0.4% for AGIs $50k-75k, 0.8% for AGIs $75k-100k, 2.2% for AGIs $100k-200k, 26.6% for AGIs over 200k)
Profit/loss from business: +$8,005 (reported on 11.6% of returns)
Here:
+$8,005
State:
+$11,059
(% of AGI for various income ranges: 5.0% for AGIs below $25k, 1.6% for AGIs $25k-50k, 0.6% for AGIs $50k-75k, 1.2% for AGIs $75k-100k, 5.1% for AGIs $100k-200k)
Taxable individual retirement arrangement distribution: $11,566 (reported on 8.1% of returns)
87002:
$11,566
New Mexico:
$15,706
(% of AGI for various income ranges: 2.4% for AGIs below $25k, 1.9% for AGIs $25k-50k, 2.1% for AGIs $50k-75k, 2.4% for AGIs $75k-100k, 4.2% for AGIs $100k-200k)
Total itemized deductions: $18,284 (24% of AGI, reported on 21.8% of returns)
Here:
$18,284
State:
$21,709
Here:
23.8% of AGI
State:
19.8% of AGI
(% of AGI for various income ranges: 5.7% for AGIs below $25k, 8.1% for AGIs $25k-50k, 11.4% for AGIs $50k-75k, 11.9% for AGIs $75k-100k, 13.9% for AGIs $100k-200k, 9.4% for AGIs over 200k)
Charity contributions: $3,203 (reported on 16.4% of returns)
Here:
$3,203
State:
$4,195
(% of AGI for various income ranges: 0.5% for AGIs below $25k, 0.8% for AGIs $25k-50k, 1.5% for AGIs $50k-75k, 1.7% for AGIs $75k-100k, 2.2% for AGIs $100k-200k, 1.6% for AGIs over 200k)
Taxes paid: $4,329 (reported on 21.4% of returns)
87002:
$4,329
State:
$6,176
(% of AGI for various income ranges: 0.8% for AGIs below $25k, 1.3% for AGIs $25k-50k, 2.3% for AGIs $50k-75k, 2.8% for AGIs $75k-100k, 4.0% for AGIs $100k-200k, 3.9% for AGIs over 200k)
Earned income credit: $2,408 (reported on 26.3% of returns)
Here:
$2,408
State:
$2,311
(% of AGI for various income ranges: 8.5% for AGIs below $25k, 1.4% for AGIs $25k-50k)
Percentage of individuals using paid preparers for their 2012 taxes: 47.8%
Here:
48%
State:
50%
(% for various income ranges: 45.3% for AGIs below $25k, 48.4% for AGIs $25k-50k, 47.0% for AGIs $50k-75k, 52.6% for AGIs $75k-100k, 56.8% for AGIs $100k-200k, 83.3% for AGIs over 200k)
Averages for the 2004 tax year for zip code 87002, filed in 2005:
Average Adjusted Gross Income (AGI) in 2004: $32,919 (Individual Income Tax Returns)
Here:
$32,919
State:
$39,572
Salary/wage: $30,253 (reported on 81.2% of returns)
Here:
$30,253
State:
$34,237
(% of AGI for various income ranges: 135.4% for AGIs below $10k, 74.3% for AGIs $10k-25k, 77.8% for AGIs $25k-50k, 79.3% for AGIs $50k-75k, 76.0% for AGIs $75k-100k, 53.6% for AGIs over 100k)
Taxable interest for individuals: $2,001 (reported on 34.0% of returns)
This zip code:
$2,001
New Mexico:
$1,873
(% of AGI for various income ranges: 8.3% for AGIs below $10k, 2.1% for AGIs $10k-25k, 1.6% for AGIs $25k-50k, 1.3% for AGIs $50k-75k, 1.5% for AGIs $75k-100k, 3.7% for AGIs over 100k)
Taxable dividends: $2,695 (reported on 15.0% of returns)
Here:
$2,695
State:
$3,554
(% of AGI for various income ranges: 3.6% for AGIs below $10k, 0.7% for AGIs $10k-25k, 0.5% for AGIs $25k-50k, 0.7% for AGIs $50k-75k, 1.1% for AGIs $75k-100k, 3.6% for AGIs over 100k)
Net capital gain/loss: +$5,544 (reported on 13.5% of returns)
Here:
+$5,544
State:
+$10,425
(% of AGI for various income ranges: 2.3% for AGIs below $10k, 0.2% for AGIs $10k-25k, 0.7% for AGIs $25k-50k, 0.7% for AGIs $50k-75k, 1.7% for AGIs $75k-100k, 10.0% for AGIs over 100k)
Profit/loss from business: +$6,424 (reported on 12.6% of returns)
Here:
+$6,424
State:
+$8,875
(% of AGI for various income ranges: 4.6% for AGIs below $10k, 3.0% for AGIs $10k-25k, 2.0% for AGIs $25k-50k, 1.6% for AGIs $50k-75k, 0.5% for AGIs $75k-100k, 5.2% for AGIs over 100k)
IRA payment deduction: $2,785 (reported on 2.0% of returns)
87002:
$2,785
New Mexico:
$2,940
(% of AGI for various income ranges: 0.2% for AGIs $10k-25k, 0.2% for AGIs $25k-50k, 0.2% for AGIs $50k-75k, 0.1% for AGIs $75k-100k, 0.1% for AGIs over 100k)
Self-employed pension: $11,417 (reported on 0.2% of returns)
Here:
$11,417
New Mexico:
$13,110
Total itemized deductions: $15,503 (25% of AGI, reported on 24.6% of returns)
Here:
$15,503
State:
$18,103
Here:
25.5% of AGI
State:
21.5% of AGI
(% of AGI for various income ranges: 15.3% for AGIs below $10k, 7.3% for AGIs $10k-25k, 10.1% for AGIs $25k-50k, 12.3% for AGIs $50k-75k, 15.0% for AGIs $75k-100k, 14.0% for AGIs over 100k)
Charity contributions deductions: $2,401 (4% of AGI, reported on 20.1% of returns)
Here:
$2,401
State:
$3,246
Here:
3.7% of AGI
State:
3.6% of AGI
(% of AGI for various income ranges: 0.6% for AGIs below $10k, 0.8% for AGIs $10k-25k, 1.3% for AGIs $25k-50k, 1.4% for AGIs $50k-75k, 2.0% for AGIs $75k-100k, 2.1% for AGIs over 100k)
Total tax: $3,984 (reported on 68.4% of returns)
87002:
$3,984
State:
$6,237
(% of AGI for various income ranges: 3.9% for AGIs below $10k, 3.3% for AGIs $10k-25k, 5.9% for AGIs $25k-50k, 8.3% for AGIs $50k-75k, 10.4% for AGIs $75k-100k, 16.3% for AGIs over 100k)
Earned income credit: $1,759 (reported on 23.6% of returns)
Here:
$1,759
State:
$1,796
Percentage of individuals using paid preparers for their 2004 taxes: 59.4%
Here:
59%
State:
57%
(% for various income ranges: 57.2% for AGIs below $10k, 61.4% for AGIs $10k-25k, 57.8% for AGIs $25k-50k, 57.9% for AGIs $50k-75k, 58.8% for AGIs $75k-100k, 75.7% for AGIs over 100k)
Likely homosexual households (counted as self-reported same-sex unmarried-partner households)
Lesbian couples: 0.0% of all households
Gay men: 0.1% of all households
Household received Food Stamps/SNAP in the past 12 months: 1,728 Household did not receive Food Stamps/SNAP in the past 12 months: 6,031
Women who had a birth in the past 12 months: 339 (164 now married, 152 unmarried) Women who did not have a birth in the past 12 months: 3,810 (1,355 now married, 2,456 unmarried)
Housing units in zip code 87002 with a mortgage: 2,835 (225 second mortgage, 55 home equity loan, 125 both second mortgage and home equity loan) Houses without a mortgage: 64
Median monthly owner costs for units with a mortgage: $1,088 Median monthly owner costs for units without a mortgage: $371
Residents with income below the poverty level in 2022:
This zip code:
17.8%
Whole state:
17.6%
Residents with income below 50% of the poverty level in 2022:
This zip code:
8.1%
Whole state:
9.7%
Median number of rooms in houses and condos:
Here:
6.0
State:
5.9
Median number of rooms in apartments:
Here:
4.5
State:
4.2
Notable locations in this zip code not listed on our city pages
In group quarters: 125 (-1 institutionalized population)
Size of family households: 2,678 2-persons, 937 3-persons, 886 4-persons, 227 5-persons, 192 6-persons, 85 7-or-more-persons
Size of nonfamily households: 2,359 1-person, 359 2-persons, 14 4-persons
1,254 married couples with children.
1,013 single-parent households (312 men, 701 women).
74.2% of residents of 87002 zip code speak English at home.
25.8% of residents speak Spanish at home (75% very well, 18% well, 7% not well, 1% not at all).
0.6% of residents speak other Indo-European language at home (54% very well, 46% well).
1.1% of residents speak Asian or Pacific Island language at home (95% very well, 5% well).
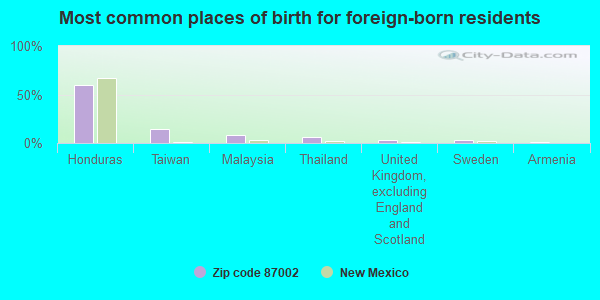
Foreign born population: 1,655 (8.3%) (41.2% of them are naturalized citizens)
This zip code:
8.3%
Whole state:
9.3%
60%Honduras
15%Taiwan
8%Malaysia
6%Thailand
3%United Kingdom, excluding England and Scotland
3%Sweden
1%Armenia
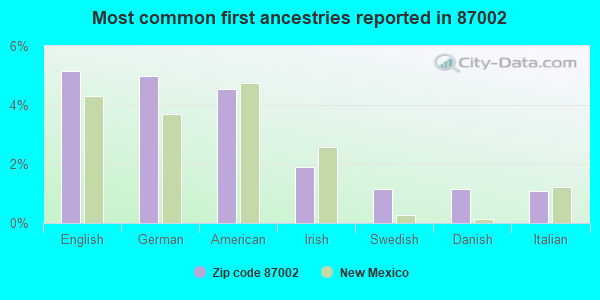
5%English
5%German
5%American
2%Irish
1%Swedish
1%Danish
1%Italian
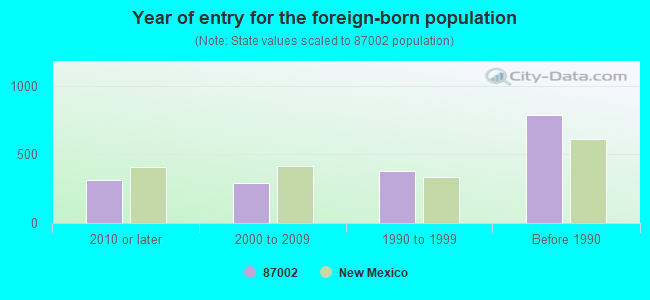
Year of entry for the foreign-born population
3162010 or later
2892000 to 2009
3771990 to 1999
788Before 1990
Major facilities with environmental interests located in this zip code:
FRANK'S SEPTIC (LOCATED-P&R LIQUID WASTE DISP. in VALENCIA COUNTY, NM)
National Pollutant Discharge Elimination System NON-MAJOR (Tracking pollutant discharge elimination systems) - permit - ICIS-, ENFORCEMENT/COMPLIANCE ACTIVITY National Pollutant Discharge Elimination System NON-MAJOR (Tracking pollutant discharge elimination systems) - permit - ICIS-, ENFORCEMENT/COMPLIANCE ACTIVITY Alternative names: A & A PUMPING, MR. LORENZO ROMERO, MR. TONY PADILLA
BELEN WWTP, CITY OF (1300 CONSERVICY ROAD in BELEN, NM)
(Integrated Compliance Information System) - ICIS-06-1997-0831, FORMAL ENFORCEMENT ACTION, ICIS-06-1999-0904, ICIS-06-2000-0275, National Pollutant Discharge Elimination System MAJOR (Tracking pollutant discharge elimination systems) - permit - ICIS-, ENFORCEMENT/COMPLIANCE ACTIVITY, Business SIC classification: SEWERAGE SYSTEMS Alternative names: BELEN, CITY OF, CITY OF BELEN, CITY OF BELEN WWTP
BELEN SCHOOL DISTRICT (520 NORTH MAIN ST in BELEN, NM)
(Integrated Compliance Information System) - ICIS-06-1986-0092, FORMAL ENFORCEMENT ACTION COMPLIANCE ACTIVITY (Tracking inspections of insecticide, fungicide, and rodenticide, and toxic substances) Small Quantity Generators, between 100 kg and 1000 kg of hazardous waste/month (Resource Conservation and Recovery Act (tracking hazardous waste)) - notification Business SIC classification: LEGAL SERVICES; ELEMENTARY AND SECONDARY SCHOOLS Organizations: BELEN CONSOLID SCHOOLS (CONTACT/OWNER)
Alternative names: BELEN CONSOLIDATED SCHOOLS, BELEN CONSOLIDATED SCHOOL DISTRICT
BELEN HIGH SCHOOL AUTO SHOP (WEST DELGADO AVE in BELEN, NM)
(National Center for Education Statistics) - STATE ID-87611026 Conditionally Exempt Small Quantity Generators, less than 100 kg/month of hazardous waste (Resource Conservation and Recovery Act (tracking hazardous waste)) Organizations: BELEN SCHOOLS (CONTACT/OWNER)
, BELEN CONSOLIDATED SCHOOLS (SCHOOL DISTRICT)
AVONITE INCORPORATED (1945 HWY. 304 in BELEN, NM)
AIR MINOR (AIRS/AFS) CRITERIA AND HAZARDOUS AIR POLLUTANT INVENTORY (Inventory of air pollution sources) (Resource Conservation and Recovery Act (tracking hazardous waste)) TRI REPORTER (Tracking of toxic chemicals releasing facilities) Business SIC classification: UNSUPPORTED PLASTICS FILM AND SHEET; PLASTICS PLUMBING FIXTURES Business NAICS classification: UNLAMINATED PLASTICS FILM AND SHEET (EXCEPT PACKAGING) MANUFACTURING. Alternative names: ARISTECH ACRYLICS LLC
RIO COMMUNITIES WW TREATMENT (42 CHISUM TRAIL in BELEN, NM)
National Pollutant Discharge Elimination System NON-MAJOR (Tracking pollutant discharge elimination systems) - permit - ICIS-, ENFORCEMENT/COMPLIANCE ACTIVITY Business SIC classification: SEWERAGE SYSTEMS Alternative names: NEW MEXICO WATER SERVICE CO., RIO GRANDE UTILITIES CORP
BELEN MIDDLE SCHOOL (400 SOUTH 4TH in BELEN, NM)
(National Center for Education Statistics) - STATE ID-87611025 Organizations: BELEN CONSOLIDATED SCHOOLS (SCHOOL DISTRICT)
LA MERCED ELEMENTARY SCHOOL (301 ALAME LOOP in BELEN, NM)
(National Center for Education Statistics) - STATE ID-87611038 Organizations: BELEN CONSOLIDATED SCHOOLS (SCHOOL DISTRICT)
JARAMILLO ELEMENTARY (MARIPOSA PARK in BELEN, NM)
(National Center for Education Statistics) - STATE ID-87611068 Organizations: BELEN CONSOLIDATED SCHOOLS (SCHOOL DISTRICT)
HOMEBOUND/HOSPITAL (520 N. MAIN in BELEN, NM)
(National Center for Education Statistics) - STATE ID-87611998 Organizations: BELEN CONSOLIDATED SCHOOLS (SCHOOL DISTRICT)
LA PROMESA ELEMENTARY (673 EAST SCHOOL RD. in BELEN, NM)
(National Center for Education Statistics) - STATE ID-87611003 Organizations: BELEN CONSOLIDATED SCHOOLS (SCHOOL DISTRICT)
BELEN ALTERNATIVE (WEST DELGADO AVE. in BELEN, NM)
(National Center for Education Statistics) - STATE ID-87611001 Organizations: BELEN CONSOLIDATED SCHOOLS (SCHOOL DISTRICT)
GIL SANCHEZ ELEMENTARY (376 JARAL ROAD in BELEN, NM)
(National Center for Education Statistics) - STATE ID-87611066 Organizations: BELEN CONSOLIDATED SCHOOLS (SCHOOL DISTRICT)
Housing units lacking complete plumbing facilities: 6.3% Housing units lacking complete kitchen facilities: 2.9%
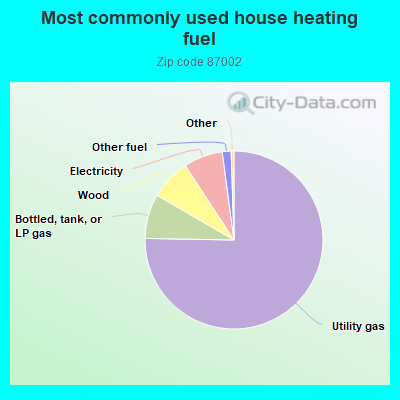
75.3%Utility gas
8.1%Bottled, tank, or LP gas
7.4%Wood
7.1%Electricity
1.6%Other fuel
Population in 1990: 14,826. Population change in the 1990s: +5,847 (+39.4%).
Place of birth for U.S.-born residents:
This state: 12,231
Northeast: 648
Midwest: 1,309
South: 1,433
West: 2,542
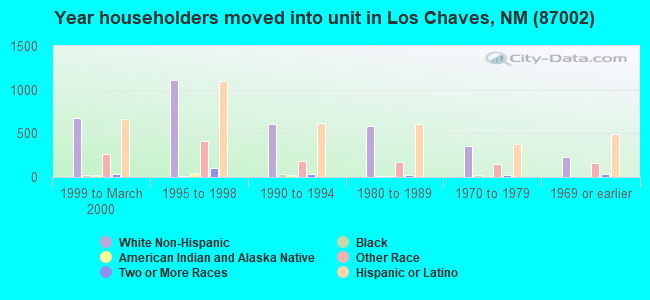
61% of the 87002 zip code residents lived in the same house 5 years ago. Out of people who lived in different houses, 47% lived in this county. Out of people who lived in different counties, 50% lived in New Mexico.
93% of the 87002 zip code residents lived in the same house 1 year ago. Out of people who lived in different houses, 47% moved from this county. Out of people who lived in different houses, 28% moved from different county within same state. Out of people who lived in different houses, 25% moved from different state. Out of people who lived in different houses, 0% moved from abroad.
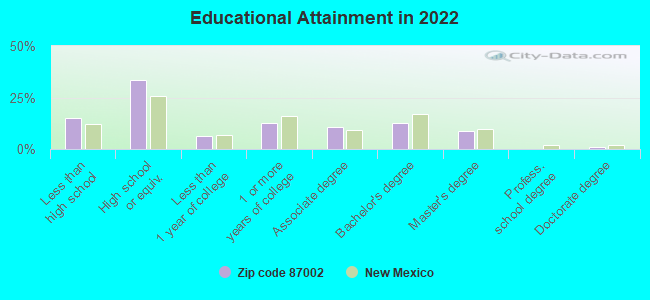
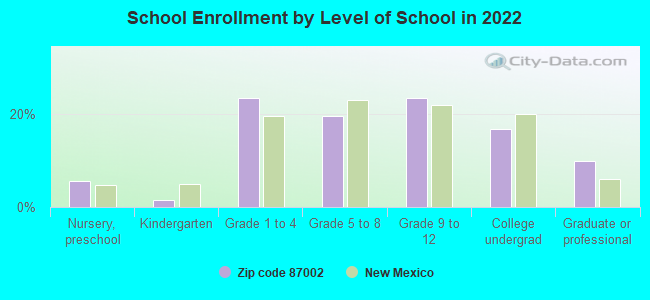
Private vs. public school enrollment:
Students in private schools in grades 1 to 8 (elementary and middle school): 315
Here:
18.6%
New Mexico:
10.2%
Students in private schools in grades 9 to 12 (high school): 184
Here:
20.1%
New Mexico:
10.0%
Students in private undergraduate colleges: 42
Here:
6.5%
New Mexico:
12.3%
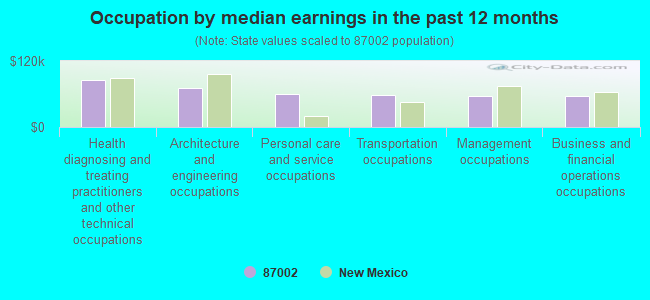
Occupation by median earnings in the past 12 months ($)
85,767Health diagnosing and treating practitioners and other technical occupations
71,522Architecture and engineering occupations
59,110Personal care and service occupations
58,544Transportation occupations
57,178Management occupations
56,129Business and financial operations occupations
Companies with federal contracts located in this zip code (BELEN, NM):
SAAVEDRA & RICE PA CPAS (610 BECKER AVE; small business) : $1,561,361 in 15 contractsin 2006
Contracts for Weapons -- Management and Support (R&D) by Air Force Signed by year:2000: $0; 2001: $0; 2002: $0; 2003: $0; 2004: $0; 2005: $0; 2006: $1,561,361.
Biggest contracts:
$250,000 with Air Force for Weapons -- Management and Support (R&D). Signed on 2006-03-31. Completion date: 2007-03-31.
$212,000, same as above.Signed on 2006-06-22. Completion date: 2007-06-21.
$190,000, same as above.Signed on 2006-03-30. Completion date: 2007-03-31.
$127,514, same as above.Signed on 2006-03-31. Completion date: 2007-03-31.
SISNEROS BROS MFG (2300 ROLDAN DRIVE; small business) : $1,392,114 in 5 contractsfrom 2002 to 2003
Contracts for Plate, Sheet, Strip, and Foil; Nonferrous Base Metal, Structural Shapes, Nonferrous Base Metal by Navy Signed by year:2000: $0; 2001: $0; 2002: $564,961; 2003: $827,153; 2004: $0; 2005: $0; 2006: $0.
Biggest contracts:
$827,153 with Navy for Plate, Sheet, Strip, and Foil; Nonferrous Base Metal. Signed on 2003-12-06. Completion date: 2004-12-05.
$289,032 with Navy for Plate, Sheet, Strip, and Foil; Nonferrous Base Metal. Taking place in VA. Signed on 2002-11-07. Completion date: 2003-12-05.
$275,929 with Navy for Structural Shapes, Nonferrous Base Metal. Signed on 2002-03-06. Completion date: 2002-12-05.
$0, same as above.Signed on 2002-03-06. Completion date: 2002-12-05.
SUD-CHEMIE INC (101 CHRISTINE DR; small business) : $746,597 in 28 contractsfrom 2000 to 2006
Contracts for Miscellaneous Chemical Specialties, Laboratory Equipment and Supplies by Defense Logistics Agency Signed by year:2000: $29,925; 2001: $0; 2002: $0; 2003: $97,450; 2004: $107,550; 2005: $347,728; 2006: $163,944.
Biggest contracts:
$83,746 with Defense Logistics Agency for Miscellaneous Chemical Specialties. Signed on 2005-09-30. Completion date: 2005-10-30.
$71,700, same as above.Signed on 2004-03-08. Completion date: 2004-04-07.
$60,228, same as above.Signed on 2006-06-22. Completion date: 2006-07-24.
$59,250, same as above.Signed on 2005-02-02. Completion date: 2005-03-04.
CASTILLO READY MIX INC (304 ROSEDALE CIR; small business) : $71,746 in 4 contractsfrom 2001 to 2002
$36,000 with Army for Scaffolding Equipment and Concrete Forms. Signed on 2002-03-04. Completion date: 2002-03-11.
$30,000, same as above.Signed on 2001-10-30. Completion date: 2001-11-24.
$5,100 with Army for Tile, Brick, and Block. Signed on 2002-09-27. Completion date: 2002-10-11.
$646 with Army for Scaffolding Equipment and Concrete Forms. Signed on 2001-12-11. Completion date: 2001-11-24.
DESERT GREENS EQUIPMENT, INC (19560 HIGHWAY 314; small business) : $56,368 in 9 contractsfrom 2005 to 2006
Contracts for Trucks and Truck Tractors, Wheeled, Lease or Rental of Equipment -- Tractors, Maintenance, Repair and Rebuilding of Equipment -- Construction, Mining, Excavating, and Highway Maintenance Equipment, Tractors, Wheeled, and moreby Indian Affairs (Assistant Secretary), Bureau of Land Management, Army Signed by year:2000: $0; 2001: $0; 2002: $0; 2003: $0; 2004: $0; 2005: $46,892; 2006: $9,476.
Biggest contracts:
$24,892 with Indian Affairs (Assistant Secretary) for Trucks and Truck Tractors, Wheeled. Taking place in AZ. Signed on 2005-09-06. Completion date: 2005-10-30.
$8,000 with Bureau of Land Management for Lease or Rental of Equipment -- Tractors. Signed on 2005-12-07. Completion date: 2006-01-07.
$6,000, same as above.Signed on 2006-02-22. Completion date: 2006-03-01.
$4,000 with Indian Affairs (Assistant Secretary) for Maintenance, Repair and Rebuilding of Equipment -- Construction, Mining, Excavating, and Highway Maintenance Equipment. Signed on 2005-10-20. Completion date: 2006-09-30.
MENDEZ CONSTRUCTION (2593 HWY 47)
$17,950 with Army for Tractors, Wheeled. Signed on 2005-09-17. Completion date: 2005-10-11.
MAVRICK'S BBQ & CATERING, LLC (20 SERAFIN RD; small business) : $14,883 in 2 contractsin 2004
$12,956 with Army for Construction of Structures and Facilities -- Dining Facilities. Signed on 2004-10-19. Completion date: 2004-10-23.
$1,927, same as above.Signed on 2004-10-29. Completion date: 2004-10-23.
BAYCOR CONTRACTING (12 ERNALDO RD; small business)
$11,610 with Forest Service for Construction of Structures and Facilities -- Other Non-Building Facilities. Signed on 2003-06-15. Completion date: 2003-08-15.
CENTRAL EQUIPMENT REPAIR (1416 HGWY 85; small business)
$8,234 with Army for Maintenance, Repair and Rebuilding of Equipment -- Vehicular Equipment Components. Signed on 2005-02-01. Completion date: 2005-03-02.
Top industries in this zip code by the number of employees in 2005:
Health Care and Social Assistance: Home Health Care Services (500-999 employees: 1 establishment, 1-4 employees: 1 establishment)
2003 - 2018 National Fire Incident Reporting System (NFIRS) incidents
Based on the data from the years 2003 - 2018 the average number of fires per year is 168. The highest number of fires - 292 took place in 2011, and the least - 19 in 2003. The data has an increasing trend.
When looking into fire subcategories, the most reports belonged to: Outside Fires (61.8%), and Structure Fires (24.4%).
Fire incident types reported to NFIRS in Zip Code 87002


 Nearest zip codes: 87023, 87062, 87042, 87006, 87028, 87068.


 Based on the data from the years 2003 - 2018 the average number of fires per year is 168. The highest number of fires - 292 took place in 2011, and the least - 19 in 2003. The data has an increasing trend.
 When looking into fire subcategories, the most reports belonged to: Outside Fires (61.8%), and Structure Fires (24.4%).