Estimated zip code population in 2022: 1,584 Zip code population in 2010: 1,270 Zip code population in 2000: 1,729
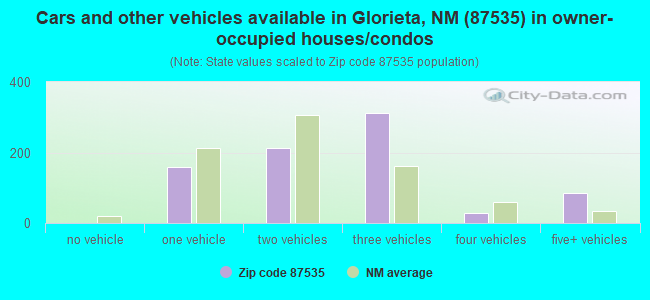
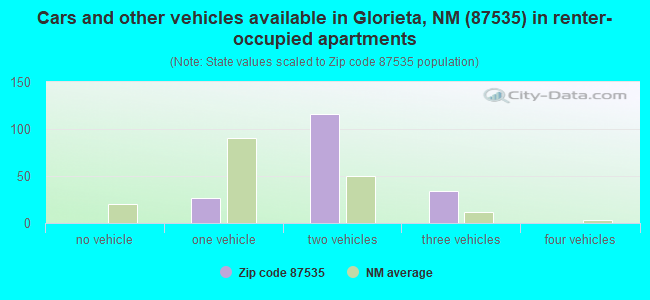
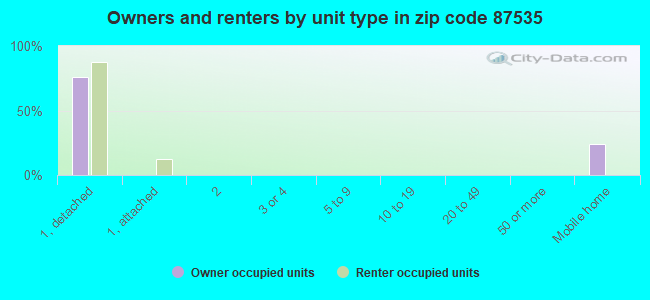
Houses and condos: 1,064 Renter-occupied apartments: 184
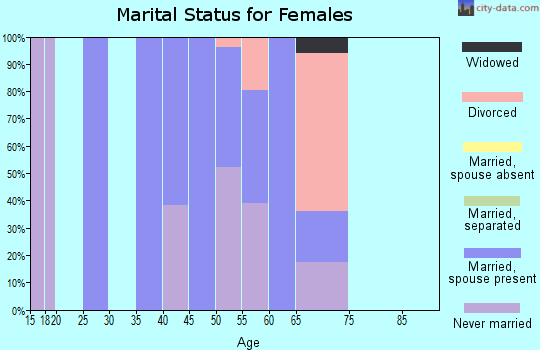
% of renters here:
19%
State:
29%
March 2022 cost of living index in zip code 87535: 93.7 (less than average, U.S. average is 100)
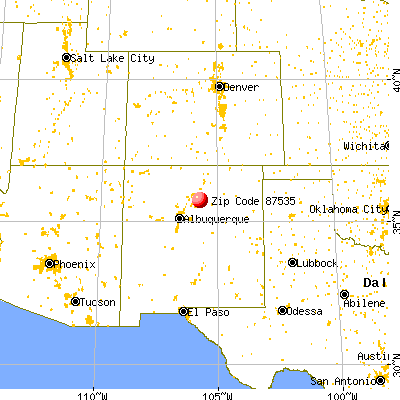
Land area: 64.3 sq. mi. Water area: 0.0 sq. mi.
Population density: 25 people per square mile
(very low).
OSM Map
General Map
Google Map
MSN Map
OSM Map
General Map
Google Map
MSN Map
OSM Map
General Map
Google Map
MSN Map
OSM Map
General Map
Google Map
MSN Map
Please wait while loading the map...
Real estate property taxes paid for housing units in 2022:
This zip code:
0.4% ($1,710)
New Mexico:
0.7% ($1,638)
Median real estate property taxes paid for housing units with mortgages in 2022: $1,706 (0.5%) Median real estate property taxes paid for housing units with no mortgage in 2022: $1,675 (0.4%)
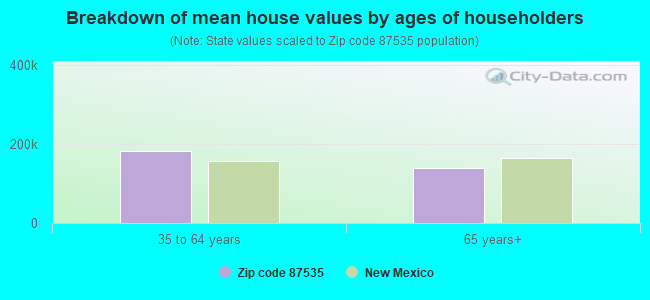
Estimated median house/condo value in 2022: $408,881
87535:
$408,881
New Mexico:
$243,100
According to our research of New Mexico and other state lists, there was 1 registered sex offender living in 87535 zip code as of April 28, 2024. The ratio of all residents to sex offenders in zip code 87535 is 1,154 to 1. The ratio of registered sex offenders to all residents in this zip code is lower than the state average.
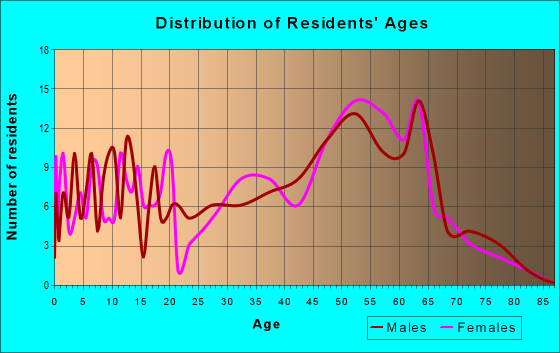
Median resident age:
This zip code:
57.7 years
New Mexico median age:
39.4 years
Average household size:
This zip code:
1.7 people
New Mexico:
2.4 people
Averages for the 2020 tax year for zip code 87535, filed in 2021:
Average Adjusted Gross Income (AGI) in 2020: $53,036 (Individual Income Tax Returns)
Here:
$53,036
State:
$59,146
Salary/wage: $44,684 (reported on 72.5% of returns)
Here:
$44,684
State:
$48,327
(% of AGI for various income ranges: 990.0% for AGIs below $25k, 3457.9% for AGIs $25k-50k, 7068.3% for AGIs $50k-75k, 8077.5% for AGIs $75k-100k, 21607.5% for AGIs $100k-200k)
Taxable interest for individuals: $532 (reported on 27.5% of returns)
This zip code:
$532
New Mexico:
$1,616
(% of AGI for various income ranges: 5.7% for AGIs below $25k, 9.3% for AGIs $25k-50k, 15.0% for AGIs $50k-75k, 22.5% for AGIs $75k-100k, 155.0% for AGIs $100k-200k)
Ordinary dividends: $6,357 (reported on 10.1% of returns)
Here:
$6,357
State:
$7,816
(% of AGI for various income ranges: 29.3% for AGIs below $25k, 95.0% for AGIs $50k-75k, 867.5% for AGIs $100k-200k)
Net capital gain/loss in AGI: +$8,383 (reported on 8.7% of returns)
Here:
+$8,383
State:
+$19,595
(% of AGI for various income ranges: 13.6% for AGIs below $25k, 13.3% for AGIs $50k-75k, 1190.0% for AGIs $100k-200k)
Profit/loss from business: +$8,840 (reported on 21.7% of returns)
Here:
+$8,840
State:
+$11,430
(% of AGI for various income ranges: 307.9% for AGIs below $25k, 215.7% for AGIs $25k-50k, 308.3% for AGIs $50k-75k, 1020.0% for AGIs $75k-100k)
Taxable individual retirement arrangement distribution: $19,050 (reported on 5.8% of returns)
87535:
$19,050
New Mexico:
$20,970
(% of AGI for various income ranges: 1270.0% for AGIs $50k-75k)
Total itemized deductions: $31,180 (reported on 7.2% of returns)
Here:
$31,180
State:
$33,187
(% of AGI for various income ranges: 465.7% for AGIs $25k-50k, 2267.5% for AGIs $100k-200k)
Charity contributions: $5,833 (reported on 4.3% of returns)
Here:
$5,833
State:
$11,850
(% of AGI for various income ranges: 437.5% for AGIs $75k-100k)
Taxes paid: $5,880 (reported on 7.2% of returns)
87535:
$5,880
State:
$7,150
(% of AGI for various income ranges: 72.9% for AGIs $25k-50k, 480.0% for AGIs $100k-200k)
Earned income credit: $2,033 (reported on 17.4% of returns)
Here:
$2,033
State:
$2,323
(% of AGI for various income ranges: 109.3% for AGIs below $25k, 65.0% for AGIs $25k-50k)
Percentage of individuals using paid preparers for their 2020 taxes: 88.4%
Here:
88%
State:
92%
(% for various income ranges: 87.5% for AGIs below $25k, 89.5% for AGIs $25k-50k, 81.8% for AGIs $50k-75k, 100.0% for AGIs $75k-100k, 88.9% for AGIs $100k-200k)
Averages for the 2012 tax year for zip code 87535, filed in 2013:
Average Adjusted Gross Income (AGI) in 2012: $42,165 (Individual Income Tax Returns)
Here:
$42,165
State:
$50,343
Salary/wage: $36,900 (reported on 77.4% of returns)
Here:
$36,900
State:
$41,171
(% of AGI for various income ranges: 66.9% for AGIs below $25k, 76.2% for AGIs $25k-50k, 66.9% for AGIs $50k-75k, 73.9% for AGIs $75k-100k, 57.3% for AGIs $100k-200k)
Taxable interest for individuals: $517 (reported on 29.0% of returns)
This zip code:
$517
New Mexico:
$1,677
(% of AGI for various income ranges: 0.4% for AGIs below $25k, 0.6% for AGIs $25k-50k, 0.6% for AGIs $50k-75k, 0.1% for AGIs $100k-200k)
Ordinary dividends: $2,562 (reported on 12.9% of returns)
Here:
$2,562
State:
$6,939
(% of AGI for various income ranges: 2.1% for AGIs below $25k, 1.3% for AGIs $25k-50k, 1.4% for AGIs $75k-100k)
Net capital gain/loss in AGI: +$1,950 (reported on 9.7% of returns)
Here:
+$1,950
State:
+$14,311
Profit/loss from business: +$7,633 (reported on 24.2% of returns)
Here:
+$7,633
State:
+$11,059
(% of AGI for various income ranges: 16.6% for AGIs below $25k, 4.3% for AGIs $25k-50k, 6.8% for AGIs $50k-75k)
Taxable individual retirement arrangement distribution: $16,867 (reported on 4.8% of returns)
87535:
$16,867
New Mexico:
$15,706
Total itemized deductions: $18,137 (27% of AGI, reported on 30.6% of returns)
Here:
$18,137
State:
$21,709
Here:
26.6% of AGI
State:
19.8% of AGI
(% of AGI for various income ranges: 10.0% for AGIs below $25k, 11.3% for AGIs $25k-50k, 13.6% for AGIs $50k-75k, 13.6% for AGIs $75k-100k, 15.9% for AGIs $100k-200k)
Charity contributions: $2,454 (reported on 21.0% of returns)
Here:
$2,454
State:
$4,195
(% of AGI for various income ranges: 1.3% for AGIs $25k-50k, 2.1% for AGIs $50k-75k, 1.6% for AGIs $100k-200k)
Taxes paid: $3,806 (reported on 29.0% of returns)
87535:
$3,806
State:
$6,176
(% of AGI for various income ranges: 1.5% for AGIs below $25k, 1.8% for AGIs $25k-50k, 2.5% for AGIs $50k-75k, 3.1% for AGIs $75k-100k, 3.8% for AGIs $100k-200k)
Earned income credit: $2,017 (reported on 19.4% of returns)
Here:
$2,017
State:
$2,311
(% of AGI for various income ranges: 5.8% for AGIs below $25k, 0.8% for AGIs $25k-50k)
Percentage of individuals using paid preparers for their 2012 taxes: 40.3%
Here:
40%
State:
50%
(% for various income ranges: 36.0% for AGIs below $25k, 41.2% for AGIs $25k-50k, 60.0% for AGIs $50k-75k, 60.0% for AGIs $100k-200k)
Averages for the 2004 tax year for zip code 87535, filed in 2005:
Average Adjusted Gross Income (AGI) in 2004: $33,394 (Individual Income Tax Returns)
Here:
$33,394
State:
$39,572
Salary/wage: $31,786 (reported on 83.7% of returns)
Here:
$31,786
State:
$34,237
(% of AGI for various income ranges: 103.1% for AGIs below $10k, 85.5% for AGIs $10k-25k, 85.5% for AGIs $25k-50k, 80.9% for AGIs $50k-75k, 73.8% for AGIs $75k-100k, 62.7% for AGIs over 100k)
Taxable interest for individuals: $603 (reported on 33.5% of returns)
This zip code:
$603
New Mexico:
$1,873
(% of AGI for various income ranges: 2.1% for AGIs below $10k, 0.7% for AGIs $10k-25k, 0.7% for AGIs $25k-50k, 0.6% for AGIs $50k-75k, 0.4% for AGIs $75k-100k, 0.2% for AGIs over 100k)
Taxable dividends: $1,756 (reported on 13.0% of returns)
Here:
$1,756
State:
$3,554
(% of AGI for various income ranges: 1.9% for AGIs below $10k, 0.2% for AGIs $10k-25k, 0.5% for AGIs $25k-50k, 1.3% for AGIs $50k-75k, 0.8% for AGIs over 100k)
Net capital gain/loss: +$3,727 (reported on 12.7% of returns)
Here:
+$3,727
State:
+$10,425
(% of AGI for various income ranges: -4.8% for AGIs below $10k, -0.5% for AGIs $10k-25k, 0.8% for AGIs $25k-50k, 2.9% for AGIs $50k-75k, 4.1% for AGIs over 100k)
Profit/loss from business: +$6,923 (reported on 22.4% of returns)
Here:
+$6,923
State:
+$8,875
(% of AGI for various income ranges: 1.4% for AGIs below $10k, 6.6% for AGIs $10k-25k, 4.0% for AGIs $25k-50k, 5.5% for AGIs $50k-75k, 9.5% for AGIs $75k-100k)
IRA payment deduction: $2,091 (reported on 1.6% of returns)
87535:
$2,091
New Mexico:
$2,940
Total itemized deductions: $17,525 (30% of AGI, reported on 29.4% of returns)
Here:
$17,525
State:
$18,103
Here:
29.6% of AGI
State:
21.5% of AGI
(% of AGI for various income ranges: 16.2% for AGIs below $10k, 8.6% for AGIs $10k-25k, 13.5% for AGIs $25k-50k, 14.8% for AGIs $50k-75k, 19.7% for AGIs $75k-100k, 22.8% for AGIs over 100k)
Charity contributions deductions: $2,061 (3% of AGI, reported on 23.8% of returns)
Here:
$2,061
State:
$3,246
Here:
3.2% of AGI
State:
3.6% of AGI
(% of AGI for various income ranges: 0.2% for AGIs $10k-25k, 1.1% for AGIs $25k-50k, 1.5% for AGIs $50k-75k, 2.1% for AGIs $75k-100k, 3.0% for AGIs over 100k)
Total tax: $4,032 (reported on 71.7% of returns)
87535:
$4,032
State:
$6,237
(% of AGI for various income ranges: 5.8% for AGIs below $10k, 4.4% for AGIs $10k-25k, 6.9% for AGIs $25k-50k, 8.5% for AGIs $50k-75k, 10.8% for AGIs $75k-100k, 14.8% for AGIs over 100k)
Earned income credit: $1,581 (reported on 22.4% of returns)
Here:
$1,581
State:
$1,796
Percentage of individuals using paid preparers for their 2004 taxes: 49.1%
Here:
49%
State:
57%
(% for various income ranges: 50.0% for AGIs below $10k, 52.4% for AGIs $10k-25k, 41.8% for AGIs $25k-50k, 50.0% for AGIs $50k-75k, 48.4% for AGIs $75k-100k, 70.4% for AGIs over 100k)
Household received Food Stamps/SNAP in the past 12 months: 32 Household did not receive Food Stamps/SNAP in the past 12 months: 912
Women who did not have a birth in the past 12 months: 303 (181 now married, 118 unmarried)
Housing units in zip code 87535 with a mortgage: 333 (23 second mortgage) Median monthly owner costs for units with a mortgage: $1,600 Median monthly owner costs for units without a mortgage: $390
Residents with income below the poverty level in 2022:
This zip code:
11.3%
Whole state:
17.6%
Residents with income below 50% of the poverty level in 2022:
This zip code:
9.1%
Whole state:
9.7%
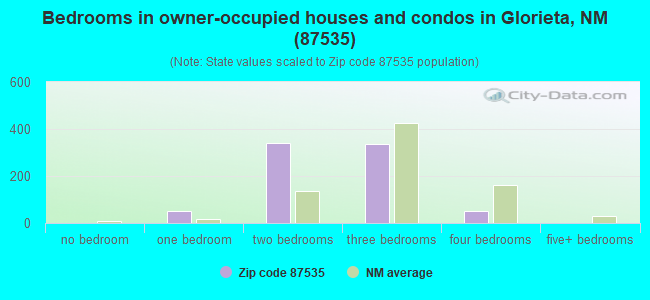
Median number of rooms in houses and condos:
Here:
6.4
State:
5.9
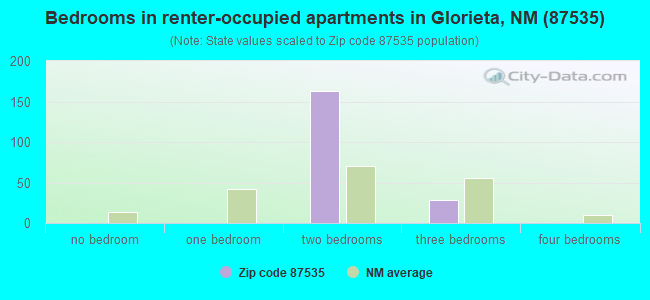
Median number of rooms in apartments:
Here:
4.0
State:
4.2
Notable locations in this zip code not listed on our city pages
Notable locations in zip code 87535: Padre Spring Ranch (A), Trading Post (B), Glorieta Battlefield National Historic Landmark (C), Glorieta Convention Center (D), Gonzales Ranch (E), Archuleta Ranch (F), Glorieta Pass Battlefield Historic Site (G), Loyd Ranch (H), Glorieta Weather Station (I), Glorieta Baptist Conference Center (J), Santa Fe County Volunteer Fire Glorietta Pass District (K). Display/hide their locations on the map
Churches in zip code 87535 include: Glorieta Baptist Church (A), Bible Baptist Church (B), Glorieta Baptist Church (C). Display/hide their locations on the map
Size of family households: 346 2-persons, 117 3-persons, 16 4-persons
Size of nonfamily households: 437 1-person, 53 2-persons
72 married couples with children.
5 single-parent households (5 women).
83.6% of residents of 87535 zip code speak English at home.
18.0% of residents speak Spanish at home (83% very well, 17% well).
0.5% of residents speak Asian or Pacific Island language at home (100% very well).
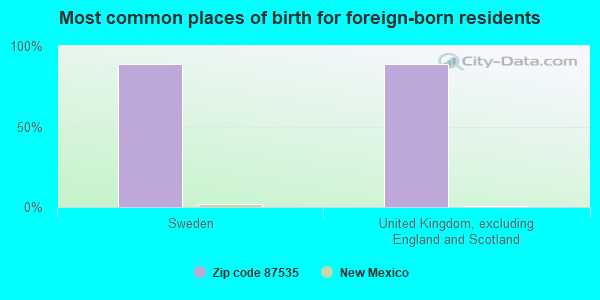
Foreign born population: 9 (0.6%) (0.0% of them are naturalized citizens)
:
0.6%
Whole state:
9.3%
89%Sweden
89%United Kingdom, excluding England and Scotland
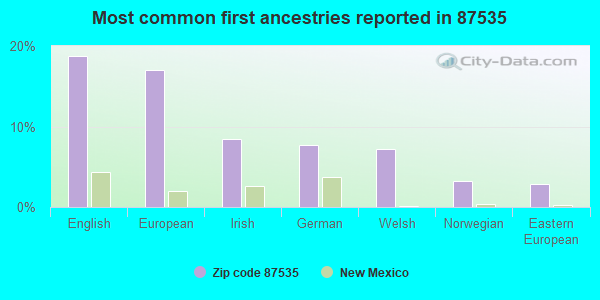
19%English
17%European
8%Irish
8%German
7%Welsh
3%Norwegian
3%Eastern European
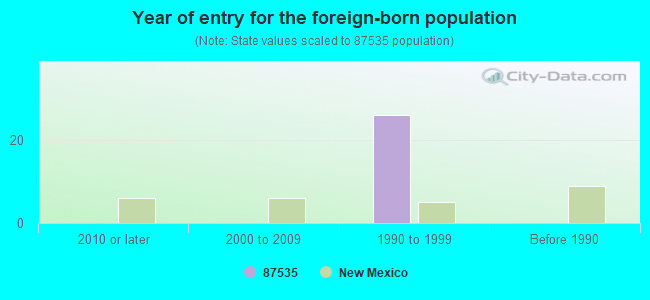
Year of entry for the foreign-born population
02010 or later
02000 to 2009
261990 to 1999
0Before 1990
Facilities with environmental interests located in this zip code:
LIFE WAY GLORIETA CONF.CENTER (E. OF EXIT 299 ON I-25,SANTA in GLORIETA, NM)
National Pollutant Discharge Elimination System NON-MAJOR (Tracking pollutant discharge elimination systems) - permit - ICIS-, ENFORCEMENT/COMPLIANCE ACTIVITY Business SIC classification: RELIGIOUS ORGANIZATIONS Alternative names: GLORIETA BAPTIST CONFERENCE CE, GLORIETA BAPTIST CONFERENCE CT, LIFE WAY GLORIETA CONFERENCE
GLORIETA EAST WATER SUPPLY WATER SYS (RTE 1, BOX 7 in GLORIETA, NM)
(Integrated Compliance Information System) - ICIS-06-2000-1265, FORMAL ENFORCEMENT ACTION Business SIC classification: WATER SUPPLY
LA JOYA MDWCA WATER SYS (PO BOX 41 in LA JOYA, NM)
(Integrated Compliance Information System) - ICIS-06-2000-1078, FORMAL ENFORCEMENT ACTION Business SIC classification: WATER SUPPLY
Housing units lacking complete plumbing facilities: 3.2% Housing units lacking complete kitchen facilities: 3.0%
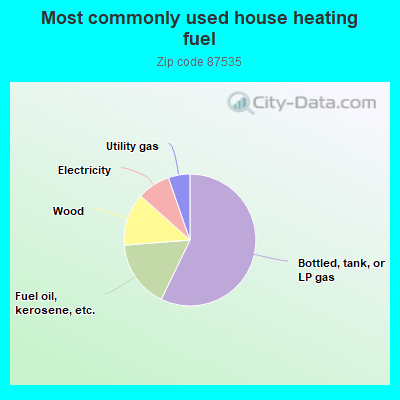
57.3%Bottled, tank, or LP gas
16.6%Fuel oil, kerosene, etc.
12.9%Wood
8.1%Electricity
5.3%Utility gas
Population in 1990: 1,246. Population change in the 1990s: +483 (+38.8%).
Place of birth for U.S.-born residents:
This state: 471
Northeast: 236
Midwest: 244
South: 250
West: 364
69% of the 87535 zip code residents lived in the same house 5 years ago. Out of people who lived in different houses, 58% lived in this county. Out of people who lived in different counties, 50% lived in New Mexico.
93% of the 87535 zip code residents lived in the same house 1 year ago. Out of people who lived in different houses, 53% moved from this county. Out of people who lived in different houses, 51% moved from different state.
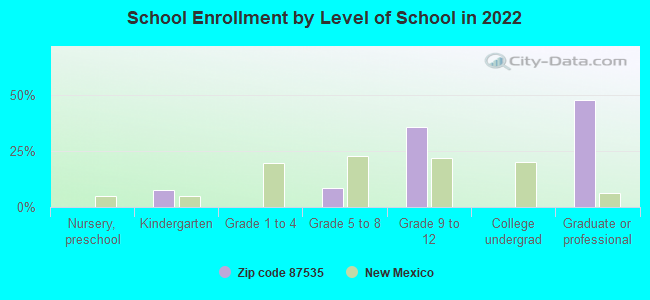
Private vs. public school enrollment:
Students in private schools in grades 1 to 8 (elementary and middle school): 17
Here:
100.0%
New Mexico:
10.2%
Students in private schools in grades 9 to 12 (high school):
Here:
0.0%
New Mexico:
10.0%
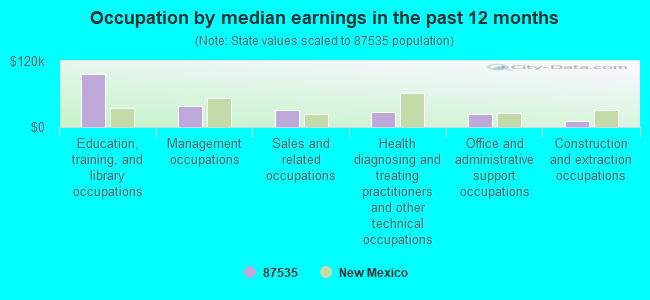
Occupation by median earnings in the past 12 months ($)
96,665Education, training, and library occupations
37,372Management occupations
31,544Sales and related occupations
27,079Health diagnosing and treating practitioners and other technical occupations
23,784Office and administrative support occupations
11,492Construction and extraction occupations
Top industries in this zip code by the number of employees in 2005:
Other Services (except Public Administration): Religious Organizations (50-99 employees: 1 establishment, 1-4 employees: 1 establishment)
Construction: New Multifamily Housing Construction (except Operative Builders) (1-4: 1)
Educational Services: Educational Support Services (1-4: 1)
Arts, Entertainment, and Recreation: All Other Amusement and Recreation Industries (1-4: 1)
Construction: New Single-Family Housing Construction (except Operative Builders) (1-4: 1)
Construction: All Other Specialty Trade Contractors (1-4: 1)
Other Services (except Public Administration): Pet Care (except Veterinary) Services (1-4: 1)
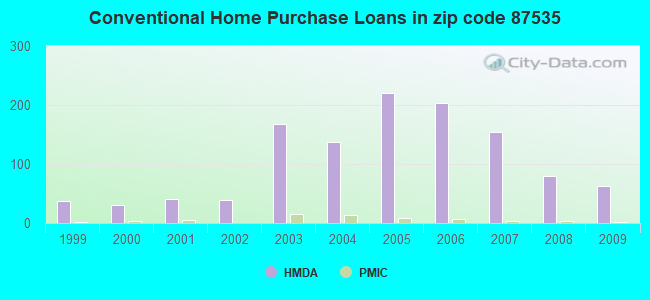
Home Mortgage Disclosure Act Aggregated Statistics For Year 2009 (Based on 6 partial tracts)
A) FHA, FSA/RHS & VA Home Purchase Loans
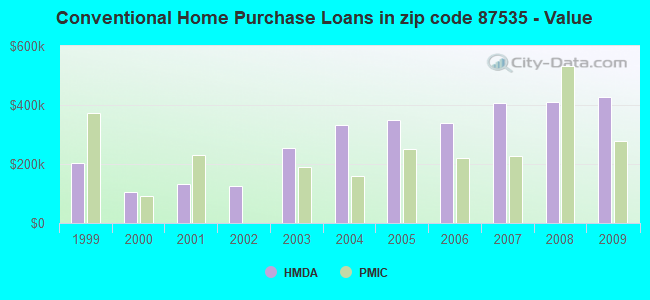
B) Conventional Home Purchase Loans
C) Refinancings
D) Home Improvement Loans
F) Non-occupant Loans on < 5 Family Dwellings (A B C & D)
G) Loans On Manufactured Home Dwelling (A B C & D)
Number
Average Value
Number
Average Value
Number
Average Value
Number
Average Value
Number
Average Value
Number
Average Value
LOANS ORIGINATED
8
$210,561
62
$426,235
355
$288,847
16
$162,206
53
$414,358
32
$112,629
APPLICATIONS APPROVED, NOT ACCEPTED
0
$0
12
$352,584
61
$281,124
3
$217,737
8
$276,364
9
$91,934
APPLICATIONS DENIED
0
$0
22
$174,073
153
$327,393
11
$97,223
15
$273,287
30
$74,020
APPLICATIONS WITHDRAWN
0
$0
8
$378,382
62
$265,076
2
$283,260
7
$457,697
5
$166,234
FILES CLOSED FOR INCOMPLETENESS
0
$0
3
$225,410
15
$183,633
1
$387,810
1
$106,290
3
$72,913
Aggregated Statistics For Year 2008 (Based on 6 partial tracts)
A) FHA, FSA/RHS & VA Home Purchase Loans
B) Conventional Home Purchase Loans
C) Refinancings
D) Home Improvement Loans
E) Loans on Dwellings For 5+ Families
F) Non-occupant Loans on < 5 Family Dwellings (A B C & D)
G) Loans On Manufactured Home Dwelling (A B C & D)
Number
Average Value
Number
Average Value
Number
Average Value
Number
Average Value
Number
Average Value
Number
Average Value
Number
Average Value
LOANS ORIGINATED
7
$182,916
80
$410,271
204
$275,911
21
$90,154
1
$190,040
43
$444,827
36
$115,824
APPLICATIONS APPROVED, NOT ACCEPTED
3
$165,190
18
$356,219
25
$267,336
1
$3,790
0
$0
7
$297,961
9
$93,766
APPLICATIONS DENIED
1
$111,780
31
$210,001
141
$245,772
46
$120,897
0
$0
16
$159,924
42
$109,940
APPLICATIONS WITHDRAWN
1
$293,110
11
$436,326
64
$272,455
8
$115,534
0
$0
8
$556,059
9
$129,513
FILES CLOSED FOR INCOMPLETENESS
0
$0
0
$0
13
$221,183
1
$268,630
0
$0
1
$85,090
3
$152,827
Aggregated Statistics For Year 2007 (Based on 6 partial tracts)
A) FHA, FSA/RHS & VA Home Purchase Loans
B) Conventional Home Purchase Loans
C) Refinancings
D) Home Improvement Loans
F) Non-occupant Loans on < 5 Family Dwellings (A B C & D)
G) Loans On Manufactured Home Dwelling (A B C & D)
Number
Average Value
Number
Average Value
Number
Average Value
Number
Average Value
Number
Average Value
Number
Average Value
LOANS ORIGINATED
5
$139,104
154
$405,534
288
$316,661
39
$126,958
63
$384,860
45
$98,852
APPLICATIONS APPROVED, NOT ACCEPTED
0
$0
41
$319,351
41
$342,052
7
$127,344
10
$311,429
14
$92,411
APPLICATIONS DENIED
0
$0
36
$258,824
201
$270,855
41
$120,206
11
$289,884
65
$111,678
APPLICATIONS WITHDRAWN
0
$0
23
$450,408
93
$249,582
13
$143,139
9
$345,750
25
$129,877
FILES CLOSED FOR INCOMPLETENESS
0
$0
8
$244,231
35
$267,602
2
$166,115
1
$396,180
3
$138,350
Aggregated Statistics For Year 2006 (Based on 6 partial tracts)
A) FHA, FSA/RHS & VA Home Purchase Loans
B) Conventional Home Purchase Loans
C) Refinancings
D) Home Improvement Loans
F) Non-occupant Loans on < 5 Family Dwellings (A B C & D)
G) Loans On Manufactured Home Dwelling (A B C & D)
Number
Average Value
Number
Average Value
Number
Average Value
Number
Average Value
Number
Average Value
Number
Average Value
LOANS ORIGINATED
5
$143,800
203
$337,539
301
$276,731
39
$118,730
79
$335,874
50
$88,596
APPLICATIONS APPROVED, NOT ACCEPTED
1
$143,480
33
$256,650
44
$228,740
3
$72,337
9
$332,269
15
$114,591
APPLICATIONS DENIED
0
$0
45
$235,566
176
$222,136
51
$89,960
9
$160,668
56
$103,111
APPLICATIONS WITHDRAWN
1
$142,650
23
$321,844
91
$273,072
8
$113,290
7
$355,514
17
$126,626
FILES CLOSED FOR INCOMPLETENESS
0
$0
6
$236,235
19
$250,139
2
$66,030
1
$190,680
2
$139,910
Aggregated Statistics For Year 2005 (Based on 6 partial tracts)
A) FHA, FSA/RHS & VA Home Purchase Loans
B) Conventional Home Purchase Loans
C) Refinancings
D) Home Improvement Loans
F) Non-occupant Loans on < 5 Family Dwellings (A B C & D)
G) Loans On Manufactured Home Dwelling (A B C & D)
Number
Average Value
Number
Average Value
Number
Average Value
Number
Average Value
Number
Average Value
Number
Average Value
LOANS ORIGINATED
4
$173,915
220
$348,235
313
$289,291
31
$127,027
79
$461,725
64
$95,710
APPLICATIONS APPROVED, NOT ACCEPTED
0
$0
36
$275,577
46
$299,070
9
$97,566
5
$427,560
17
$74,042
APPLICATIONS DENIED
6
$101,842
58
$198,032
181
$188,957
36
$57,893
10
$249,470
67
$77,357
APPLICATIONS WITHDRAWN
5
$177,808
29
$216,323
94
$235,663
15
$120,859
11
$396,354
19
$95,919
FILES CLOSED FOR INCOMPLETENESS
0
$0
8
$184,890
15
$219,703
0
$0
2
$156,830
2
$111,785
Aggregated Statistics For Year 2004 (Based on 6 partial tracts)
A) FHA, FSA/RHS & VA Home Purchase Loans
B) Conventional Home Purchase Loans
C) Refinancings
D) Home Improvement Loans
E) Loans on Dwellings For 5+ Families
F) Non-occupant Loans on < 5 Family Dwellings (A B C & D)
G) Loans On Manufactured Home Dwelling (A B C & D)
Number
Average Value
Number
Average Value
Number
Average Value
Number
Average Value
Number
Average Value
Number
Average Value
Number
Average Value
LOANS ORIGINATED
4
$174,082
137
$331,163
322
$283,908
34
$103,728
1
$294,400
50
$349,164
56
$96,628
APPLICATIONS APPROVED, NOT ACCEPTED
1
$199,740
36
$260,803
54
$179,783
9
$221,520
0
$0
7
$292,279
21
$69,039
APPLICATIONS DENIED
7
$107,130
78
$154,328
163
$254,425
31
$45,098
0
$0
13
$804,809
72
$73,223
APPLICATIONS WITHDRAWN
1
$178,400
17
$446,971
98
$191,332
4
$106,515
0
$0
6
$130,933
30
$114,365
FILES CLOSED FOR INCOMPLETENESS
1
$118,830
1
$1,030,720
16
$219,247
2
$32,030
0
$0
2
$256,070
0
$0
Aggregated Statistics For Year 2003 (Based on 6 partial tracts)
A) FHA, FSA/RHS & VA Home Purchase Loans
B) Conventional Home Purchase Loans
C) Refinancings
D) Home Improvement Loans
F) Non-occupant Loans on < 5 Family Dwellings (A B C & D)
Number
Average Value
Number
Average Value
Number
Average Value
Number
Average Value
Number
Average Value
LOANS ORIGINATED
0
$0
168
$255,756
630
$244,460
44
$61,148
72
$367,519
APPLICATIONS APPROVED, NOT ACCEPTED
0
$0
30
$177,116
75
$203,913
5
$49,002
7
$332,653
APPLICATIONS DENIED
1
$179,350
55
$142,311
206
$198,790
22
$21,656
7
$209,421
APPLICATIONS WITHDRAWN
0
$0
21
$367,690
124
$180,654
3
$23,983
11
$304,470
FILES CLOSED FOR INCOMPLETENESS
0
$0
7
$273,331
20
$295,000
1
$475,420
1
$688,010
Aggregated Statistics For Year 2002 (Based on 2 partial tracts)
A) FHA, FSA/RHS & VA Home Purchase Loans
B) Conventional Home Purchase Loans
C) Refinancings
D) Home Improvement Loans
F) Non-occupant Loans on < 5 Family Dwellings (A B C & D)
Number
Average Value
Number
Average Value
Number
Average Value
Number
Average Value
Number
Average Value
LOANS ORIGINATED
0
$0
39
$127,036
212
$158,031
33
$38,003
10
$127,052
APPLICATIONS APPROVED, NOT ACCEPTED
0
$0
9
$70,373
23
$129,168
3
$19,807
0
$0
APPLICATIONS DENIED
1
$168,140
27
$76,741
52
$115,528
10
$16,814
6
$66,370
APPLICATIONS WITHDRAWN
0
$0
4
$122,312
40
$97,502
5
$11,884
3
$183,310
FILES CLOSED FOR INCOMPLETENESS
0
$0
0
$0
13
$124,767
0
$0
1
$79,640
Aggregated Statistics For Year 2001 (Based on 2 partial tracts)
A) FHA, FSA/RHS & VA Home Purchase Loans
B) Conventional Home Purchase Loans
C) Refinancings
D) Home Improvement Loans
F) Non-occupant Loans on < 5 Family Dwellings (A B C & D)
Number
Average Value
Number
Average Value
Number
Average Value
Number
Average Value
Number
Average Value
LOANS ORIGINATED
5
$120,604
40
$132,425
131
$144,042
18
$34,344
6
$133,583
APPLICATIONS APPROVED, NOT ACCEPTED
0
$0
9
$121,222
11
$112,169
1
$75,850
1
$35,400
APPLICATIONS DENIED
0
$0
14
$49,304
42
$100,594
20
$17,130
1
$35,400
APPLICATIONS WITHDRAWN
0
$0
6
$221,867
19
$169,536
4
$41,088
1
$75,850
FILES CLOSED FOR INCOMPLETENESS
0
$0
1
$150,440
3
$165,190
0
$0
0
$0
Aggregated Statistics For Year 2000 (Based on 2 partial tracts)
A) FHA, FSA/RHS & VA Home Purchase Loans
B) Conventional Home Purchase Loans
C) Refinancings
D) Home Improvement Loans
F) Non-occupant Loans on < 5 Family Dwellings (A B C & D)
Number
Average Value
Number
Average Value
Number
Average Value
Number
Average Value
Number
Average Value
LOANS ORIGINATED
3
$59,417
30
$103,412
51
$112,687
19
$27,746
8
$121,048
APPLICATIONS APPROVED, NOT ACCEPTED
0
$0
9
$58,153
3
$136,113
3
$15,170
0
$0
APPLICATIONS DENIED
0
$0
19
$59,417
28
$106,644
4
$18,962
1
$20,230
APPLICATIONS WITHDRAWN
0
$0
8
$109,985
15
$82,679
0
$0
4
$118,202
FILES CLOSED FOR INCOMPLETENESS
0
$0
0
$0
4
$133,372
0
$0
0
$0
Aggregated Statistics For Year 1999 (Based on 2 partial tracts)
B) Conventional Home Purchase Loans
C) Refinancings
D) Home Improvement Loans
F) Non-occupant Loans on < 5 Family Dwellings (A B C & D)
2004 - 2018 National Fire Incident Reporting System (NFIRS) incidents
Based on the data from the years 2004 - 2018 the average number of fires per year is 7. The highest number of fires - 14 took place in 2011, and the least - 0 in 2005. The data has a growing trend.
When looking into fire subcategories, the most reports belonged to: Outside Fires (36.4%), and Structure Fires (34.6%).
Fire incident types reported to NFIRS in Zip Code 87535


 Nearest zip codes: 87562, 87505, 87540, 87538, 87552, 87508.
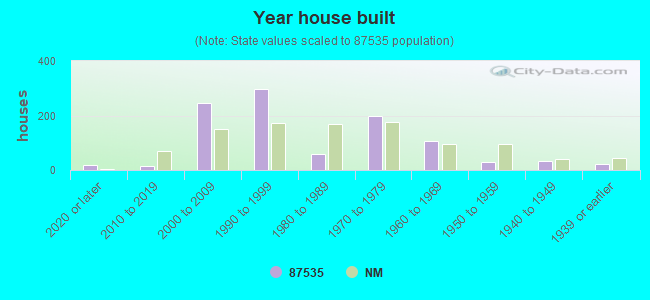


 Based on the data from the years 2004 - 2018 the average number of fires per year is 7. The highest number of fires - 14 took place in 2011, and the least - 0 in 2005. The data has a growing trend.
 When looking into fire subcategories, the most reports belonged to: Outside Fires (36.4%), and Structure Fires (34.6%).