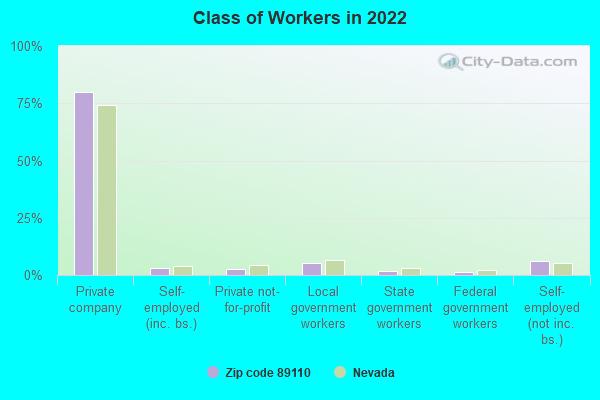
Estimated zip code population in 2022: 68,499 Zip code population in 2010: 70,994 Zip code population in 2000: 61,898
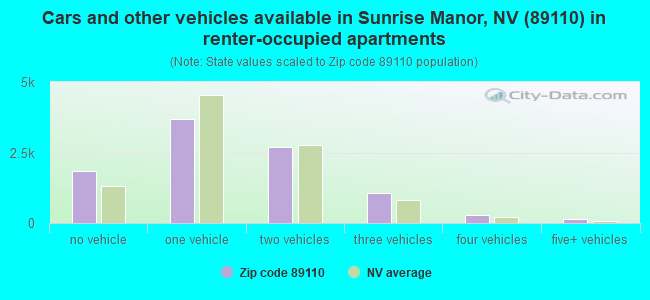
Houses and condos: 24,835 Renter-occupied apartments: 9,741
% of renters here:
44%
State:
40%
March 2022 cost of living index in zip code 89110: 99.0 (near average, U.S. average is 100)
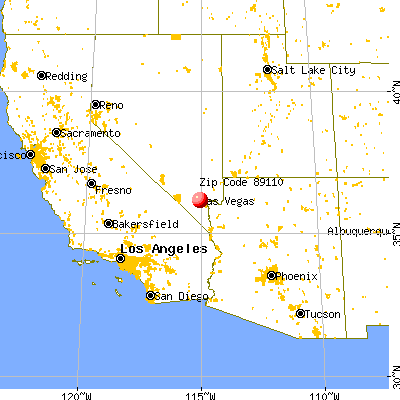
Land area: 11.1 sq. mi. Water area: 0.0 sq. mi.
Population density: 6,164 people per square mile
(high).
OSM Map
General Map
Google Map
MSN Map
OSM Map
General Map
Google Map
MSN Map
OSM Map
General Map
Google Map
MSN Map
OSM Map
General Map
Google Map
MSN Map
Please wait while loading the map...
Real estate property taxes paid for housing units in 2022:
This zip code:
0.4% ($1,160)
Nevada:
0.4% ($1,889)
Median real estate property taxes paid for housing units with mortgages in 2022: $1,218 (0.4%) Median real estate property taxes paid for housing units with no mortgage in 2022: $1,048 (0.4%)
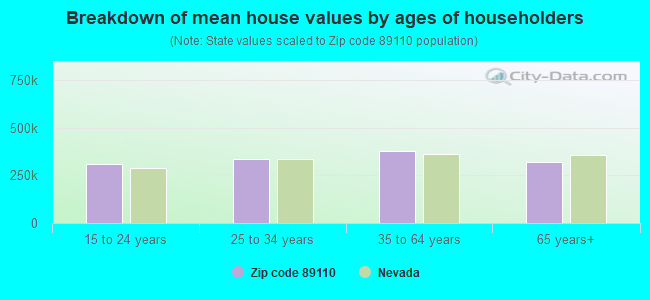
Estimated median house/condo value in 2022: $323,292
89110:
$323,292
Nevada:
$434,700
According to our research of Nevada and other state lists, there were 180 registered sex offenders living in 89110 zip code as of April 27, 2024. The ratio of all residents to sex offenders in zip code 89110 is 416 to 1. The ratio of registered sex offenders to all residents in this zip code is lower than the state average.
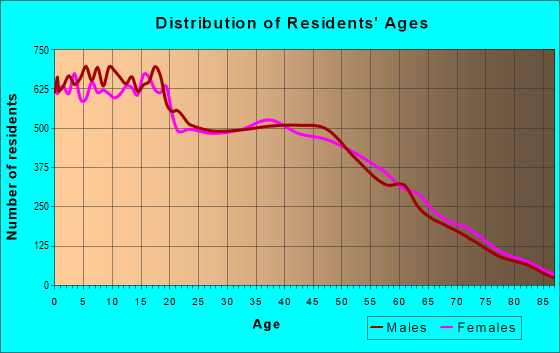
Median resident age:
This zip code:
33.5 years
Nevada median age:
39.0 years
Average household size:
This zip code:
3.1 people
Nevada:
2.6 people
Averages for the 2020 tax year for zip code 89110, filed in 2021:
Average Adjusted Gross Income (AGI) in 2020: $39,788 (Individual Income Tax Returns)
Here:
$39,788
State:
$78,964
Salary/wage: $33,848 (reported on 85.6% of returns)
Here:
$33,848
State:
$54,472
(% of AGI for various income ranges: 1210.7% for AGIs below $25k, 3424.8% for AGIs $25k-50k, 6365.6% for AGIs $50k-75k, 9124.8% for AGIs $75k-100k, 15241.2% for AGIs $100k-200k, 63405.7% for AGIs over 200k)
Taxable interest for individuals: $875 (reported on 11.3% of returns)
This zip code:
$875
Nevada:
$3,521
(% of AGI for various income ranges: 3.1% for AGIs below $25k, 4.9% for AGIs $25k-50k, 12.2% for AGIs $50k-75k, 22.5% for AGIs $75k-100k, 107.2% for AGIs $100k-200k, 1135.7% for AGIs over 200k)
Ordinary dividends: $3,920 (reported on 3.9% of returns)
Here:
$3,920
State:
$13,390
(% of AGI for various income ranges: 2.8% for AGIs below $25k, 4.3% for AGIs $25k-50k, 16.4% for AGIs $50k-75k, 38.7% for AGIs $75k-100k, 180.1% for AGIs $100k-200k, 2390.0% for AGIs over 200k)
Net capital gain/loss in AGI: +$15,507 (reported on 4.4% of returns)
Here:
+$15,507
State:
+$63,025
(% of AGI for various income ranges: 0.4% for AGIs below $25k, 3.1% for AGIs $25k-50k, 20.4% for AGIs $50k-75k, 67.9% for AGIs $75k-100k, 467.1% for AGIs $100k-200k, 24001.4% for AGIs over 200k)
Profit/loss from business: +$6,209 (reported on 16.4% of returns)
Here:
+$6,209
State:
+$11,500
(% of AGI for various income ranges: 123.4% for AGIs below $25k, 71.6% for AGIs $25k-50k, 133.1% for AGIs $50k-75k, 166.4% for AGIs $75k-100k, 410.4% for AGIs $100k-200k, 5127.1% for AGIs over 200k)
Taxable individual retirement arrangement distribution: $14,499 (reported on 2.4% of returns)
89110:
$14,499
Nevada:
$23,628
(% of AGI for various income ranges: 8.8% for AGIs below $25k, 18.9% for AGIs $25k-50k, 46.9% for AGIs $50k-75k, 149.3% for AGIs $75k-100k, 329.5% for AGIs $100k-200k, 2868.6% for AGIs over 200k)
Total itemized deductions: $29,333 (reported on 3.2% of returns)
Here:
$29,333
State:
$44,173
(% of AGI for various income ranges: 14.4% for AGIs below $25k, 62.4% for AGIs $25k-50k, 195.7% for AGIs $50k-75k, 349.5% for AGIs $75k-100k, 840.9% for AGIs $100k-200k, 6835.7% for AGIs over 200k)
Charity contributions: $7,299 (reported on 2.5% of returns)
Here:
$7,299
State:
$12,589
(% of AGI for various income ranges: 1.1% for AGIs below $25k, 8.0% for AGIs $25k-50k, 33.5% for AGIs $50k-75k, 58.1% for AGIs $75k-100k, 236.1% for AGIs $100k-200k, 1670.0% for AGIs over 200k)
Taxes paid: $5,210 (reported on 3.1% of returns)
89110:
$5,210
State:
$6,112
(% of AGI for various income ranges: 2.6% for AGIs below $25k, 12.6% for AGIs $25k-50k, 38.1% for AGIs $50k-75k, 53.5% for AGIs $75k-100k, 147.4% for AGIs $100k-200k, 898.6% for AGIs over 200k)
Earned income credit: $2,595 (reported on 27.3% of returns)
Here:
$2,595
State:
$2,214
(% of AGI for various income ranges: 136.0% for AGIs below $25k, 93.3% for AGIs $25k-50k, 1.7% for AGIs $50k-75k)
Percentage of individuals using paid preparers for their 2020 taxes: 93.4%
Here:
93%
State:
93%
(% for various income ranges: 92.3% for AGIs below $25k, 94.8% for AGIs $25k-50k, 93.8% for AGIs $50k-75k, 92.8% for AGIs $75k-100k, 93.0% for AGIs $100k-200k, 92.6% for AGIs over 200k)
Averages for the 2012 tax year for zip code 89110, filed in 2013:
Average Adjusted Gross Income (AGI) in 2012: $35,113 (Individual Income Tax Returns)
Here:
$35,113
State:
$61,164
Salary/wage: $31,985 (reported on 86.5% of returns)
Here:
$31,985
State:
$45,924
(% of AGI for various income ranges: 78.2% for AGIs below $25k, 87.6% for AGIs $25k-50k, 82.6% for AGIs $50k-75k, 74.1% for AGIs $75k-100k, 72.6% for AGIs $100k-200k, 44.0% for AGIs over 200k)
Taxable interest for individuals: $970 (reported on 13.4% of returns)
This zip code:
$970
Nevada:
$3,137
(% of AGI for various income ranges: 0.3% for AGIs below $25k, 0.2% for AGIs $25k-50k, 0.3% for AGIs $50k-75k, 0.4% for AGIs $75k-100k, 0.5% for AGIs $100k-200k, 1.7% for AGIs over 200k)
Ordinary dividends: $4,831 (reported on 5.3% of returns)
Here:
$4,831
State:
$11,762
(% of AGI for various income ranges: 1.1% for AGIs below $25k, 0.5% for AGIs $25k-50k, 0.3% for AGIs $50k-75k, 0.6% for AGIs $75k-100k, 0.6% for AGIs $100k-200k, 2.8% for AGIs over 200k)
Net capital gain/loss in AGI: +$4,877 (reported on 4.0% of returns)
Here:
+$4,877
State:
+$33,127
(% of AGI for various income ranges: 0.1% for AGIs $50k-75k, 0.3% for AGIs $75k-100k, 0.9% for AGIs $100k-200k, 7.4% for AGIs over 200k)
Profit/loss from business: +$8,357 (reported on 13.8% of returns)
Here:
+$8,357
State:
+$12,567
(% of AGI for various income ranges: 10.6% for AGIs below $25k, 1.3% for AGIs $25k-50k, 1.0% for AGIs $50k-75k, 1.1% for AGIs $75k-100k, 1.9% for AGIs $100k-200k, 4.0% for AGIs over 200k)
Taxable individual retirement arrangement distribution: $13,903 (reported on 3.3% of returns)
89110:
$13,903
Nevada:
$20,808
(% of AGI for various income ranges: 0.6% for AGIs below $25k, 0.6% for AGIs $25k-50k, 1.1% for AGIs $50k-75k, 1.8% for AGIs $75k-100k, 2.8% for AGIs $100k-200k, 3.6% for AGIs over 200k)
Total itemized deductions: $19,973 (29% of AGI, reported on 17.7% of returns)
Here:
$19,973
State:
$26,148
Here:
28.6% of AGI
State:
20.0% of AGI
(% of AGI for various income ranges: 4.3% for AGIs below $25k, 8.0% for AGIs $25k-50k, 12.7% for AGIs $50k-75k, 12.7% for AGIs $75k-100k, 15.0% for AGIs $100k-200k, 14.9% for AGIs over 200k)
Charity contributions: $3,277 (reported on 14.2% of returns)
Here:
$3,277
State:
$4,329
(% of AGI for various income ranges: 0.3% for AGIs below $25k, 0.8% for AGIs $25k-50k, 1.4% for AGIs $50k-75k, 1.9% for AGIs $75k-100k, 2.8% for AGIs $100k-200k, 2.7% for AGIs over 200k)
Taxes paid: $3,197 (reported on 17.3% of returns)
89110:
$3,197
State:
$5,116
(% of AGI for various income ranges: 0.6% for AGIs below $25k, 1.3% for AGIs $25k-50k, 1.8% for AGIs $50k-75k, 2.1% for AGIs $75k-100k, 2.4% for AGIs $100k-200k, 2.8% for AGIs over 200k)
Earned income credit: $2,707 (reported on 29.7% of returns)
Here:
$2,707
State:
$2,279
(% of AGI for various income ranges: 8.8% for AGIs below $25k, 1.8% for AGIs $25k-50k)
Percentage of individuals using paid preparers for their 2012 taxes: 65.5%
Here:
66%
State:
55%
(% for various income ranges: 64.5% for AGIs below $25k, 68.6% for AGIs $25k-50k, 65.3% for AGIs $50k-75k, 61.2% for AGIs $75k-100k, 59.8% for AGIs $100k-200k, 73.3% for AGIs over 200k)
Averages for the 2004 tax year for zip code 89110, filed in 2005:
Average Adjusted Gross Income (AGI) in 2004: $36,968 (Individual Income Tax Returns)
Here:
$36,968
State:
$58,367
Salary/wage: $33,588 (reported on 91.6% of returns)
Here:
$33,588
State:
$42,695
(% of AGI for various income ranges: 102.1% for AGIs below $10k, 89.4% for AGIs $10k-25k, 90.7% for AGIs $25k-50k, 86.4% for AGIs $50k-75k, 83.9% for AGIs $75k-100k, 60.4% for AGIs over 100k)
Taxable interest for individuals: $1,427 (reported on 22.6% of returns)
This zip code:
$1,427
Nevada:
$3,867
(% of AGI for various income ranges: 1.9% for AGIs below $10k, 0.6% for AGIs $10k-25k, 0.5% for AGIs $25k-50k, 0.5% for AGIs $50k-75k, 0.5% for AGIs $75k-100k, 2.2% for AGIs over 100k)
Taxable dividends: $1,876 (reported on 7.6% of returns)
Here:
$1,876
State:
$5,770
(% of AGI for various income ranges: 0.8% for AGIs below $10k, 0.3% for AGIs $10k-25k, 0.2% for AGIs $25k-50k, 0.3% for AGIs $50k-75k, 0.4% for AGIs $75k-100k, 0.9% for AGIs over 100k)
Net capital gain/loss: +$16,915 (reported on 6.5% of returns)
Here:
+$16,915
State:
+$50,644
(% of AGI for various income ranges: -0.6% for AGIs below $10k, -0.1% for AGIs $10k-25k, 0.3% for AGIs $25k-50k, 0.6% for AGIs $50k-75k, 1.3% for AGIs $75k-100k, 13.9% for AGIs over 100k)
Profit/loss from business: +$7,298 (reported on 9.1% of returns)
Here:
+$7,298
State:
+$13,618
(% of AGI for various income ranges: 5.1% for AGIs below $10k, 2.7% for AGIs $10k-25k, 1.2% for AGIs $25k-50k, 1.3% for AGIs $50k-75k, 1.1% for AGIs $75k-100k, 2.9% for AGIs over 100k)
IRA payment deduction: $2,901 (reported on 1.2% of returns)
89110:
$2,901
Nevada:
$3,054
(% of AGI for various income ranges: 0.1% for AGIs $10k-25k, 0.1% for AGIs $25k-50k, 0.1% for AGIs $50k-75k, 0.1% for AGIs $75k-100k, 0.1% for AGIs over 100k)
Self-employed pension: $10,079 (reported on 0.1% of returns)
Here:
$10,079
Nevada:
$16,706
Total itemized deductions: $18,554 (31% of AGI, reported on 32.1% of returns)
Here:
$18,554
State:
$22,990
Here:
30.7% of AGI
State:
21.8% of AGI
(% of AGI for various income ranges: 7.1% for AGIs below $10k, 9.9% for AGIs $10k-25k, 16.8% for AGIs $25k-50k, 17.9% for AGIs $50k-75k, 20.0% for AGIs $75k-100k, 16.1% for AGIs over 100k)
Charity contributions deductions: $2,487 (4% of AGI, reported on 27.3% of returns)
Here:
$2,487
State:
$3,443
Here:
4.0% of AGI
State:
3.1% of AGI
(% of AGI for various income ranges: 0.4% for AGIs below $10k, 0.7% for AGIs $10k-25k, 1.4% for AGIs $25k-50k, 2.0% for AGIs $50k-75k, 2.7% for AGIs $75k-100k, 2.9% for AGIs over 100k)
Total tax: $4,264 (reported on 65.6% of returns)
89110:
$4,264
State:
$10,585
(% of AGI for various income ranges: 2.2% for AGIs below $10k, 3.0% for AGIs $10k-25k, 4.8% for AGIs $25k-50k, 7.1% for AGIs $50k-75k, 9.4% for AGIs $75k-100k, 15.5% for AGIs over 100k)
Earned income credit: $1,852 (reported on 23.0% of returns)
Here:
$1,852
State:
$1,676
Percentage of individuals using paid preparers for their 2004 taxes: 65.5%
Here:
65%
State:
60%
(% for various income ranges: 59.6% for AGIs below $10k, 68.3% for AGIs $10k-25k, 66.3% for AGIs $25k-50k, 65.7% for AGIs $50k-75k, 60.5% for AGIs $75k-100k, 65.5% for AGIs over 100k)
Likely homosexual households (counted as self-reported same-sex unmarried-partner households)
Lesbian couples: 0.3% of all households
Gay men: 0.0% of all households
Household received Food Stamps/SNAP in the past 12 months: 5,545 Household did not receive Food Stamps/SNAP in the past 12 months: 16,861
Women who had a birth in the past 12 months: 997 (693 now married, 301 unmarried) Women who did not have a birth in the past 12 months: 16,878 (5,233 now married, 11,706 unmarried)
Housing units in zip code 89110 with a mortgage: 6,842 (451 second mortgage, 20 home equity loan, 273 both second mortgage and home equity loan) Houses without a mortgage: 108
Median monthly owner costs for units with a mortgage: $1,451 Median monthly owner costs for units without a mortgage: $434
Residents with income below the poverty level in 2022:
This zip code:
20.4%
Whole state:
12.5%
Residents with income below 50% of the poverty level in 2022:
This zip code:
8.3%
Whole state:
5.9%
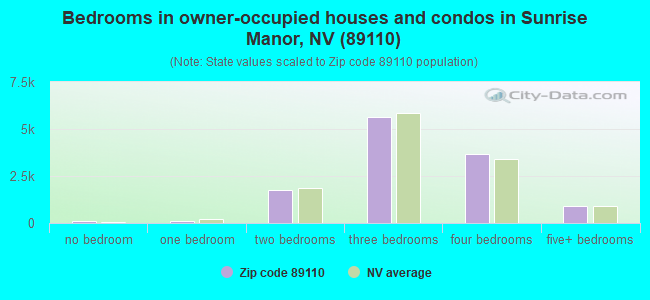
Median number of rooms in houses and condos:
Here:
5.7
State:
6.0
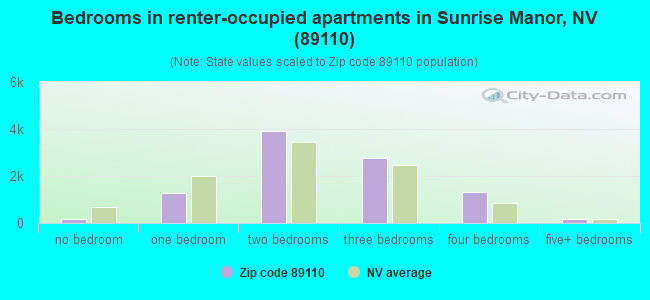
Median number of rooms in apartments:
Here:
4.4
State:
4.2
Notable locations in this zip code not listed on our city pages
Notable locations in zip code 89110: Stewart Square (A), Regency Plaza (B), Clark County Fire Department Station 16 (C), Sunrise Library (D), Sunrise Town Hall (E). Display/hide their locations on the map
Shopping Centers: Nellis Crossing Shopping Center (1), Nellis/Bonanza Shopping Center (2), Sunrise Marketplace Shopping Center (3), Charleston Commons Shopping Center (4). Display/hide their locations on the map
Churches in zip code 89110 include: Shekinah Glory Ministries (A), Saint Thomas Episcopal Church (B), Unity Baptist Church (C), The Universal Church (D), The Church of Jesus Christ of Latter Day Saints (E), Sunrise Congregation Kingdom Hall of Jehovahs Witnesses (F), Good Shephard Church of God in Christ (G), Full Gospel Las Vegas Korean Church (H), Church of Jesus Christ (I). Display/hide their locations on the map
Parks in zip code 89110 include: Earl Playground (1), Edwards Playground (2), Robison Community School Park (3), Stewart Place Park (4). Display/hide their locations on the map
7,970 married couples with children.
6,647 single-parent households (1,375 men, 5,272 women).
43.1% of residents of 89110 zip code speak English at home.
52.1% of residents speak Spanish at home (57% very well, 20% well, 18% not well, 6% not at all).
1.0% of residents speak other Indo-European language at home (70% very well, 30% well).
3.3% of residents speak Asian or Pacific Island language at home (45% very well, 31% well, 19% not well, 4% not at all).
0.6% of residents speak other language at home (10% very well, 55% well, 25% not well, 9% not at all).
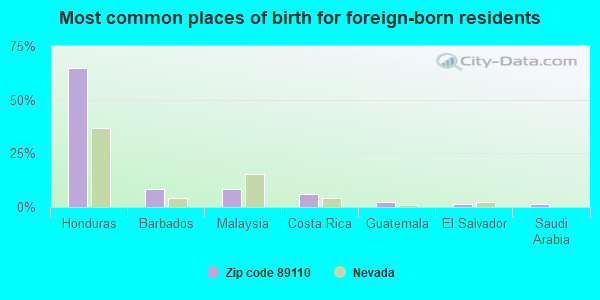
Foreign born population: 20,671 (30.2%) (41.0% of them are naturalized citizens)
This zip code:
30.2%
Whole state:
18.9%
65%Honduras
8%Barbados
8%Malaysia
6%Costa Rica
3%Guatemala
1%El Salvador
1%Saudi Arabia
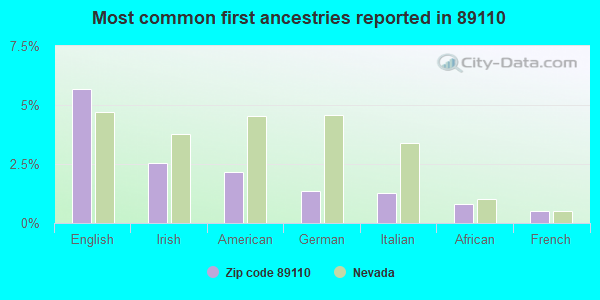
6%English
3%Irish
2%American
1%German
1%Italian
1%African
0%French
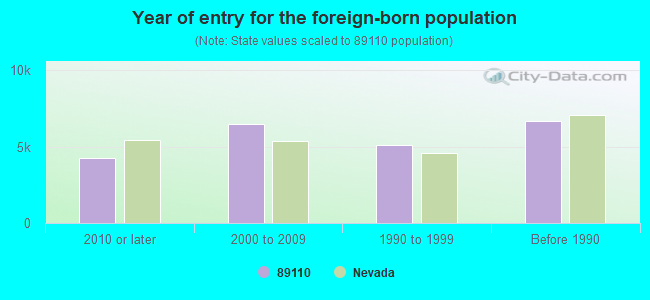
Year of entry for the foreign-born population
4,2312010 or later
6,4742000 to 2009
5,0861990 to 1999
6,667Before 1990
Major facilities with environmental interests located in this zip code:
KIRK L ADAMS ELEMENTARY SCHOOL (580 FOGG ST in LAS VEGAS, NV)
(Geographic Names Information System) (National Center for Education Statistics) - STATE ID-02-131 Organizations: CLARK CO SCH DIST (SCHOOL DISTRICT)
Alternative names: ADAMS, KIRK ELEM
ORAN GRAGSON ELEMENTARY SCHOOL (555 NORTH HONOLULU in LAS VEGAS, NV)
(Geographic Names Information System) (National Center for Education Statistics) - STATE ID-02-275 Organizations: CLARK CO SCH DIST (SCHOOL DISTRICT)
Alternative names: GRAGSON, ORAN ELEM
DELL ROBISON JUNIOR HIGH SCHOOL (825 MARION DR. in LAS VEGAS, NV)
(Geographic Names Information System) (National Center for Education Statistics) - STATE ID-02-315 Organizations: CLARK CO SCH DIST (SCHOOL DISTRICT)
Alternative names: ROBISON, DELL MIDSCH
ELBERT EDWARDS ELEMENTARY SCHOOL (4551 DIAMOND HEAD in LAS VEGAS, NV)
(Geographic Names Information System) (National Center for Education Statistics) - STATE ID-02-267 Organizations: CLARK CO SCH DIST (SCHOOL DISTRICT)
Alternative names: EDWARDS, ELBERT ELEM
ELDORADO HIGH SCHOOL (1139 N. LINN LANE in LAS VEGAS, NV)
(Geographic Names Information System) (National Center for Education Statistics) - STATE ID-02-410 Organizations: CLARK CO SCH DIST (SCHOOL DISTRICT)
Alternative names: ELDORADO HS
MIKE O'CALLAGHAN JUNIOR HIGH SCHOOL (1450 RADWICK DR in LAS VEGAS, NV)
(Geographic Names Information System) (National Center for Education Statistics) - STATE ID-02-322 Organizations: CLARK CO SCH DIST (SCHOOL DISTRICT)
Alternative names: O'CALLAGHAN, MIKE MIDSCH
IRA J EARL ELEMENTARY SCHOOL (1463 MARION WAY in LAS VEGAS, NV)
(Geographic Names Information System) (National Center for Education Statistics) - STATE ID-02-212 Organizations: CLARK CO SCH DIST (SCHOOL DISTRICT)
Alternative names: EARL, IRA ELEM
RICHARD J RUNDLE ELEMENTARY SCHOOL (425 N.CHRISTY LN in LAS VEGAS, NV)
(Geographic Names Information System) (National Center for Education Statistics) - STATE ID-02-128 Organizations: CLARK CO SCH DIST (SCHOOL DISTRICT)
Alternative names: RUNDLE, RICHARD ELEM
STANFORD ELEMENTARY SCHOOL (5350 HARRIS in LAS VEGAS, NV)
(Geographic Names Information System) (National Center for Education Statistics) - STATE ID-02-294 Organizations: CLARK CO SCH DIST (SCHOOL DISTRICT)
MOORE, WILLIAM ELEM (491 N. LAMB BOULEVARD in LAS VEGAS, NV)
(National Center for Education Statistics) - STATE ID-02-282 Organizations: CLARK CO SCH DIST (SCHOOL DISTRICT)
MORRIS, W & V CREDIT RETRIEVAL/BEHAV (3810 E. WASHINGTON in LAS VEGAS, NV)
(National Center for Education Statistics) - STATE ID-02-923 Organizations: CLARK CO SCH DIST (SCHOOL DISTRICT)
DESERT PINES HS (3800 HARRIS AVENUE in LAS VEGAS, NV)
(National Center for Education Statistics) - STATE ID-02-609 Organizations: CLARK CO SCH DIST (SCHOOL DISTRICT)
MORRIS - SUNSET EAST HS (3801 EAST WASHINGTON in LAS VEGAS, NV)
(National Center for Education Statistics) - STATE ID-02-408 Organizations: CLARK CO SCH DIST (SCHOOL DISTRICT)
Housing units lacking complete plumbing facilities: 1.9% Housing units lacking complete kitchen facilities: 2.9%
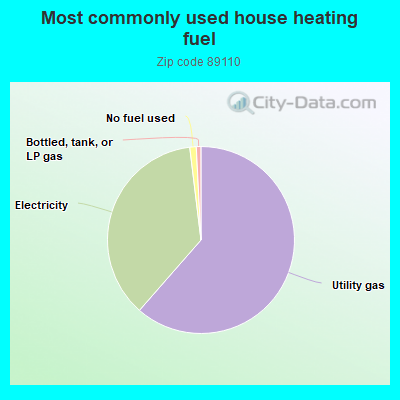
60.9%Utility gas
36.3%Electricity
1.1%No fuel used
0.8%Bottled, tank, or LP gas
Population in 1990: 43,396. Population change in the 1990s: +18,502 (+42.6%).
Place of birth for U.S.-born residents:
This state: 21,718
Northeast: 1,744
Midwest: 2,797
South: 3,066
West: 16,776
41% of the 89110 zip code residents lived in the same house 5 years ago. Out of people who lived in different houses, 66% lived in this county. Out of people who lived in different counties, 50% lived in Nevada.
92% of the 89110 zip code residents lived in the same house 1 year ago. Out of people who lived in different houses, 79% moved from this county. Out of people who lived in different houses, 1% moved from different county within same state. Out of people who lived in different houses, 22% moved from different state. Out of people who lived in different houses, 4% moved from abroad.
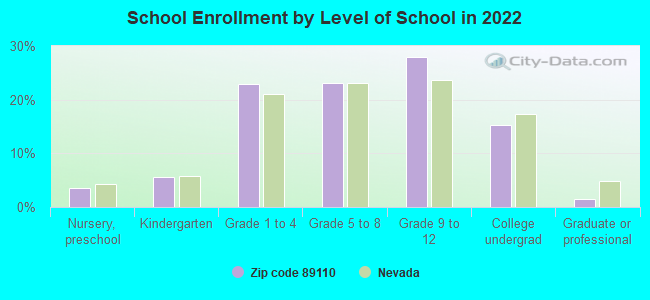
Private vs. public school enrollment:
Students in private schools in grades 1 to 8 (elementary and middle school): 310
Here:
4.3%
Nevada:
12.9%
Students in private schools in grades 9 to 12 (high school): 100
Here:
2.2%
Nevada:
6.9%
Students in private undergraduate colleges: 233
Here:
9.3%
Nevada:
16.0%
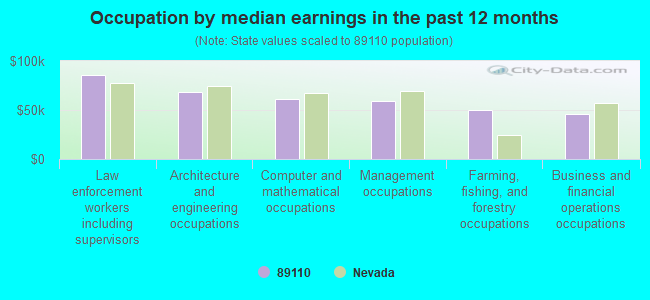
Occupation by median earnings in the past 12 months ($)
85,981Law enforcement workers including supervisors
68,439Architecture and engineering occupations
61,386Computer and mathematical occupations
59,567Management occupations
49,839Farming, fishing, and forestry occupations
46,391Business and financial operations occupations
Companies with federal contracts located in this zip code:
NEVADA SPORTS OFFICIALS ASSOC (694 REMINGTON DR STE B in LAS VEGAS, NV; small business) : $380,966 in 12 contractsfrom 2000 to 2006
Contracts for Other Management Support Services, Recreational Services, Other Professional Services by Air Force Signed by year:2000: -$38,000; 2001: $123,001; 2002: $53,915; 2003: $89,000; 2004: $78,251; 2005: $82,369; 2006: -$7,570.
Biggest contracts:
$123,001 with Air Force for Other Management Support Services. Signed on 2001-10-01. Completion date: 2002-09-30.
$89,000, same as above.Signed on 2003-10-01. Completion date: 2004-09-30.
$88,595, same as above.Signed on 2002-10-01. Completion date: 2003-09-30.
$54,000 with Air Force for Recreational Services. Signed on 2005-10-01. Completion date: 2006-09-30.
EVANS RECREATION INSTALLATIONS (5610 WINCHESTER CT in LAS VEGAS, NV)
$19,620 with Air Force for Construction of Structures and Facilities -- Family Housing Facilities. Signed on 2005-02-25. Completion date: 2005-04-06.
R A R ENTERPRISES LTD (5334 E MONROE AVE in LAS VEGAS, NV; small business) : $10,100 in 2 contractsfrom 2004 to 2005
$5,300 with Army for Fittings for Rope, Cable, and Chain. Signed on 2005-07-19. Completion date: 2005-08-30.
$4,800 with Army for Maintenance, Repair or Alteration of Real Property -- Other Industrial Buildings. Signed on 2004-09-30. Completion date: 2005-01-28.
Top industries in this zip code by the number of employees in 2005:
2002 - 2018 National Fire Incident Reporting System (NFIRS) incidents
According to the data from the years 2002 - 2018 the average number of fires per year is 252. The highest number of fires - 378 took place in 2018, and the least - 0 in 2003. The data has a growing trend.
When looking into fire subcategories, the most reports belonged to: Outside Fires (42.3%), and Structure Fires (39.8%).
Fire incident types reported to NFIRS in Zip Code 89110


 Nearest zip codes: 89142, 89156, 89104, 89122, 89121, 89191.
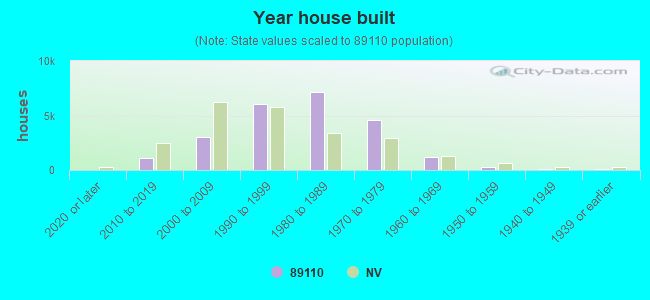


 According to the data from the years 2002 - 2018 the average number of fires per year is 252. The highest number of fires - 378 took place in 2018, and the least - 0 in 2003. The data has a growing trend.
 When looking into fire subcategories, the most reports belonged to: Outside Fires (42.3%), and Structure Fires (39.8%).