Estimated zip code population in 2022: 52,778 Zip code population in 2010: 45,720 Zip code population in 2000: 25,795
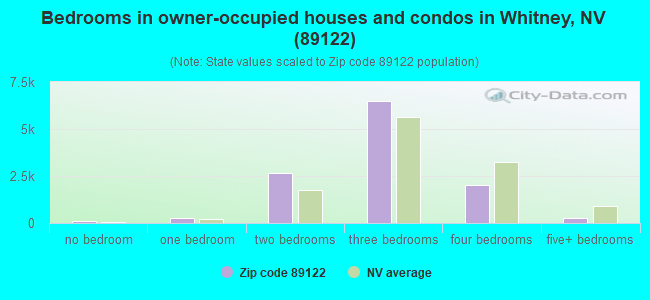
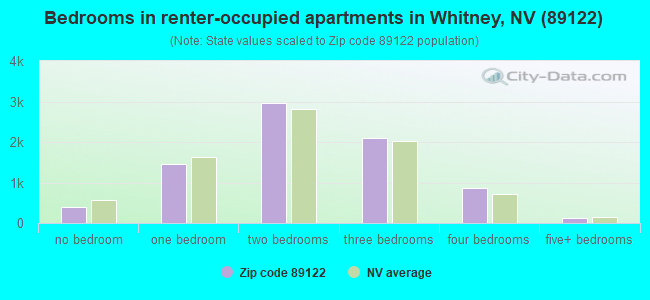
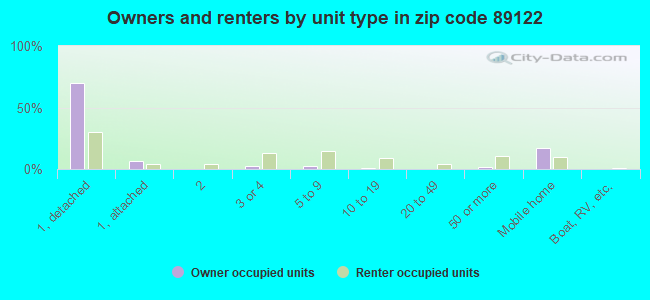
Houses and condos: 22,457 Renter-occupied apartments: 7,926
% of renters here:
40%
State:
40%
March 2022 cost of living index in zip code 89122: 98.3 (near average, U.S. average is 100)
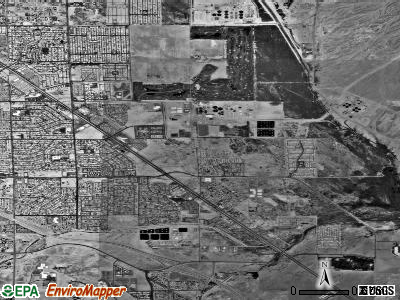
Land area: 9.1 sq. mi. Water area: 0.0 sq. mi.
Population density: 5,814 people per square mile
(average).
OSM Map
General Map
Google Map
MSN Map
OSM Map
General Map
Google Map
MSN Map
OSM Map
General Map
Google Map
MSN Map
OSM Map
General Map
Google Map
MSN Map
Please wait while loading the map...
Real estate property taxes paid for housing units in 2022:
This zip code:
0.3% ($976)
Nevada:
0.4% ($1,889)
Median real estate property taxes paid for housing units with mortgages in 2022: $1,175 (0.4%) Median real estate property taxes paid for housing units with no mortgage in 2022: $752 (0.3%)
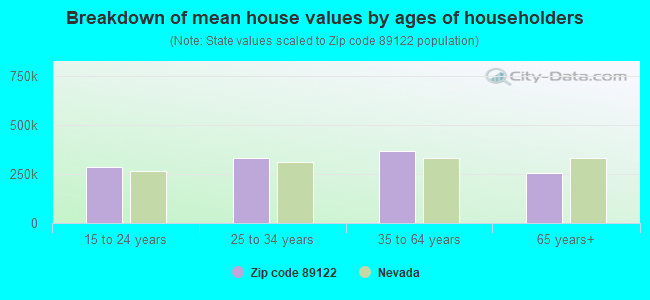
Estimated median house/condo value in 2022: $305,499
89122:
$305,499
Nevada:
$434,700
According to our research of Nevada and other state lists, there were 183 registered sex offenders living in 89122 zip code as of April 27, 2024. The ratio of all residents to sex offenders in zip code 89122 is 276 to 1. The ratio of registered sex offenders to all residents in this zip code is near the state average.
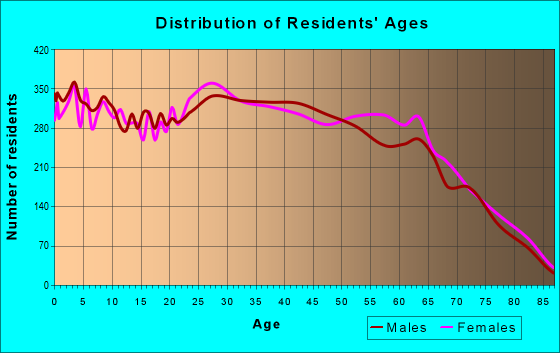
Median resident age:
This zip code:
38.4 years
Nevada median age:
39.0 years
Average household size:
This zip code:
2.7 people
Nevada:
2.6 people
Averages for the 2020 tax year for zip code 89122, filed in 2021:
Average Adjusted Gross Income (AGI) in 2020: $40,010 (Individual Income Tax Returns)
Here:
$40,010
State:
$78,964
Salary/wage: $34,248 (reported on 83.7% of returns)
Here:
$34,248
State:
$54,472
(% of AGI for various income ranges: 1138.8% for AGIs below $25k, 3274.6% for AGIs $25k-50k, 6022.1% for AGIs $50k-75k, 9045.2% for AGIs $75k-100k, 15147.4% for AGIs $100k-200k, 40688.0% for AGIs over 200k)
Taxable interest for individuals: $765 (reported on 13.0% of returns)
This zip code:
$765
Nevada:
$3,521
(% of AGI for various income ranges: 6.0% for AGIs below $25k, 6.4% for AGIs $25k-50k, 16.6% for AGIs $50k-75k, 25.5% for AGIs $75k-100k, 76.9% for AGIs $100k-200k, 594.0% for AGIs over 200k)
Ordinary dividends: $3,176 (reported on 6.0% of returns)
Here:
$3,176
State:
$13,390
(% of AGI for various income ranges: 5.9% for AGIs below $25k, 8.1% for AGIs $25k-50k, 26.2% for AGIs $50k-75k, 48.5% for AGIs $75k-100k, 113.0% for AGIs $100k-200k, 3442.0% for AGIs over 200k)
Net capital gain/loss in AGI: +$7,691 (reported on 6.7% of returns)
Here:
+$7,691
State:
+$63,025
(% of AGI for various income ranges: 0.6% for AGIs below $25k, 7.3% for AGIs $25k-50k, 41.0% for AGIs $50k-75k, 104.9% for AGIs $75k-100k, 452.5% for AGIs $100k-200k, 14168.0% for AGIs over 200k)
Profit/loss from business: +$3,408 (reported on 14.2% of returns)
Here:
+$3,408
State:
+$11,500
(% of AGI for various income ranges: 64.2% for AGIs below $25k, 26.4% for AGIs $25k-50k, 94.6% for AGIs $50k-75k, 113.2% for AGIs $75k-100k, 143.4% for AGIs $100k-200k, 1008.0% for AGIs over 200k)
Taxable individual retirement arrangement distribution: $16,396 (reported on 4.0% of returns)
89122:
$16,396
Nevada:
$23,628
(% of AGI for various income ranges: 26.2% for AGIs below $25k, 36.7% for AGIs $25k-50k, 90.0% for AGIs $50k-75k, 186.2% for AGIs $75k-100k, 669.4% for AGIs $100k-200k, 4914.0% for AGIs over 200k)
Total itemized deductions: $28,456 (reported on 4.1% of returns)
Here:
$28,456
State:
$44,173
(% of AGI for various income ranges: 20.9% for AGIs below $25k, 86.5% for AGIs $25k-50k, 279.9% for AGIs $50k-75k, 390.6% for AGIs $75k-100k, 858.6% for AGIs $100k-200k, 6952.0% for AGIs over 200k)
Charity contributions: $5,118 (reported on 3.2% of returns)
Here:
$5,118
State:
$12,589
(% of AGI for various income ranges: 1.9% for AGIs below $25k, 11.7% for AGIs $25k-50k, 38.2% for AGIs $50k-75k, 57.8% for AGIs $75k-100k, 147.7% for AGIs $100k-200k, 854.0% for AGIs over 200k)
Taxes paid: $4,625 (reported on 4.0% of returns)
89122:
$4,625
State:
$6,112
(% of AGI for various income ranges: 2.6% for AGIs below $25k, 16.3% for AGIs $25k-50k, 44.5% for AGIs $50k-75k, 68.2% for AGIs $75k-100k, 130.1% for AGIs $100k-200k, 730.0% for AGIs over 200k)
Earned income credit: $2,353 (reported on 24.2% of returns)
Here:
$2,353
State:
$2,214
(% of AGI for various income ranges: 110.8% for AGIs below $25k, 78.2% for AGIs $25k-50k, 1.2% for AGIs $50k-75k)
Percentage of individuals using paid preparers for their 2020 taxes: 93.4%
Here:
93%
State:
93%
(% for various income ranges: 92.9% for AGIs below $25k, 94.4% for AGIs $25k-50k, 92.9% for AGIs $50k-75k, 93.5% for AGIs $75k-100k, 91.6% for AGIs $100k-200k, 87.5% for AGIs over 200k)
Averages for the 2012 tax year for zip code 89122, filed in 2013:
Average Adjusted Gross Income (AGI) in 2012: $36,492 (Individual Income Tax Returns)
Here:
$36,492
State:
$61,164
Salary/wage: $33,212 (reported on 85.1% of returns)
Here:
$33,212
State:
$45,924
(% of AGI for various income ranges: 76.4% for AGIs below $25k, 85.6% for AGIs $25k-50k, 79.8% for AGIs $50k-75k, 76.0% for AGIs $75k-100k, 68.8% for AGIs $100k-200k, 28.2% for AGIs over 200k)
Taxable interest for individuals: $840 (reported on 16.2% of returns)
This zip code:
$840
Nevada:
$3,137
(% of AGI for various income ranges: 0.5% for AGIs below $25k, 0.3% for AGIs $25k-50k, 0.2% for AGIs $50k-75k, 0.4% for AGIs $75k-100k, 0.5% for AGIs $100k-200k, 0.9% for AGIs over 200k)
Ordinary dividends: $4,819 (reported on 7.1% of returns)
Here:
$4,819
State:
$11,762
(% of AGI for various income ranges: 1.7% for AGIs below $25k, 0.5% for AGIs $25k-50k, 0.5% for AGIs $50k-75k, 0.7% for AGIs $75k-100k, 1.1% for AGIs $100k-200k, 4.3% for AGIs over 200k)
Net capital gain/loss in AGI: +$2,056 (reported on 6.1% of returns)
Here:
+$2,056
State:
+$33,127
(% of AGI for various income ranges: 0.1% for AGIs $50k-75k, 0.2% for AGIs $75k-100k, 1.0% for AGIs $100k-200k, 6.9% for AGIs over 200k)
Profit/loss from business: +$6,370 (reported on 10.6% of returns)
Here:
+$6,370
State:
+$12,567
(% of AGI for various income ranges: 6.1% for AGIs below $25k, 0.8% for AGIs $25k-50k, 0.4% for AGIs $50k-75k, 0.7% for AGIs $75k-100k, 3.1% for AGIs $100k-200k)
Taxable individual retirement arrangement distribution: $13,978 (reported on 5.4% of returns)
89122:
$13,978
Nevada:
$20,808
(% of AGI for various income ranges: 1.6% for AGIs below $25k, 1.3% for AGIs $25k-50k, 2.0% for AGIs $50k-75k, 2.3% for AGIs $75k-100k, 4.1% for AGIs $100k-200k, 4.6% for AGIs over 200k)
Total itemized deductions: $17,769 (29% of AGI, reported on 20.5% of returns)
Here:
$17,769
State:
$26,148
Here:
29.2% of AGI
State:
20.0% of AGI
(% of AGI for various income ranges: 5.6% for AGIs below $25k, 9.2% for AGIs $25k-50k, 11.3% for AGIs $50k-75k, 12.0% for AGIs $75k-100k, 12.7% for AGIs $100k-200k, 13.9% for AGIs over 200k)
Charity contributions: $2,357 (reported on 16.3% of returns)
Here:
$2,357
State:
$4,329
(% of AGI for various income ranges: 0.5% for AGIs below $25k, 0.9% for AGIs $25k-50k, 1.3% for AGIs $50k-75k, 1.3% for AGIs $75k-100k, 1.5% for AGIs $100k-200k, 1.4% for AGIs over 200k)
Taxes paid: $2,755 (reported on 20.1% of returns)
89122:
$2,755
State:
$5,116
(% of AGI for various income ranges: 0.8% for AGIs below $25k, 1.4% for AGIs $25k-50k, 1.7% for AGIs $50k-75k, 1.8% for AGIs $75k-100k, 2.2% for AGIs $100k-200k, 1.6% for AGIs over 200k)
Earned income credit: $2,365 (reported on 25.1% of returns)
Here:
$2,365
State:
$2,279
(% of AGI for various income ranges: 7.1% for AGIs below $25k, 1.3% for AGIs $25k-50k)
Percentage of individuals using paid preparers for their 2012 taxes: 54.7%
Here:
55%
State:
55%
(% for various income ranges: 51.8% for AGIs below $25k, 56.6% for AGIs $25k-50k, 57.0% for AGIs $50k-75k, 56.5% for AGIs $75k-100k, 57.9% for AGIs $100k-200k, 75.0% for AGIs over 200k)
Averages for the 2004 tax year for zip code 89122, filed in 2005:
Average Adjusted Gross Income (AGI) in 2004: $35,689 (Individual Income Tax Returns)
Here:
$35,689
State:
$58,367
Salary/wage: $31,869 (reported on 87.0% of returns)
Here:
$31,869
State:
$42,695
(% of AGI for various income ranges: 108.7% for AGIs below $10k, 81.2% for AGIs $10k-25k, 85.5% for AGIs $25k-50k, 79.8% for AGIs $50k-75k, 78.1% for AGIs $75k-100k, 49.9% for AGIs over 100k)
Taxable interest for individuals: $1,475 (reported on 27.3% of returns)
This zip code:
$1,475
Nevada:
$3,867
(% of AGI for various income ranges: 3.2% for AGIs below $10k, 1.3% for AGIs $10k-25k, 0.6% for AGIs $25k-50k, 0.8% for AGIs $50k-75k, 0.9% for AGIs $75k-100k, 2.6% for AGIs over 100k)
Taxable dividends: $1,922 (reported on 10.8% of returns)
Here:
$1,922
State:
$5,770
(% of AGI for various income ranges: 2.2% for AGIs below $10k, 0.6% for AGIs $10k-25k, 0.3% for AGIs $25k-50k, 0.4% for AGIs $50k-75k, 0.5% for AGIs $75k-100k, 1.2% for AGIs over 100k)
Net capital gain/loss: +$6,854 (reported on 9.7% of returns)
Here:
+$6,854
State:
+$50,644
(% of AGI for various income ranges: -0.7% for AGIs below $10k, -0.1% for AGIs $10k-25k, 0.1% for AGIs $25k-50k, 0.9% for AGIs $50k-75k, 1.8% for AGIs $75k-100k, 9.5% for AGIs over 100k)
Profit/loss from business: +$5,116 (reported on 9.0% of returns)
Here:
+$5,116
State:
+$13,618
(% of AGI for various income ranges: 1.3% for AGIs below $10k, 1.9% for AGIs $10k-25k, 0.9% for AGIs $25k-50k, 1.3% for AGIs $50k-75k, 0.6% for AGIs $75k-100k, 2.0% for AGIs over 100k)
IRA payment deduction: $2,823 (reported on 1.5% of returns)
89122:
$2,823
Nevada:
$3,054
(% of AGI for various income ranges: 0.2% for AGIs $10k-25k, 0.1% for AGIs $25k-50k, 0.1% for AGIs $50k-75k, 0.1% for AGIs $75k-100k, 0.1% for AGIs over 100k)
Self-employed pension: $10,364 (reported on 0.1% of returns)
Here:
$10,364
Nevada:
$16,706
Total itemized deductions: $16,462 (29% of AGI, reported on 30.9% of returns)
Here:
$16,462
State:
$22,990
Here:
28.9% of AGI
State:
21.8% of AGI
(% of AGI for various income ranges: 13.2% for AGIs below $10k, 10.0% for AGIs $10k-25k, 14.6% for AGIs $25k-50k, 15.8% for AGIs $50k-75k, 16.7% for AGIs $75k-100k, 13.5% for AGIs over 100k)
Charity contributions deductions: $2,014 (3% of AGI, reported on 25.9% of returns)
Here:
$2,014
State:
$3,443
Here:
3.4% of AGI
State:
3.1% of AGI
(% of AGI for various income ranges: 0.6% for AGIs below $10k, 0.7% for AGIs $10k-25k, 1.3% for AGIs $25k-50k, 1.9% for AGIs $50k-75k, 1.9% for AGIs $75k-100k, 1.7% for AGIs over 100k)
Total tax: $4,241 (reported on 72.4% of returns)
89122:
$4,241
State:
$10,585
(% of AGI for various income ranges: 2.1% for AGIs below $10k, 3.4% for AGIs $10k-25k, 6.2% for AGIs $25k-50k, 8.6% for AGIs $50k-75k, 10.7% for AGIs $75k-100k, 18.0% for AGIs over 100k)
Earned income credit: $1,696 (reported on 18.9% of returns)
Here:
$1,696
State:
$1,676
Percentage of individuals using paid preparers for their 2004 taxes: 60.2%
Here:
60%
State:
60%
(% for various income ranges: 54.7% for AGIs below $10k, 62.4% for AGIs $10k-25k, 60.7% for AGIs $25k-50k, 59.3% for AGIs $50k-75k, 58.3% for AGIs $75k-100k, 68.9% for AGIs over 100k)
Likely homosexual households (counted as self-reported same-sex unmarried-partner households)
Lesbian couples: 0.3% of all households
Gay men: 0.5% of all households
Household received Food Stamps/SNAP in the past 12 months: 4,174 Household did not receive Food Stamps/SNAP in the past 12 months: 15,749
Women who had a birth in the past 12 months: 476 (275 now married, 182 unmarried) Women who did not have a birth in the past 12 months: 11,418 (4,735 now married, 6,678 unmarried)
Housing units in zip code 89122 with a mortgage: 7,139 (389 second mortgage, 28 home equity loan, 232 both second mortgage and home equity loan) Houses without a mortgage: 184
Median monthly owner costs for units with a mortgage: $1,322 Median monthly owner costs for units without a mortgage: $362
Residents with income below the poverty level in 2022:
This zip code:
16.2%
Whole state:
12.5%
Residents with income below 50% of the poverty level in 2022:
This zip code:
9.6%
Whole state:
5.9%
Median number of rooms in houses and condos:
Here:
5.2
State:
6.0
Median number of rooms in apartments:
Here:
4.3
State:
4.2
Notable locations in this zip code not listed on our city pages
Notable locations in zip code 89122: Clark County Fire Department Station 17 (A), Whitney Community Center (B), Whitney Library (C), Whitney Senior Center (D). Display/hide their locations on the map
Parks in zip code 89122 include: Whitney Park (1), Whitney Pool (2), Horsemans and Dog Fanciers Park (3), East Las Vegas Park (4). Display/hide their locations on the map
Tourist attraction (not listed on the city page) : Skymania Fun Center (Amusement & Theme Parks; 4915 Steptoe Street).
6,203 married couples with children.
3,234 single-parent households (675 men, 2,559 women).
58.3% of residents of 89122 zip code speak English at home.
30.8% of residents speak Spanish at home (58% very well, 19% well, 17% not well, 6% not at all).
1.9% of residents speak other Indo-European language at home (76% very well, 18% well, 5% not well, 1% not at all).
9.0% of residents speak Asian or Pacific Island language at home (63% very well, 30% well, 6% not well, 1% not at all).
0.7% of residents speak other language at home (36% very well, 29% well, 35% not well).
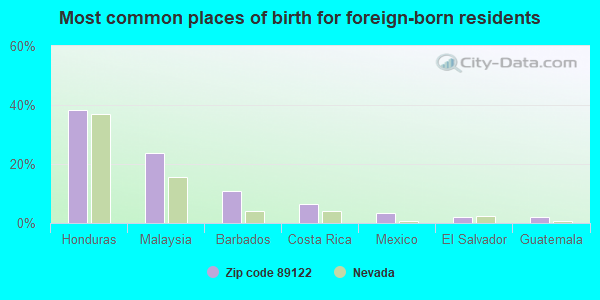
Foreign born population: 14,312 (27.1%) (55.6% of them are naturalized citizens)
This zip code:
27.1%
Whole state:
18.9%
38%Honduras
24%Malaysia
11%Barbados
6%Costa Rica
3%Mexico
2%El Salvador
2%Guatemala
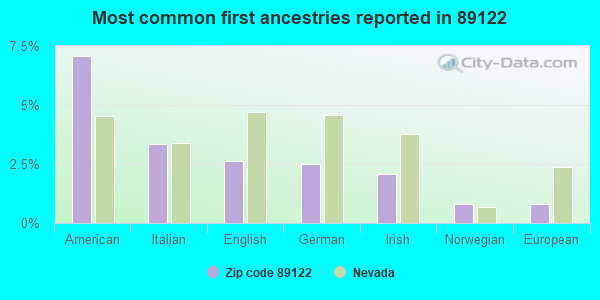
7%American
3%Italian
3%English
3%German
2%Irish
1%Norwegian
1%European
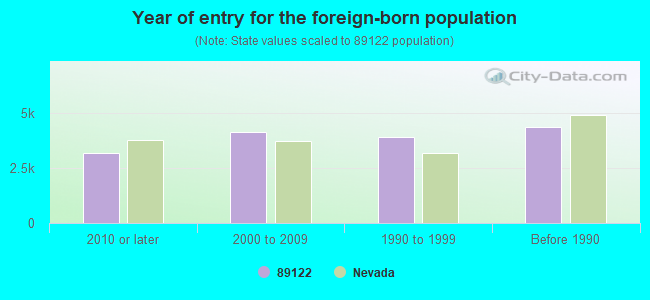
Year of entry for the foreign-born population
3,1852010 or later
4,1412000 to 2009
3,9081990 to 1999
4,337Before 1990
Major facilities with environmental interests located in this zip code:
CLARK STATION (5640 STEPHANIE STREET in LAS VEGAS, NV)
AIR MAJOR (AIRS/AFS) AIR PROGRAM (Clean Air Markets Division Business System) (Integrated Compliance Information System) - ICIS-09-1978-0009, FORMAL ENFORCEMENT ACTION CRITERIA AND HAZARDOUS AIR POLLUTANT INVENTORY (Inventory of air pollution sources) STATE MASTER (NV-FP) - STORMWATER-ISW-121, NPDES STORMWATER PERMIT Small Quantity Generators, between 100 kg and 1000 kg of hazardous waste/month (Resource Conservation and Recovery Act (tracking hazardous waste)) - notification Business SIC classification: ELECTRIC SERVICES Organizations: NEVADA POWER COMPANY (CONTACT/OPERATOR)
, CLARK GENERATIN STATION (CONTACT/OPERATOR)
, NEVADA POWER CO (CONTACT/OWNER)
, NEVADA POWER COMPANY (OWNER/OPERATOR)
Alternative names: DUCK CREEK, NEVADA POWER CO CLARK STATION
SUNRISE STATION (6300 VEGAS VALLEY DRIVE in LAS VEGAS, NV)
AIR MAJOR (AIRS/AFS) AIR PROGRAM (Clean Air Markets Division Business System) (Integrated Compliance Information System) - ICIS-09-1978-0009, FORMAL ENFORCEMENT ACTION CRITERIA AND HAZARDOUS AIR POLLUTANT INVENTORY (Inventory of air pollution sources) STATE MASTER (NV-FP) - STORMWATER-ISW-123, NPDES STORMWATER PERMIT Conditionally Exempt Small Quantity Generators, less than 100 kg/month of hazardous waste (Resource Conservation and Recovery Act (tracking hazardous waste)) Business SIC classification: ELECTRIC SERVICES Organizations: NEVADA POWER COMPANY (CONTACT/OPERATOR)
, SUNRISE GENERATING STATION (CONTACT/OPERATOR)
, NEVADA POWER CO (CONTACT/OWNER)
, NEVADA POWER COMPANY (OWNER/OPERATOR)
Alternative names: NEVADA POWER COMPANY SUNRISE STATION, NEVADA POWER - SUNRISE (ST.OF NV), SITE ID 320031004, SUNRISE POWER STATION SITE 320031004
CYNTHIA CUNNINGHAM ELEMENTARY SCHOOL (4145 JIMMY DURANTE in LAS VEGAS, NV)
(Geographic Names Information System) (National Center for Education Statistics) - STATE ID-02-125 Organizations: CLARK CO SCH DIST (SCHOOL DISTRICT)
Alternative names: CUNNINGHAM, CYNTHIA ELEM
CLARK COUNTY TRAFFIC OPERATIONS (4324 STEPHANIE ST in LAS VEGAS, NV)
HAZARDOUS WASTE BIENNIAL REPORTER (Resource Conservation and Recovery Act (tracking hazardous waste)) Large Quantity Generators, more that 1000 kg of hazardous waste/month (Resource Conservation and Recovery Act (tracking hazardous waste)) Organizations: CLARK CO TRAFFIC OPERATIONS (CONTACT/OPERATOR)
, CLARK COUNTY BD OF COMM (CONTACT/OWNER)
, COUNTY OF CLARK NEVADA (CONTACT/OWNER)
CORTNEY, FRANCIS MIDSCH (5301 HACIENDA AV. in LAS VEGAS, NV)
(National Center for Education Statistics) - STATE ID-02-335 Organizations: CLARK CO SCH DIST (SCHOOL DISTRICT)
GOLDFARB, DON ELEM (1651 ORCHARD VALLEY DRIVE in LAS VEGAS, NV)
(National Center for Education Statistics) - STATE ID-02-153 Organizations: CLARK CO SCH DIST (SCHOOL DISTRICT)
SMITH, HAL ELEM (5150 E. DESERT INN ROAD in LAS VEGAS, NV)
(National Center for Education Statistics) - STATE ID-02-284 Organizations: CLARK CO SCH DIST (SCHOOL DISTRICT)
CHARLESTON DRMO SITE (6274 E CHARLESTON BLVD in LAS VEGAS, NV)
(Integrated Compliance Information System) - ICIS-09-1997-0041, FORMAL ENFORCEMENT ACTION
LAS VEGAS WWTP (6005 EAST VEGAS VALLEY DRIVE in LAS VEGAS, NV)
National Pollutant Discharge Elimination System MAJOR (Tracking pollutant discharge elimination systems) - permit Conditionally Exempt Small Quantity Generators, less than 100 kg/month of hazardous waste (Resource Conservation and Recovery Act (tracking hazardous waste)) Business SIC classification: SEWERAGE SYSTEMS Business NAICS classification: OTHER AUTOMOTIVE MECHANICAL AND ELECTRICAL REPAIR AND MAINTENANCE. Organizations: LAS VEGAS, CITY OF (CONTACT/OWNER)
, LAS VEGAS CITY OF WASTE WATER PLANT (CONTACT/OWNER)
Alternative names: CITY OF LAS VEGAS WATER TREATMENT FACILITY, LAS VEGAS, CITY OF, LAS VEGAS CITY OF WASTE WATER PLANT
NEVADA READY MIX (6700 E VEGAS VALLEY DR in LAS VEGAS, NV)
AIR MAJOR ("Best Available" air pollution technologies tracking) (Resource Conservation and Recovery Act (tracking hazardous waste)) Business SIC and NAICS classification: CONSTRUCTION SAND AND GRAVEL Organizations: STEWART NIEL (CONTACT/OWNER)
Alternative names: NEVADA READY MIX - LONE MOUNTAIN ROAD FACILITY, NEVADA READY MIX - LONE MOUNTAIN ROAD FACILITY
NEVADA SUN PEAK LTD PARTNERSHIP (6350 VEGAS VALLEY DR in LAS VEGAS, NV)
AIR MAJOR (AIRS/AFS) (Resource Conservation and Recovery Act (tracking hazardous waste)) Business SIC classification: ELECTRIC SERVICES Business NAICS classification: OTHER ELECTRIC POWER GENERATION. Organizations: NEVADA SUN-PEAK LIMITED PARTNERSHIP (CONTACT/OPERATOR)
Alternative names: NEVADA SUN PEAK POWER PLANT
BUD C HEIL (6060 BOULDER HWY in LAS VEGAS, NV)
(Resource Conservation and Recovery Act (tracking hazardous waste))
CLARK COUNTY AUTOMOTIVE (4241 STEPHANIE ST in LAS VEGAS, NV)
(Resource Conservation and Recovery Act (tracking hazardous waste)) Organizations: BOARD OF CO COMMISSIONERS (CONTACT/OPERATOR)
Housing units lacking complete plumbing facilities: 0.5% Housing units lacking complete kitchen facilities: 1.2%
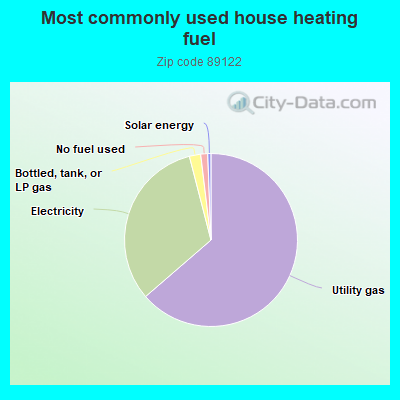
63.4%Utility gas
32.2%Electricity
2.1%Bottled, tank, or LP gas
1.3%No fuel used
0.6%Solar energy
Population in 1990: 27,409.
Place of birth for U.S.-born residents:
This state: 12,052
Northeast: 3,565
Midwest: 5,464
South: 3,043
West: 12,949
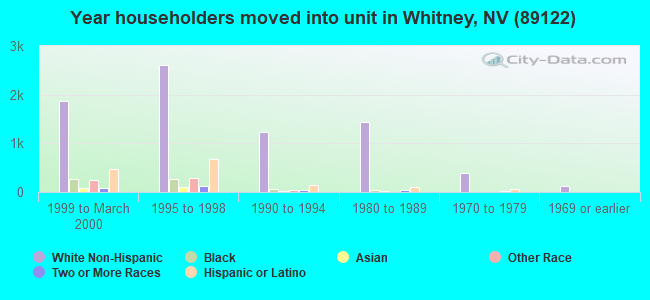
39% of the 89122 zip code residents lived in the same house 5 years ago. Out of people who lived in different houses, 54% lived in this county. Out of people who lived in different counties, 50% lived in Nevada.
88% of the 89122 zip code residents lived in the same house 1 year ago. Out of people who lived in different houses, 67% moved from this county. Out of people who lived in different houses, 0% moved from different county within same state. Out of people who lived in different houses, 31% moved from different state. Out of people who lived in different houses, 2% moved from abroad.
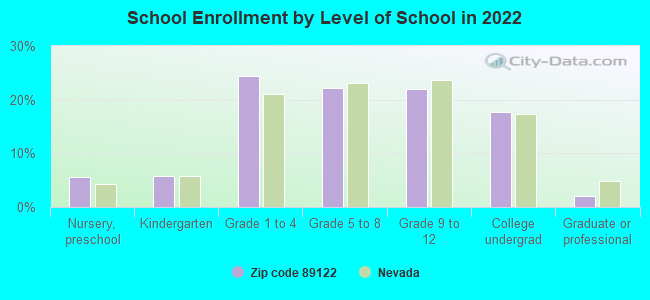
Private vs. public school enrollment:
Students in private schools in grades 1 to 8 (elementary and middle school): 737
Here:
13.6%
Nevada:
12.9%
Students in private schools in grades 9 to 12 (high school): 232
Here:
9.1%
Nevada:
6.9%
Students in private undergraduate colleges: 354
Here:
17.3%
Nevada:
16.0%
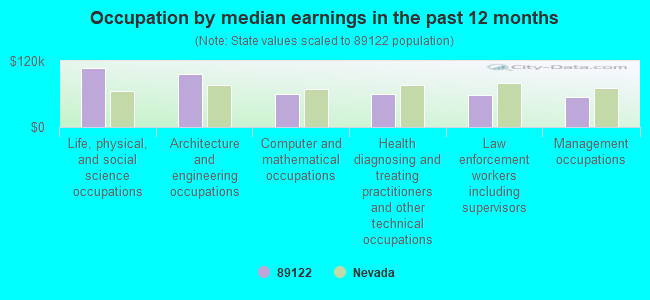
Occupation by median earnings in the past 12 months ($)
107,831Life, physical, and social science occupations
95,500Architecture and engineering occupations
60,608Computer and mathematical occupations
59,211Health diagnosing and treating practitioners and other technical occupations
58,929Law enforcement workers including supervisors
53,655Management occupations
Companies with federal contracts located in this zip code (LAS VEGAS, NV):
POSITIVE ACCESS, INC (4975 STEPTOE, SUITE 600) : $6,612,833 in 17 contractsfrom 2000 to 2005
Contracts for Other Housekeeping Services, Landscaping/Groundskeeping Services by Defense Commissary Agency, Department of Defense, ENERGY, Department of Signed by year:2000: $967,438; 2001: $1,004,764; 2002: -$43,000; 2003: $1,831,533; 2004: $1,838,163; 2005: $1,013,935; 2006: $0.
Biggest contracts:
$1,716,358 with Defense Commissary Agency for Other Housekeeping Services. Signed on 2004-04-30. Completion date: 2004-04-30.
$1,657,146 with Department of Defense for Other Housekeeping Services. Signed on 2003-03-20. Completion date: 2004-04-30.
$967,438, same as above.Signed on 2000-10-02. Completion date: 2000-12-31.
$756,856 with Defense Commissary Agency for Other Housekeeping Services. Signed on 2005-04-29. Completion date: 2004-04-30.
CLARK COUNTY SANITATION DST (5857 E FLAMINGO RD) : $2,658,204 in 5 contractsfrom 2000 to 2003
Contracts for Other Utilities by Air Force Signed by year:2000: $337,676; 2001: $918,317; 2002: $568,008; 2003: $834,203; 2004: $0; 2005: $0; 2006: $0.
Biggest contracts:
$834,203 with Air Force for Other Utilities. Signed on 2003-09-27. Completion date: 2003-09-30.
$568,008, same as above.Signed on 2002-09-30. Completion date: 2002-09-30.
$496,372, same as above.Signed on 2001-09-29. Completion date: 2001-09-29.
$421,945, same as above.Signed on 2001-02-07. Completion date: 2001-02-07.
AMBROSIA LANDS HOSPITALITY INC (5288 BOULDER HWY) : $210,464 in 6 contractsfrom 1999 to 2001
Contracts for Lodging - Hotel/Motel by Air Force, Navy Signed by year:2000: $142,768; 2001: $37,296; 2002: $0; 2003: $0; 2004: $0; 2005: $0; 2006: $0.
Biggest contracts:
$40,000 with Air Force for Lodging - Hotel/Motel. Signed on 2000-04-05. Completion date: 2000-04-22.
$37,296 with Navy for Lodging - Hotel/Motel. Signed on 2001-01-22. Completion date: 2001-02-10.
$35,000 with Air Force for Lodging - Hotel/Motel. Signed on 2000-03-21. Completion date: 2000-04-08.
$34,000, same as above.Signed on 2000-02-01. Completion date: 2000-02-19.
ESQUIRE LTD INC (5255 BOULDER HWY; small business)
$32,143 with Air Force for Lodging - Hotel/Motel. Signed on 2001-08-06. Completion date: 2000-11-11.
SIENA SUITES (6555 BOULDER HWY; small business) : $31,284 in 2 contractsin 2005
$29,106 with Army for Lease or Rental of Facilities -- Recreation Facilities (Non-Building). Taking place in TX. Signed on 2005-02-22. Completion date: 2005-03-31.
$2,178, same as above.Signed on 2005-02-28. Completion date: 2005-03-31.
ELITE MANAGEMENT GROUP (5050 STEPTOE ST UNIT C; small business)
$26,700 with Air Force for Purchase of Structures and Facilities -- Conference Space and Facilities. Signed on 2005-05-24. Completion date: 2005-06-18.
Top industries in this zip code by the number of employees in 2005:
2002 - 2018 National Fire Incident Reporting System (NFIRS) incidents
According to the data from the years 2002 - 2018 the average number of fires per year is 168. The highest number of fires - 283 took place in 2018, and the least - 0 in 2003. The data has a growing trend.
When looking into fire subcategories, the most reports belonged to: Outside Fires (52.7%), and Structure Fires (29.7%).
Fire incident types reported to NFIRS in Zip Code 89122
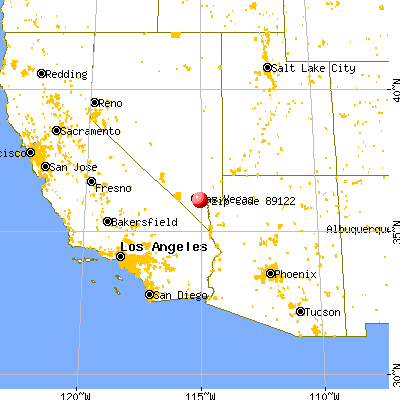


 Nearest zip codes: 89142, 89014, 89121, 89120, 89110, 89011.


 According to the data from the years 2002 - 2018 the average number of fires per year is 168. The highest number of fires - 283 took place in 2018, and the least - 0 in 2003. The data has a growing trend.
 When looking into fire subcategories, the most reports belonged to: Outside Fires (52.7%), and Structure Fires (29.7%).