Estimated zip code population in 2022: 42,443 Zip code population in 2010: 36,922 Zip code population in 2000: 81,839
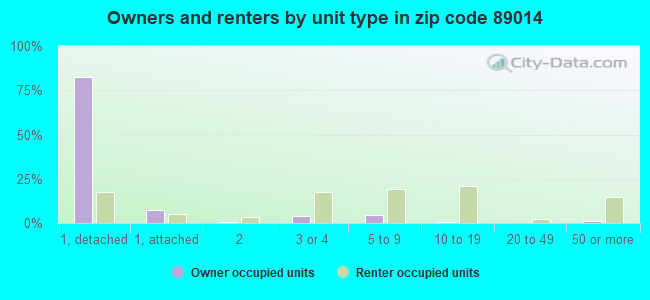
Houses and condos: 18,320 Renter-occupied apartments: 8,203
% of renters here:
48%
State:
40%
March 2022 cost of living index in zip code 89014: 99.7 (near average, U.S. average is 100)
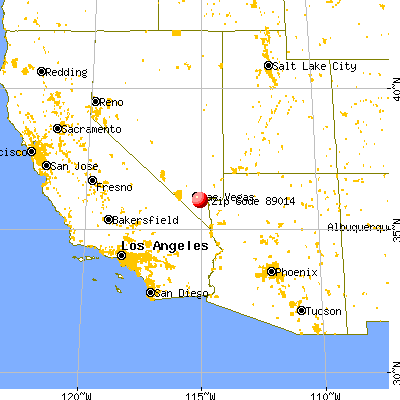
Land area: 7.6 sq. mi. Water area: 0.0 sq. mi.
Population density: 5,601 people per square mile
(average).
OSM Map
General Map
Google Map
MSN Map
OSM Map
General Map
Google Map
MSN Map
OSM Map
General Map
Google Map
MSN Map
OSM Map
General Map
Google Map
MSN Map
Please wait while loading the map...
Real estate property taxes paid for housing units in 2022:
This zip code:
0.4% ($1,839)
Nevada:
0.4% ($1,889)
Median real estate property taxes paid for housing units with mortgages in 2022: $1,810 (0.4%) Median real estate property taxes paid for housing units with no mortgage in 2022: $1,895 (0.4%)
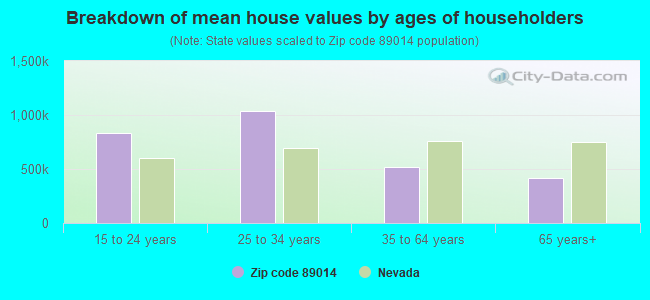
Estimated median house/condo value in 2022: $439,468
89014:
$439,468
Nevada:
$434,700
According to our research of Nevada and other state lists, there were 56 registered sex offenders living in 89014 zip code as of April 26, 2024. The ratio of all residents to sex offenders in zip code 89014 is 705 to 1. The ratio of registered sex offenders to all residents in this zip code is lower than the state average.
Median resident age:
This zip code:
39.1 years
Nevada median age:
39.0 years
Average household size:
This zip code:
2.5 people
Nevada:
2.6 people
Averages for the 2020 tax year for zip code 89014, filed in 2021:
Average Adjusted Gross Income (AGI) in 2020: $64,285 (Individual Income Tax Returns)
Here:
$64,285
State:
$78,964
Salary/wage: $49,049 (reported on 83.6% of returns)
Here:
$49,049
State:
$54,472
(% of AGI for various income ranges: 1166.0% for AGIs below $25k, 3461.0% for AGIs $25k-50k, 6454.9% for AGIs $50k-75k, 9445.5% for AGIs $75k-100k, 17863.0% for AGIs $100k-200k, 73930.5% for AGIs over 200k)
Taxable interest for individuals: $1,929 (reported on 20.6% of returns)
This zip code:
$1,929
Nevada:
$3,521
(% of AGI for various income ranges: 8.3% for AGIs below $25k, 9.8% for AGIs $25k-50k, 27.5% for AGIs $50k-75k, 42.5% for AGIs $75k-100k, 100.2% for AGIs $100k-200k, 2668.9% for AGIs over 200k)
Ordinary dividends: $6,498 (reported on 12.2% of returns)
Here:
$6,498
State:
$13,390
(% of AGI for various income ranges: 16.5% for AGIs below $25k, 21.0% for AGIs $25k-50k, 57.6% for AGIs $50k-75k, 98.3% for AGIs $75k-100k, 246.0% for AGIs $100k-200k, 4868.4% for AGIs over 200k)
Net capital gain/loss in AGI: +$27,466 (reported on 13.2% of returns)
Here:
+$27,466
State:
+$63,025
(% of AGI for various income ranges: 7.3% for AGIs below $25k, 17.3% for AGIs $25k-50k, 64.7% for AGIs $50k-75k, 168.6% for AGIs $75k-100k, 511.0% for AGIs $100k-200k, 34431.1% for AGIs over 200k)
Profit/loss from business: +$9,182 (reported on 16.3% of returns)
Here:
+$9,182
State:
+$11,500
(% of AGI for various income ranges: 91.7% for AGIs below $25k, 83.0% for AGIs $25k-50k, 211.7% for AGIs $50k-75k, 353.2% for AGIs $75k-100k, 533.0% for AGIs $100k-200k, 3602.6% for AGIs over 200k)
Taxable individual retirement arrangement distribution: $19,595 (reported on 5.6% of returns)
89014:
$19,595
Nevada:
$23,628
(% of AGI for various income ranges: 29.0% for AGIs below $25k, 42.5% for AGIs $25k-50k, 129.3% for AGIs $50k-75k, 268.6% for AGIs $75k-100k, 578.0% for AGIs $100k-200k, 2997.9% for AGIs over 200k)
Self-employed (Keogh) retirement plans: $28,600 (reported on 0.2% of returns)
89014:
$28,600
Nevada:
$26,634
(% of AGI for various income ranges: 16.2% for AGIs $50k-75k, 412.6% for AGIs over 200k)
Total itemized deductions: $52,101 (reported on 7.1% of returns)
Here:
$52,101
State:
$44,173
(% of AGI for various income ranges: 29.7% for AGIs below $25k, 98.9% for AGIs $25k-50k, 316.5% for AGIs $50k-75k, 580.0% for AGIs $75k-100k, 1060.2% for AGIs $100k-200k, 23180.0% for AGIs over 200k)
Charity contributions: $8,572 (reported on 5.7% of returns)
Here:
$8,572
State:
$12,589
(% of AGI for various income ranges: 2.3% for AGIs below $25k, 13.7% for AGIs $25k-50k, 52.2% for AGIs $50k-75k, 86.9% for AGIs $75k-100k, 208.9% for AGIs $100k-200k, 2458.4% for AGIs over 200k)
Taxes paid: $5,445 (reported on 7.0% of returns)
89014:
$5,445
State:
$6,112
(% of AGI for various income ranges: 3.8% for AGIs below $25k, 18.3% for AGIs $25k-50k, 53.2% for AGIs $50k-75k, 104.0% for AGIs $75k-100k, 183.3% for AGIs $100k-200k, 1087.9% for AGIs over 200k)
Earned income credit: $1,997 (reported on 16.4% of returns)
Here:
$1,997
State:
$2,214
(% of AGI for various income ranges: 78.3% for AGIs below $25k, 56.2% for AGIs $25k-50k, 1.2% for AGIs $50k-75k)
Percentage of individuals using paid preparers for their 2020 taxes: 93.5%
Here:
94%
State:
93%
(% for various income ranges: 93.4% for AGIs below $25k, 94.4% for AGIs $25k-50k, 93.0% for AGIs $50k-75k, 92.9% for AGIs $75k-100k, 93.4% for AGIs $100k-200k, 91.3% for AGIs over 200k)
Averages for the 2012 tax year for zip code 89014, filed in 2013:
Average Adjusted Gross Income (AGI) in 2012: $51,924 (Individual Income Tax Returns)
Here:
$51,924
State:
$61,164
Salary/wage: $42,589 (reported on 86.8% of returns)
Here:
$42,589
State:
$45,924
(% of AGI for various income ranges: 79.1% for AGIs below $25k, 86.3% for AGIs $25k-50k, 79.9% for AGIs $50k-75k, 77.7% for AGIs $75k-100k, 75.1% for AGIs $100k-200k, 34.7% for AGIs over 200k)
Taxable interest for individuals: $1,658 (reported on 21.3% of returns)
This zip code:
$1,658
Nevada:
$3,137
(% of AGI for various income ranges: 0.6% for AGIs below $25k, 0.3% for AGIs $25k-50k, 0.4% for AGIs $50k-75k, 0.4% for AGIs $75k-100k, 0.6% for AGIs $100k-200k, 1.7% for AGIs over 200k)
Ordinary dividends: $6,619 (reported on 11.8% of returns)
Here:
$6,619
State:
$11,762
(% of AGI for various income ranges: 1.7% for AGIs below $25k, 0.6% for AGIs $25k-50k, 0.7% for AGIs $50k-75k, 0.7% for AGIs $75k-100k, 1.3% for AGIs $100k-200k, 3.9% for AGIs over 200k)
Net capital gain/loss in AGI: +$14,595 (reported on 10.8% of returns)
Here:
+$14,595
State:
+$33,127
(% of AGI for various income ranges: 0.3% for AGIs $50k-75k, 0.4% for AGIs $75k-100k, 1.0% for AGIs $100k-200k, 14.5% for AGIs over 200k)
Profit/loss from business: +$11,196 (reported on 13.2% of returns)
Here:
+$11,196
State:
+$12,567
(% of AGI for various income ranges: 6.4% for AGIs below $25k, 2.1% for AGIs $25k-50k, 1.9% for AGIs $50k-75k, 1.5% for AGIs $75k-100k, 2.9% for AGIs $100k-200k, 3.5% for AGIs over 200k)
Taxable individual retirement arrangement distribution: $16,971 (reported on 6.3% of returns)
89014:
$16,971
Nevada:
$20,808
(% of AGI for various income ranges: 1.6% for AGIs below $25k, 1.3% for AGIs $25k-50k, 1.7% for AGIs $50k-75k, 2.5% for AGIs $75k-100k, 2.9% for AGIs $100k-200k, 2.3% for AGIs over 200k)
Self-employment retirement plans: $22,133 (reported on 0.2% of returns)
89014:
$22,133
Nevada:
$22,197
Total itemized deductions: $23,581 (23% of AGI, reported on 25.1% of returns)
Here:
$23,581
State:
$26,148
Here:
22.8% of AGI
State:
20.0% of AGI
(% of AGI for various income ranges: 7.5% for AGIs below $25k, 8.2% for AGIs $25k-50k, 11.5% for AGIs $50k-75k, 12.5% for AGIs $75k-100k, 13.9% for AGIs $100k-200k, 13.2% for AGIs over 200k)
Charity contributions: $3,935 (reported on 20.6% of returns)
Here:
$3,935
State:
$4,329
(% of AGI for various income ranges: 0.6% for AGIs below $25k, 0.9% for AGIs $25k-50k, 1.2% for AGIs $50k-75k, 1.5% for AGIs $75k-100k, 2.0% for AGIs $100k-200k, 2.7% for AGIs over 200k)
Taxes paid: $3,824 (reported on 24.5% of returns)
89014:
$3,824
State:
$5,116
(% of AGI for various income ranges: 1.1% for AGIs below $25k, 1.2% for AGIs $25k-50k, 1.7% for AGIs $50k-75k, 2.2% for AGIs $75k-100k, 2.5% for AGIs $100k-200k, 1.9% for AGIs over 200k)
Earned income credit: $2,054 (reported on 18.6% of returns)
Here:
$2,054
State:
$2,279
(% of AGI for various income ranges: 5.5% for AGIs below $25k, 1.0% for AGIs $25k-50k)
Percentage of individuals using paid preparers for their 2012 taxes: 49.6%
Here:
50%
State:
55%
(% for various income ranges: 45.7% for AGIs below $25k, 47.6% for AGIs $25k-50k, 51.8% for AGIs $50k-75k, 54.7% for AGIs $75k-100k, 59.5% for AGIs $100k-200k, 77.8% for AGIs over 200k)
Averages for the 2004 tax year for zip code 89014, filed in 2005:
Average Adjusted Gross Income (AGI) in 2004: $69,058 (Individual Income Tax Returns)
Here:
$69,058
State:
$58,367
Salary/wage: $45,796 (reported on 87.7% of returns)
Here:
$45,796
State:
$42,695
(% of AGI for various income ranges: 107.4% for AGIs below $10k, 84.1% for AGIs $10k-25k, 86.1% for AGIs $25k-50k, 83.0% for AGIs $50k-75k, 80.9% for AGIs $75k-100k, 38.0% for AGIs over 100k)
Taxable interest for individuals: $5,204 (reported on 34.3% of returns)
This zip code:
$5,204
Nevada:
$3,867
(% of AGI for various income ranges: 5.8% for AGIs below $10k, 1.8% for AGIs $10k-25k, 0.9% for AGIs $25k-50k, 1.2% for AGIs $50k-75k, 0.7% for AGIs $75k-100k, 3.7% for AGIs over 100k)
Taxable dividends: $5,012 (reported on 17.8% of returns)
Here:
$5,012
State:
$5,770
(% of AGI for various income ranges: 2.7% for AGIs below $10k, 0.9% for AGIs $10k-25k, 0.4% for AGIs $25k-50k, 0.7% for AGIs $50k-75k, 0.8% for AGIs $75k-100k, 1.8% for AGIs over 100k)
Net capital gain/loss: +$143,839 (reported on 16.3% of returns)
Here:
+$143,839
State:
+$50,644
(% of AGI for various income ranges: 0.0% for AGIs below $10k, 0.3% for AGIs $10k-25k, 0.6% for AGIs $25k-50k, 0.8% for AGIs $50k-75k, 1.2% for AGIs $75k-100k, 59.8% for AGIs over 100k)
Profit/loss from business: +$11,955 (reported on 13.7% of returns)
Here:
+$11,955
State:
+$13,618
(% of AGI for various income ranges: 0.9% for AGIs below $10k, 4.0% for AGIs $10k-25k, 2.3% for AGIs $25k-50k, 1.9% for AGIs $50k-75k, 2.7% for AGIs $75k-100k, 2.3% for AGIs over 100k)
IRA payment deduction: $3,219 (reported on 2.1% of returns)
89014:
$3,219
Nevada:
$3,054
(% of AGI for various income ranges: 0.2% for AGIs $10k-25k, 0.2% for AGIs $25k-50k, 0.1% for AGIs $50k-75k, 0.2% for AGIs $75k-100k, 0.1% for AGIs over 100k)
Self-employed pension: $14,176 (reported on 0.5% of returns)
Here:
$14,176
Nevada:
$16,706
Total itemized deductions: $34,441 (26% of AGI, reported on 37.4% of returns)
Here:
$34,441
State:
$22,990
Here:
26.3% of AGI
State:
21.8% of AGI
(% of AGI for various income ranges: 20.4% for AGIs below $10k, 10.8% for AGIs $10k-25k, 14.7% for AGIs $25k-50k, 17.3% for AGIs $50k-75k, 19.2% for AGIs $75k-100k, 20.7% for AGIs over 100k)
Charity contributions deductions: $4,067 (4% of AGI, reported on 32.9% of returns)
Here:
$4,067
State:
$3,443
Here:
3.8% of AGI
State:
3.1% of AGI
(% of AGI for various income ranges: 0.8% for AGIs below $10k, 0.9% for AGIs $10k-25k, 1.3% for AGIs $25k-50k, 1.9% for AGIs $50k-75k, 2.2% for AGIs $75k-100k, 2.2% for AGIs over 100k)
Total tax: $13,712 (reported on 80.2% of returns)
89014:
$13,712
State:
$10,585
(% of AGI for various income ranges: 3.0% for AGIs below $10k, 4.5% for AGIs $10k-25k, 7.4% for AGIs $25k-50k, 9.3% for AGIs $50k-75k, 10.4% for AGIs $75k-100k, 22.0% for AGIs over 100k)
Earned income credit: $1,571 (reported on 11.3% of returns)
Here:
$1,571
State:
$1,676
Percentage of individuals using paid preparers for their 2004 taxes: 53.9%
Here:
54%
State:
60%
(% for various income ranges: 45.1% for AGIs below $10k, 51.9% for AGIs $10k-25k, 52.5% for AGIs $25k-50k, 54.9% for AGIs $50k-75k, 60.0% for AGIs $75k-100k, 68.8% for AGIs over 100k)
Likely homosexual households (counted as self-reported same-sex unmarried-partner households)
Lesbian couples: 0.0% of all households
Gay men: 0.4% of all households
Household received Food Stamps/SNAP in the past 12 months: 1,803 Household did not receive Food Stamps/SNAP in the past 12 months: 15,267
Women who had a birth in the past 12 months: 420 (161 now married, 218 unmarried) Women who did not have a birth in the past 12 months: 10,345 (4,107 now married, 6,240 unmarried)
Housing units in zip code 89014 with a mortgage: 6,267 (363 second mortgage, 269 both second mortgage and home equity loan) Houses without a mortgage: 132
Median monthly owner costs for units with a mortgage: $1,664 Median monthly owner costs for units without a mortgage: $564
Residents with income below the poverty level in 2022:
This zip code:
7.6%
Whole state:
12.5%
Residents with income below 50% of the poverty level in 2022:
This zip code:
3.1%
Whole state:
5.9%
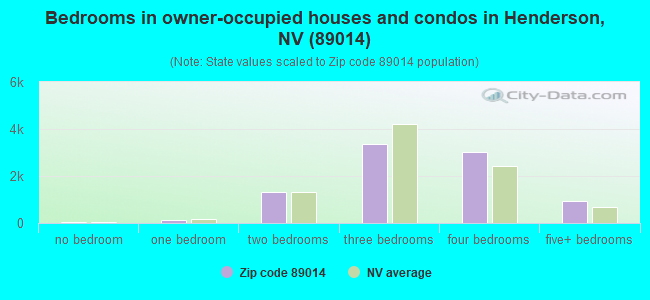
Median number of rooms in houses and condos:
Here:
6.3
State:
6.0
Median number of rooms in apartments:
Here:
3.9
State:
4.2
Notable locations in this zip code not listed on our city pages
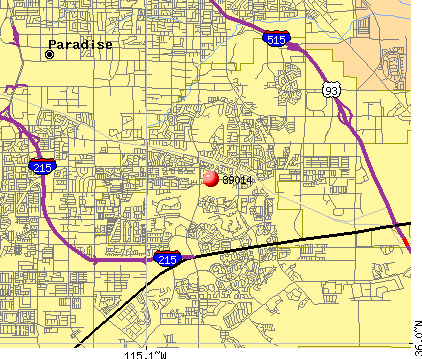
Notable locations in zip code 89014: Paradise Valley Country Club (A), Henderson Fire Department Station 94 (B), Green Valley Library (C), Green Valley Christian Center (D). Display/hide their locations on the map
Shopping Centers: Stephanie Street Center Shopping Center (1), Sunset Plaza Shopping Center (2), Whitney Ranch Center Shopping Center (3), Galleria at Sunset Shopping Center (4), Green Valley Town Center Shopping Center (5), Parkway Springs Plaza Shopping Center (6). Display/hide their locations on the map
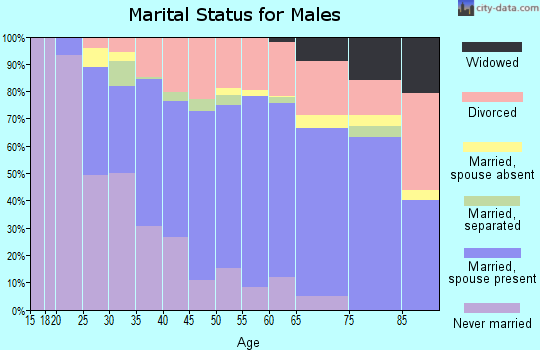
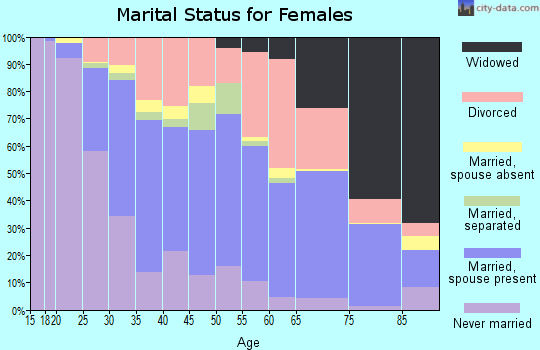
5,511 married couples with children.
2,927 single-parent households (642 men, 2,285 women).
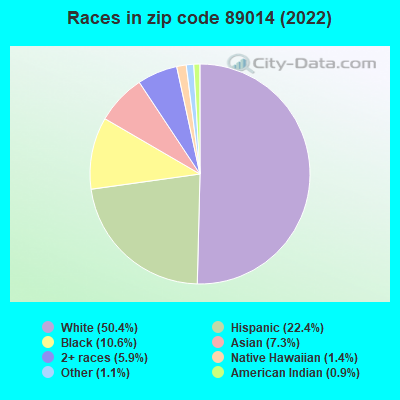
77.0% of residents of 89014 zip code speak English at home.
15.7% of residents speak Spanish at home (69% very well, 22% well, 6% not well, 3% not at all).
3.2% of residents speak other Indo-European language at home (84% very well, 9% well, 7% not well).
3.9% of residents speak Asian or Pacific Island language at home (58% very well, 34% well, 6% not well, 3% not at all).
0.2% of residents speak other language at home (79% very well, 21% well).
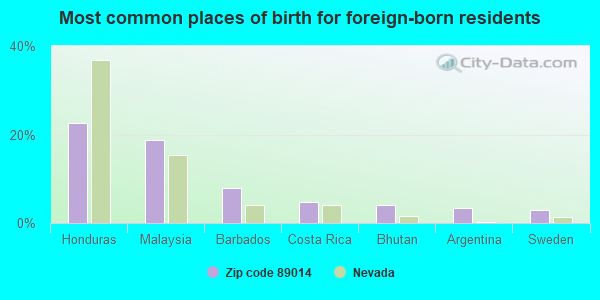
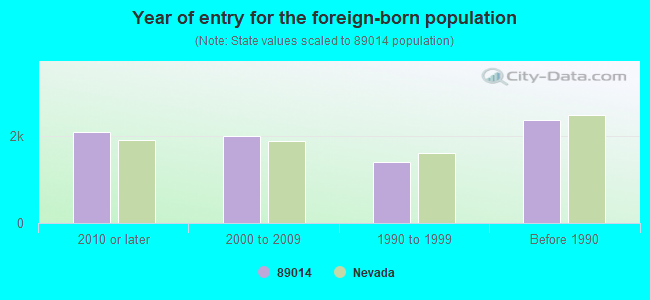
Foreign born population: 6,398 (15.1%) (66.0% of them are naturalized citizens)
Major facilities with environmental interests located in this zip code:
ETHEL M CHOCOLATES INC (1 SUNSET WAY in HENDERSON, NV)
ENFORCEMENT/COMPLIANCE ACTIVITY (Integrated Compliance Information System) - ICIS-HQ-2001-4002, FORMAL ENFORCEMENT ACTION (Integrated Compliance Information System) - ICIS-HQ-2001-4002, FORMAL ENFORCEMENT ACTION Conditionally Exempt Small Quantity Generators, less than 100 kg/month of hazardous waste (Resource Conservation and Recovery Act (tracking hazardous waste)) - notification
OCEAN SPRAY CRANBERRIES INC (1301 AMERICAN PACIFIC DR. in HENDERSON, NV)
STATE MASTER (NV-FP) - STORMWATER-ISW-179, NPDES STORMWATER PERMIT TRI REPORTER (Tracking of toxic chemicals releasing facilities) Business SIC classification: BOTTLED AND CANNED SOFT DRINKS AND CARBONATED WATERS
GREEN VALLEY HIGH SCHOOL (460 N ARROYO GRANDE BLVD in HENDERSON, NV)
(Geographic Names Information System) (National Center for Education Statistics) - STATE ID-02-416 Organizations: CLARK CO SCH DIST (SCHOOL DISTRICT)
Alternative names: GREEN VALLEY HS
NATE MACK ELEMENTARY SCHOOL (3170 LAUREL AVE. in HENDERSON, NV)
(Geographic Names Information System) (National Center for Education Statistics) - STATE ID-02-277 Organizations: CLARK CO SCH DIST (SCHOOL DISTRICT)
Alternative names: MACK, NATE ELEM
HARRIET TREEM ELEMENTARY SCHOOL (1698 PATRICK LANE in HENDERSON, NV)
(Geographic Names Information System) (National Center for Education Statistics) - STATE ID-02-127 Organizations: CLARK CO SCH DIST (SCHOOL DISTRICT)
Alternative names: TREEM, HARRIET ELEM
KESTERSON, LORNA ELEM (231 BAILEY ISLAND DRIVE in HENDERSON, NV)
(National Center for Education Statistics) - STATE ID-02-169 Organizations: CLARK CO SCH DIST (SCHOOL DISTRICT)
BARTLETT, SELMA ELEM (1961 WIGWAM PARKWAY in HENDERSON, NV)
(National Center for Education Statistics) - STATE ID-02-137 Organizations: CLARK CO SCH DIST (SCHOOL DISTRICT)
COWAN - SUNSET SO HS (5300 EAST RUSSEL ROAD in HENDERSON, NV)
(National Center for Education Statistics) - STATE ID-02-606 Organizations: CLARK CO SCH DIST (SCHOOL DISTRICT)
THORPE, JIM ELEM (1650 PATRICK LANE in HENDERSON, NV)
(National Center for Education Statistics) - STATE ID-02-139 Organizations: CLARK CO SCH DIST (SCHOOL DISTRICT)
ROBERTS, AGGIE ELEM (227 CHARTER OAK in HENDERSON, NV)
(National Center for Education Statistics) - STATE ID-02-150 Organizations: CLARK CO SCH DIST (SCHOOL DISTRICT)
A THRIFTY CLEANERS (690 VALLE VERDE DR STE 6 in HENDERSON, NV)
(Resource Conservation and Recovery Act (tracking hazardous waste)) Organizations: DAVID LEARDI (CONTACT/OWNER)
, DONAHUE SCHRIBER ASSET MGMT CORP (CONTACT/OWNER)
Alternative names: BRADLEYS CLEANERS
CCSD-KOEPSELL TRANSPORTATION SATELLITE (1700 GALLERIA DRIVE in HENDERSON, NV)
HAZARDOUS WASTE BIENNIAL REPORTER (Resource Conservation and Recovery Act (tracking hazardous waste)) Large Quantity Generators, more that 1000 kg of hazardous waste/month (Resource Conservation and Recovery Act (tracking hazardous waste)) - notification Business NAICS classification: ALL OTHER MISCELLANEOUS SCHOOLS AND INSTRUCTION.; OTHER AUTOMOTIVE MECHANICAL AND ELECTRICAL REPAIR AND MAINTENANCE. Organizations: CLARK COUNTY SCHOOL DISTRICT (CONTACT/OPERATOR)
, SCHOOL BOARD OF TRUSTEES (CONTACT/OWNER)
Alternative names: CLARK COUNTY SCHOOL DISTRICT, CLARK COUNTY SCHOOL DISTRICT KOEPSELL S
HOME DEPOT USA INC HD3302 (1030 SUNSET RD in HENDERSON, NV)
COMPLIANCE ACTIVITY (Tracking inspections of insecticide, fungicide, and rodenticide, and toxic substances) Small Quantity Generators, between 100 kg and 1000 kg of hazardous waste/month (Resource Conservation and Recovery Act (tracking hazardous waste)) Organizations: THE HOME DEPOT (CONTACT/OWNER)
Housing units lacking complete kitchen facilities: 1.3%
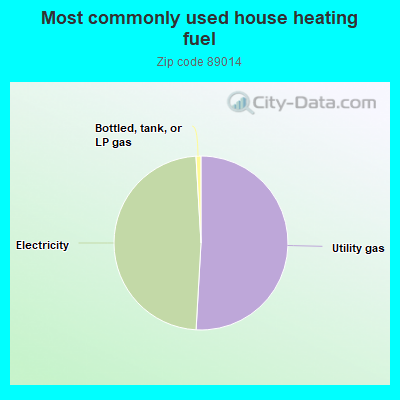
50.6%Utility gas
47.9%Electricity
0.9%Bottled, tank, or LP gas
Population in 1990: 27,761. Population change in the 1990s: +54,078 (+194.8%).
Place of birth for U.S.-born residents:
This state: 8,623
Northeast: 3,934
Midwest: 4,702
South: 3,745
West: 13,499
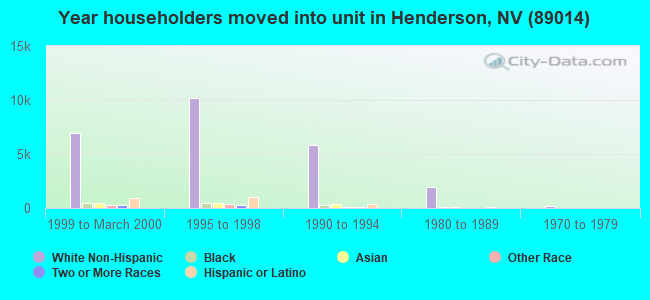
38% of the 89014 zip code residents lived in the same house 5 years ago. Out of people who lived in different houses, 47% lived in this county. Out of people who lived in different counties, 50% lived in Nevada.
86% of the 89014 zip code residents lived in the same house 1 year ago. Out of people who lived in different houses, 57% moved from this county. Out of people who lived in different houses, 1% moved from different county within same state. Out of people who lived in different houses, 38% moved from different state. Out of people who lived in different houses, 3% moved from abroad.
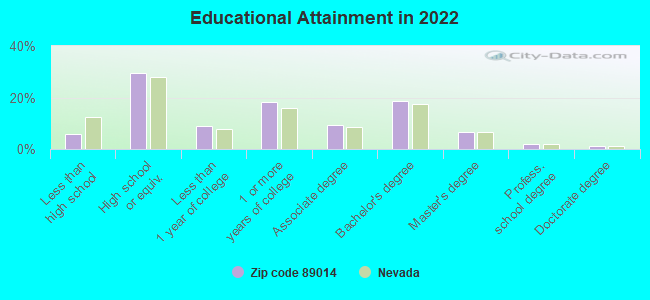
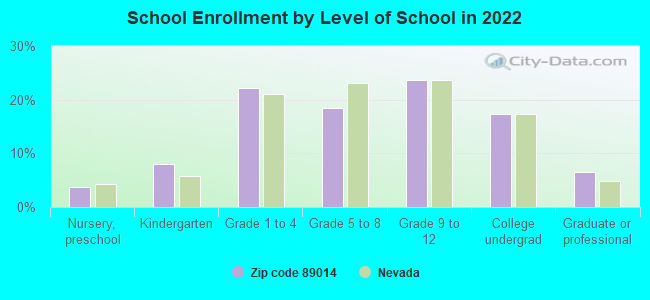
Private vs. public school enrollment:
Students in private schools in grades 1 to 8 (elementary and middle school): 394
Here:
9.6%
Nevada:
12.9%
Students in private schools in grades 9 to 12 (high school): 159
Here:
6.6%
Nevada:
6.9%
Students in private undergraduate colleges: 240
Here:
13.7%
Nevada:
16.0%
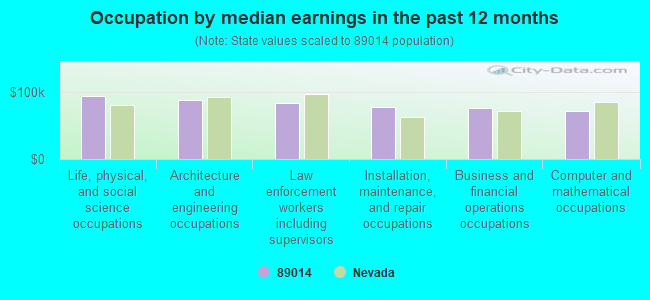
Occupation by median earnings in the past 12 months ($)
93,309Life, physical, and social science occupations
87,868Architecture and engineering occupations
83,420Law enforcement workers including supervisors
76,654Installation, maintenance, and repair occupations
75,213Business and financial operations occupations
70,826Computer and mathematical occupations
Companies with biggest federal contracts located in this zip code (HENDERSON, NV):
RAFAEL CONSTRUCTION INC (7 COMMERCE CENTER DR STE B) : $55,588,915 in 76 contractsfrom 1999 to 2006
Contracts for Construction of Structures and Facilities -- Recreation Facilities (Non-Building), Construction of Structures and Facilities -- Other Conservation and Development Facilities, Construction of Structures and Facilities -- Restoration of real property, Construction of Structures and Facilities -- Other Airfield Structures, and moreby Army, U.S. Army Corps of Engineers - civil program financing only, Department of Veterans Affairs, Bureau of Reclamation, and others Signed by year:2000: $943,524; 2001: $1,692,351; 2002: $4,583,998; 2003: $8,327,466; 2004: $2,672,161; 2005: $12,688,294; 2006: $17,977,056.
Biggest contracts:
$9,948,235 with Army for Construction of Structures and Facilities -- Recreation Facilities (Non-Building). Signed on 2006-02-16. Completion date: 2006-12-29.
$7,969,000, same as above.Signed on 2005-04-29. Completion date: 2006-12-29.
$6,704,065 with U.S. Army Corps of Engineers - civil program financing only for Construction of Structures and Facilities -- Other Conservation and Development Facilities. Signed on 1999-12-14. Completion date: 2000-10-13.
$4,290,000 with Army for Construction of Structures and Facilities -- Recreation Facilities (Non-Building). Signed on 2006-04-26. Completion date: 2006-12-29.
AVTECH RESEARCH CORP (547 BRITISH COURT; small business) : $7,165,068 in 122 contractsfrom 1999 to 2006
Contracts for Maintenance, Repair and Rebuilding of Equipment -- Aircraft Components and Accessories, ADP Systems Analysis Services, Program Management/Support Services, Technical Assistance, and moreby Air Force, Navy Signed by year:2000: $242,841; 2001: $874,443; 2002: $1,062,979; 2003: $636,450; 2004: $922,618; 2005: $1,831,700; 2006: $1,292,082.
Biggest contracts:
$381,914 with Air Force for Maintenance, Repair and Rebuilding of Equipment -- Aircraft Components and Accessories. Signed on 2005-05-17. Completion date: 2005-09-30.
$281,852, same as above.Signed on 2006-06-01. Completion date: 2006-09-30.
$253,343 with Air Force for ADP Systems Analysis Services. Signed on 2002-01-31. Completion date: 2002-09-30.
$190,000, same as above.Signed on 2004-02-10. Completion date: 2005-01-31.
ASI TECHNOLOGY CORPORTION (980 AMERICAN PACIFIC DRIVE; small business) : $927,053 in 7 contractsfrom 2001 to 2003
Contracts for Agriculture Marketing -- Advanced Development (R&D), Physical Sciences -- Management and Support (R&D), Engineering -- Basic Research (R&D), Defense Missile and Space Systems -- Advanced Development (R&D) by Army, Air Force, Navy Signed by year:2000: $0; 2001: $62,756; 2002: $500,101; 2003: $364,196; 2004: $0; 2005: $0; 2006: $0.
Biggest contracts:
$300,000 with Army for Agriculture Marketing -- Advanced Development (R&D). Signed on 2002-04-23. Completion date: 2004-04-23.
$295,609, same as above.Signed on 2003-03-13. Completion date: 2004-04-23.
$99,333 with Air Force for Physical Sciences -- Management and Support (R&D). Signed on 2002-08-01. Completion date: 2003-07-31.
$68,587 with Navy for Engineering -- Basic Research (R&D). Signed on 2003-01-31. Completion date: 2003-08-06.
SUNSET STATION, INC (1301 WEST SUNSET RD) : $153,860 in 3 contractsfrom 2000 to 2001
$91,860 with Air Force for Lodging - Hotel/Motel. Signed on 2001-08-28. Completion date: 2001-02-10.
$31,000, same as above.Signed on 2000-01-19. Completion date: 2000-02-05.
$31,000, same as above.Signed on 2000-04-05. Completion date: 2000-04-22.
MADDOX, WENDELL (630 N STEPHANIE ST #408; small business) : $106,507 in 6 contractsfrom 2003 to 2006
Contracts for Custodial Janitorial Services by Army Signed by year:2000: $0; 2001: $0; 2002: $0; 2003: $13,760; 2004: $28,822; 2005: $12,925; 2006: $51,000.
Biggest contracts:
$51,000 with Army for Custodial Janitorial Services. Signed on 2006-06-28. Completion date: 2006-07-12.
$27,000, same as above.Signed on 2004-06-23. Completion date: 2004-07-08.
$12,925, same as above.Signed on 2005-09-12. Completion date: 2004-07-08.
$8,160 with Army for Custodial Janitorial Services. Taking place in CA. Signed on 2003-01-29. Completion date: 2004-01-12.
POST BUCKLEY SCHUH JERNING (901 NORTH GREEN VALLEY PA) : $90,000 in 2 contractsin 2000
$60,000 with U.S. Army Corps of Engineers - civil program financing only for Architect - Engineer Services (including landscaping, interior layout, and designing). Taking place in CA. Signed on 2000-02-28. Completion date: 2000-05-14.
$30,000, same as above.Signed on 2000-02-10. Completion date: 2000-04-11.
T&S WHOLESALE (330 PERRY ELLIS DR; small business) : $79,395 in 16 contractsfrom 2004 to 2005
Contracts for Screws, Packing and Gasket Materials, Hardware, Commercial, Nuts and Washers, and moreby Defense Logistics Agency Signed by year:2000: $0; 2001: $0; 2002: $0; 2003: $0; 2004: $51,745; 2005: $27,650; 2006: $0.
Biggest contracts:
$18,273 with Defense Logistics Agency for Screws. Signed on 2004-11-19. Completion date: 2005-01-03.
$7,575 with Defense Logistics Agency for Packing and Gasket Materials. Signed on 2005-01-18. Completion date: 2005-04-06.
$6,979 with Defense Logistics Agency for Hardware, Commercial. Signed on 2004-10-15. Completion date: 2005-01-24.
$5,571 with Defense Logistics Agency for Nuts and Washers. Signed on 2005-01-20. Completion date: 2005-05-01.
UNIVERSITY OF SOUTHERN NEVADA (11 SUNSET WAY; small business) : $62,884 in 2 contractsfrom 2004 to 2006
$33,178 with Navy for Tuition, Registration, and Membership Fees. Taking place in MD. Signed on 2006-05-12. Completion date: 2007-05-31.
$29,706, same as above.Signed on 2004-08-19. Completion date: 2005-05-31.
D L SCIENCES, INC (2756 N GREEN VALLEY PKWY; small business) : $46,786 in 4 contractsfrom 2002 to 2005
$26,120 with Offices, Boards and Divisions (includes Attorney General, Deputy Attorney General, etc.) for Expert Witness. Taking place in DC. Signed on 2002-12-15. Completion date: 2003-12-15.
$11,500 with Air Force for Scientific and Management Education. Signed on 2005-06-16. Completion date: 2005-07-28.
$9,166 with Offices, Boards and Divisions (includes Attorney General, Deputy Attorney General, etc.) for Expert Witness. Taking place in DC. Signed on 2003-09-15. Completion date: 2003-12-15.
$0, same as above.Signed on 2002-12-15. Completion date: 2003-12-15.
AUSTIN NATIONAL ENTERPRISES (288 HELMSDALE DRIVE; small business) : $42,473 in 4 contractsin 2002
$18,924 with Army for Warehouse Trucks and Tractors, Self-Propelled. Signed on 2002-09-26. Completion date: 2002-11-21.
$14,200 with Army for Fertilizers. Taking place in VA. Signed on 2002-04-26. Completion date: 2002-08-30.
$7,136 with Army for ADP Software. Signed on 2002-09-27. Completion date: 2002-10-24.
$2,213 with Army for ADP Central Processing Unit (CPU, Computer), Digital. Signed on 2002-02-04. Completion date: 2002-02-28.
Top industries in this zip code by the number of employees in 2005:
2002 - 2018 National Fire Incident Reporting System (NFIRS) incidents
According to the data from the years 2002 - 2018 the average number of fire incidents per year is 105. The highest number of fires - 191 took place in 2006, and the least - 58 in 2003. The data has a declining trend.
When looking into fire subcategories, the most reports belonged to: Outside Fires (45.3%), and Structure Fires (31.5%).
Fire incident types reported to NFIRS in Zip Code 89014


 Nearest zip codes: 89074, 89120, 89122, 89012, 89121, 89142.
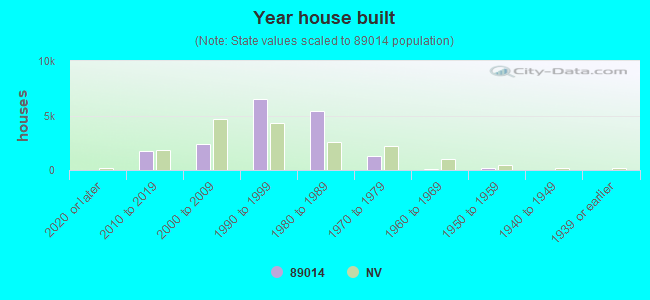


 According to the data from the years 2002 - 2018 the average number of fire incidents per year is 105. The highest number of fires - 191 took place in 2006, and the least - 58 in 2003. The data has a declining trend.
 When looking into fire subcategories, the most reports belonged to: Outside Fires (45.3%), and Structure Fires (31.5%).