Estimated zip code population in 2022: 37,847 Zip code population in 2010: 23,800 Zip code population in 2000: 8,276
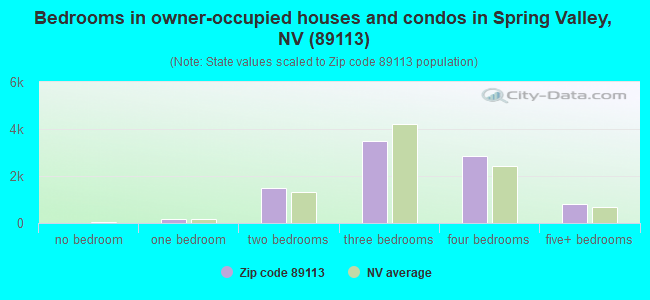
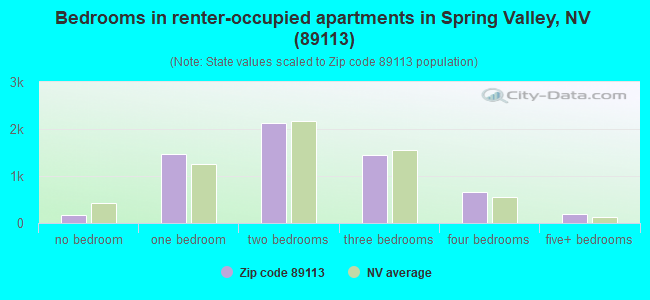
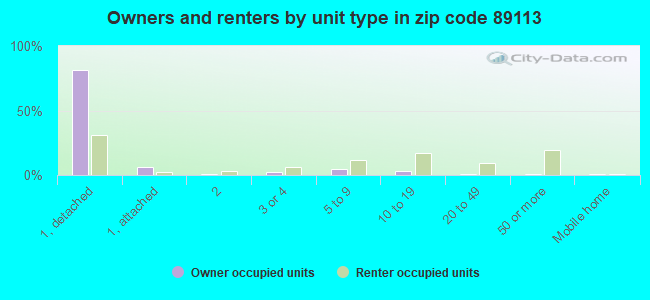
Houses and condos: 16,137 Renter-occupied apartments: 6,072
% of renters here:
41%
State:
40%
March 2022 cost of living index in zip code 89113: 99.7 (near average, U.S. average is 100)
Land area: 11.1 sq. mi. Water area: 0.0 sq. mi.
Population density: 3,395 people per square mile
(average).
OSM Map
General Map
Google Map
MSN Map
OSM Map
General Map
Google Map
MSN Map
OSM Map
General Map
Google Map
MSN Map
OSM Map
General Map
Google Map
MSN Map
Please wait while loading the map...
Real estate property taxes paid for housing units in 2022:
This zip code:
0.5% ($2,617)
Nevada:
0.4% ($1,889)
Median real estate property taxes paid for housing units with mortgages in 2022: $2,775 (0.6%) Median real estate property taxes paid for housing units with no mortgage in 2022: $2,392 (0.5%)
Estimated median house/condo value in 2022: $499,940
89113:
$499,940
Nevada:
$434,700
According to our research of Nevada and other state lists, there were 53 registered sex offenders living in 89113 zip code as of April 27, 2024. The ratio of all residents to sex offenders in zip code 89113 is 515 to 1. The ratio of registered sex offenders to all residents in this zip code is lower than the state average.
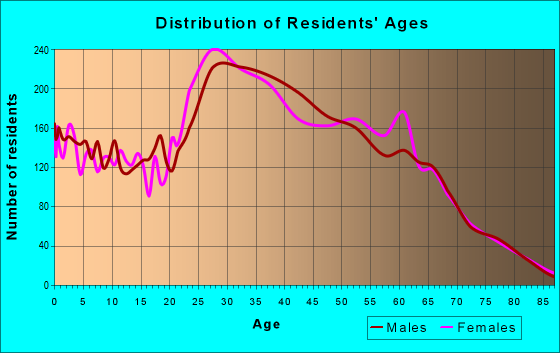
Median resident age:
This zip code:
37.7 years
Nevada median age:
39.0 years
Average household size:
This zip code:
2.5 people
Nevada:
2.6 people
Averages for the 2020 tax year for zip code 89113, filed in 2021:
Average Adjusted Gross Income (AGI) in 2020: $84,581 (Individual Income Tax Returns)
Here:
$84,581
State:
$78,964
Salary/wage: $59,145 (reported on 82.0% of returns)
Here:
$59,145
State:
$54,472
(% of AGI for various income ranges: 1063.7% for AGIs below $25k, 3381.7% for AGIs $25k-50k, 6496.8% for AGIs $50k-75k, 9793.0% for AGIs $75k-100k, 17212.4% for AGIs $100k-200k, 87210.3% for AGIs over 200k)
Taxable interest for individuals: $5,714 (reported on 24.6% of returns)
This zip code:
$5,714
Nevada:
$3,521
(% of AGI for various income ranges: 10.9% for AGIs below $25k, 16.3% for AGIs $25k-50k, 33.1% for AGIs $50k-75k, 59.5% for AGIs $75k-100k, 147.8% for AGIs $100k-200k, 7319.0% for AGIs over 200k)
Ordinary dividends: $16,578 (reported on 16.3% of returns)
Here:
$16,578
State:
$13,390
(% of AGI for various income ranges: 16.9% for AGIs below $25k, 24.8% for AGIs $25k-50k, 52.3% for AGIs $50k-75k, 117.7% for AGIs $75k-100k, 272.6% for AGIs $100k-200k, 14358.7% for AGIs over 200k)
Net capital gain/loss in AGI: +$36,736 (reported on 19.5% of returns)
Here:
+$36,736
State:
+$63,025
(% of AGI for various income ranges: 6.0% for AGIs below $25k, 27.5% for AGIs $25k-50k, 106.3% for AGIs $50k-75k, 249.3% for AGIs $75k-100k, 932.7% for AGIs $100k-200k, 38613.3% for AGIs over 200k)
Profit/loss from business: +$11,891 (reported on 20.8% of returns)
Here:
+$11,891
State:
+$11,500
(% of AGI for various income ranges: 126.4% for AGIs below $25k, 138.0% for AGIs $25k-50k, 193.9% for AGIs $50k-75k, 312.4% for AGIs $75k-100k, 823.6% for AGIs $100k-200k, 5813.3% for AGIs over 200k)
Taxable individual retirement arrangement distribution: $26,266 (reported on 5.1% of returns)
89113:
$26,266
Nevada:
$23,628
(% of AGI for various income ranges: 32.8% for AGIs below $25k, 43.1% for AGIs $25k-50k, 105.7% for AGIs $50k-75k, 172.9% for AGIs $75k-100k, 645.6% for AGIs $100k-200k, 3185.3% for AGIs over 200k)
Self-employed (Keogh) retirement plans: $22,117 (reported on 0.3% of returns)
89113:
$22,117
Nevada:
$26,634
(% of AGI for various income ranges: 34.3% for AGIs $100k-200k, 291.3% for AGIs over 200k)
Total itemized deductions: $52,188 (reported on 11.6% of returns)
Here:
$52,188
State:
$44,173
(% of AGI for various income ranges: 50.7% for AGIs below $25k, 198.9% for AGIs $25k-50k, 448.3% for AGIs $50k-75k, 695.0% for AGIs $75k-100k, 1570.0% for AGIs $100k-200k, 21843.7% for AGIs over 200k)
Charity contributions: $12,880 (reported on 9.5% of returns)
Here:
$12,880
State:
$12,589
(% of AGI for various income ranges: 3.9% for AGIs below $25k, 23.3% for AGIs $25k-50k, 58.1% for AGIs $50k-75k, 97.7% for AGIs $75k-100k, 267.8% for AGIs $100k-200k, 5337.3% for AGIs over 200k)
Taxes paid: $6,702 (reported on 11.4% of returns)
89113:
$6,702
State:
$6,112
(% of AGI for various income ranges: 8.5% for AGIs below $25k, 43.9% for AGIs $25k-50k, 88.0% for AGIs $50k-75k, 148.0% for AGIs $75k-100k, 306.9% for AGIs $100k-200k, 1575.3% for AGIs over 200k)
Earned income credit: $1,909 (reported on 14.9% of returns)
Here:
$1,909
State:
$2,214
(% of AGI for various income ranges: 78.9% for AGIs below $25k, 54.0% for AGIs $25k-50k, 0.9% for AGIs $50k-75k)
Percentage of individuals using paid preparers for their 2020 taxes: 92.4%
Here:
92%
State:
93%
(% for various income ranges: 91.1% for AGIs below $25k, 92.7% for AGIs $25k-50k, 93.0% for AGIs $50k-75k, 93.5% for AGIs $75k-100k, 92.5% for AGIs $100k-200k, 93.5% for AGIs over 200k)
Averages for the 2012 tax year for zip code 89113, filed in 2013:
Average Adjusted Gross Income (AGI) in 2012: $93,391 (Individual Income Tax Returns)
Here:
$93,391
State:
$61,164
Salary/wage: $56,653 (reported on 85.1% of returns)
Here:
$56,653
State:
$45,924
(% of AGI for various income ranges: 77.6% for AGIs below $25k, 87.7% for AGIs $25k-50k, 85.6% for AGIs $50k-75k, 79.9% for AGIs $75k-100k, 73.7% for AGIs $100k-200k, 24.8% for AGIs over 200k)
Taxable interest for individuals: $5,337 (reported on 26.4% of returns)
This zip code:
$5,337
Nevada:
$3,137
(% of AGI for various income ranges: 1.0% for AGIs below $25k, 0.3% for AGIs $25k-50k, 0.7% for AGIs $50k-75k, 0.7% for AGIs $75k-100k, 1.0% for AGIs $100k-200k, 2.2% for AGIs over 200k)
Ordinary dividends: $17,212 (reported on 14.8% of returns)
Here:
$17,212
State:
$11,762
(% of AGI for various income ranges: 2.9% for AGIs below $25k, 0.8% for AGIs $25k-50k, 1.0% for AGIs $50k-75k, 1.2% for AGIs $75k-100k, 1.6% for AGIs $100k-200k, 4.0% for AGIs over 200k)
Net capital gain/loss in AGI: +$52,559 (reported on 15.1% of returns)
Here:
+$52,559
State:
+$33,127
(% of AGI for various income ranges: 0.2% for AGIs $50k-75k, 0.8% for AGIs $75k-100k, 1.4% for AGIs $100k-200k, 15.7% for AGIs over 200k)
Profit/loss from business: +$15,448 (reported on 16.1% of returns)
Here:
+$15,448
State:
+$12,567
(% of AGI for various income ranges: 8.9% for AGIs below $25k, 3.3% for AGIs $25k-50k, 2.4% for AGIs $50k-75k, 2.4% for AGIs $75k-100k, 3.4% for AGIs $100k-200k, 1.9% for AGIs over 200k)
Taxable individual retirement arrangement distribution: $31,227 (reported on 6.2% of returns)
89113:
$31,227
Nevada:
$20,808
(% of AGI for various income ranges: 1.9% for AGIs below $25k, 1.0% for AGIs $25k-50k, 1.0% for AGIs $50k-75k, 2.1% for AGIs $75k-100k, 2.8% for AGIs $100k-200k, 2.3% for AGIs over 200k)
Self-employment retirement plans: $14,920 (reported on 0.4% of returns)
89113:
$14,920
Nevada:
$22,197
Total itemized deductions: $34,296 (17% of AGI, reported on 34.4% of returns)
Here:
$34,296
State:
$26,148
Here:
17.1% of AGI
State:
20.0% of AGI
(% of AGI for various income ranges: 11.7% for AGIs below $25k, 11.5% for AGIs $25k-50k, 14.8% for AGIs $50k-75k, 14.2% for AGIs $75k-100k, 15.4% for AGIs $100k-200k, 11.6% for AGIs over 200k)
Charity contributions: $6,878 (reported on 28.4% of returns)
Here:
$6,878
State:
$4,329
(% of AGI for various income ranges: 0.7% for AGIs below $25k, 1.2% for AGIs $25k-50k, 1.5% for AGIs $50k-75k, 1.5% for AGIs $75k-100k, 1.7% for AGIs $100k-200k, 2.7% for AGIs over 200k)
Taxes paid: $6,016 (reported on 33.7% of returns)
89113:
$6,016
State:
$5,116
(% of AGI for various income ranges: 1.9% for AGIs below $25k, 2.0% for AGIs $25k-50k, 2.7% for AGIs $50k-75k, 2.8% for AGIs $75k-100k, 3.2% for AGIs $100k-200k, 1.8% for AGIs over 200k)
Earned income credit: $1,909 (reported on 15.1% of returns)
Here:
$1,909
State:
$2,279
(% of AGI for various income ranges: 4.7% for AGIs below $25k, 0.8% for AGIs $25k-50k)
Percentage of individuals using paid preparers for their 2012 taxes: 57.0%
Here:
57%
State:
55%
(% for various income ranges: 52.8% for AGIs below $25k, 53.4% for AGIs $25k-50k, 58.2% for AGIs $50k-75k, 59.2% for AGIs $75k-100k, 67.5% for AGIs $100k-200k, 81.5% for AGIs over 200k)
Averages for the 2004 tax year for zip code 89113, filed in 2005:
Average Adjusted Gross Income (AGI) in 2004: $135,256 (Individual Income Tax Returns)
Here:
$135,256
State:
$58,367
Salary/wage: $62,684 (reported on 86.4% of returns)
Here:
$62,684
State:
$42,695
(% of AGI for various income ranges: 85.1% for AGIs $10k-25k, 87.6% for AGIs $25k-50k, 84.9% for AGIs $50k-75k, 80.0% for AGIs $75k-100k, 25.9% for AGIs over 100k)
Taxable interest for individuals: $15,204 (reported on 40.6% of returns)
This zip code:
$15,204
Nevada:
$3,867
(% of AGI for various income ranges: 1.9% for AGIs $10k-25k, 1.0% for AGIs $25k-50k, 1.5% for AGIs $50k-75k, 1.1% for AGIs $75k-100k, 5.2% for AGIs over 100k)
Taxable dividends: $26,925 (reported on 20.7% of returns)
Here:
$26,925
State:
$5,770
(% of AGI for various income ranges: 1.1% for AGIs $10k-25k, 0.7% for AGIs $25k-50k, 0.9% for AGIs $50k-75k, 1.3% for AGIs $75k-100k, 4.9% for AGIs over 100k)
Net capital gain/loss: +$219,990 (reported on 22.3% of returns)
Here:
+$219,990
State:
+$50,644
(% of AGI for various income ranges: 0.4% for AGIs $10k-25k, 0.9% for AGIs $25k-50k, 1.6% for AGIs $50k-75k, 2.7% for AGIs $75k-100k, 44.7% for AGIs over 100k)
Profit/loss from business: +$29,573 (reported on 16.2% of returns)
Here:
+$29,573
State:
+$13,618
(% of AGI for various income ranges: 4.9% for AGIs $10k-25k, 3.3% for AGIs $25k-50k, 1.9% for AGIs $50k-75k, 4.4% for AGIs $75k-100k, 3.4% for AGIs over 100k)
IRA payment deduction: $3,502 (reported on 2.6% of returns)
89113:
$3,502
Nevada:
$3,054
(% of AGI for various income ranges: 0.3% for AGIs $10k-25k, 0.2% for AGIs $25k-50k, 0.2% for AGIs $50k-75k, 0.2% for AGIs $75k-100k, 0.0% for AGIs over 100k)
Self-employed pension: $21,138 (reported on 1.0% of returns)
Here:
$21,138
Nevada:
$16,706
Total itemized deductions: $39,878 (17% of AGI, reported on 48.6% of returns)
Here:
$39,878
State:
$22,990
Here:
16.6% of AGI
State:
21.8% of AGI
(% of AGI for various income ranges: 15.6% for AGIs $10k-25k, 20.9% for AGIs $25k-50k, 22.7% for AGIs $50k-75k, 21.1% for AGIs $75k-100k, 12.0% for AGIs over 100k)
Charity contributions deductions: $9,953 (4% of AGI, reported on 42.8% of returns)
Here:
$9,953
State:
$3,443
Here:
3.9% of AGI
State:
3.1% of AGI
(% of AGI for various income ranges: 1.4% for AGIs $10k-25k, 1.8% for AGIs $25k-50k, 2.3% for AGIs $50k-75k, 2.2% for AGIs $75k-100k, 3.4% for AGIs over 100k)
Total tax: $29,617 (reported on 81.6% of returns)
89113:
$29,617
State:
$10,585
(% of AGI for various income ranges: 4.8% for AGIs $10k-25k, 7.3% for AGIs $25k-50k, 8.6% for AGIs $50k-75k, 10.8% for AGIs $75k-100k, 20.0% for AGIs over 100k)
Earned income credit: $1,450 (reported on 10.2% of returns)
Here:
$1,450
State:
$1,676
Percentage of individuals using paid preparers for their 2004 taxes: 62.0%
Here:
62%
State:
60%
(% for various income ranges: 59.2% for AGIs below $10k, 56.9% for AGIs $10k-25k, 56.8% for AGIs $25k-50k, 63.9% for AGIs $50k-75k, 62.9% for AGIs $75k-100k, 79.1% for AGIs over 100k)
Likely homosexual households (counted as self-reported same-sex unmarried-partner households)
Lesbian couples: 0.1% of all households
Gay men: 0.2% of all households
Household received Food Stamps/SNAP in the past 12 months: 1,320 Household did not receive Food Stamps/SNAP in the past 12 months: 13,530
Women who had a birth in the past 12 months: 422 (279 now married, 137 unmarried) Women who did not have a birth in the past 12 months: 8,669 (3,243 now married, 5,436 unmarried)
Housing units in zip code 89113 with a mortgage: 5,846 (304 second mortgage, 32 home equity loan, 245 both second mortgage and home equity loan) Median monthly owner costs for units with a mortgage: $1,944 Median monthly owner costs for units without a mortgage: $532
Residents with income below the poverty level in 2022:
This zip code:
10.5%
Whole state:
12.5%
Residents with income below 50% of the poverty level in 2022:
This zip code:
4.8%
Whole state:
5.9%
Median number of rooms in houses and condos:
Here:
6.0
State:
6.0
Median number of rooms in apartments:
Here:
4.2
State:
4.2
Notable locations in this zip code not listed on our city pages
3,727 married couples with children.
2,276 single-parent households (696 men, 1,580 women).
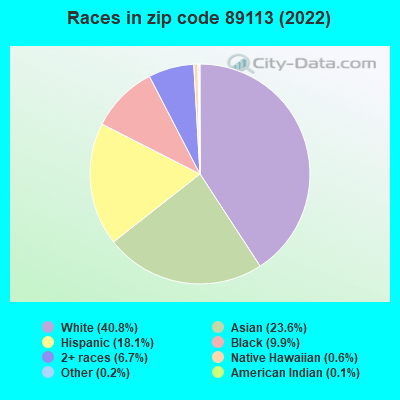
67.9% of residents of 89113 zip code speak English at home.
10.3% of residents speak Spanish at home (71% very well, 20% well, 8% not well, 1% not at all).
3.6% of residents speak other Indo-European language at home (77% very well, 19% well, 4% not well).
15.8% of residents speak Asian or Pacific Island language at home (54% very well, 25% well, 17% not well, 4% not at all).
1.8% of residents speak other language at home (69% very well, 22% well, 3% not well, 7% not at all).
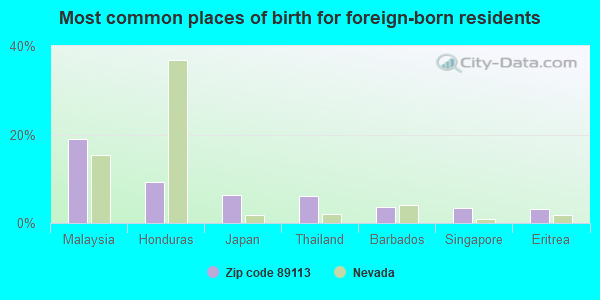
Foreign born population: 9,059 (23.9%) (68.2% of them are naturalized citizens)
Facilities with environmental interests located in this zip code:
DURANGO HS (7100 DEWEY DRIVE in LAS VEGAS, NV)
(National Center for Education Statistics) - STATE ID-02-417 Organizations: CLARK CO SCH DIST (SCHOOL DISTRICT)
SIERRA VISTA HS (8100 WEST ROBINDALE ROAD in LAS VEGAS, NV)
(National Center for Education Statistics) - STATE ID-02-611 Organizations: CLARK CO SCH DIST (SCHOOL DISTRICT)
Housing units lacking complete plumbing facilities: 0.3% Housing units lacking complete kitchen facilities: 0.5%
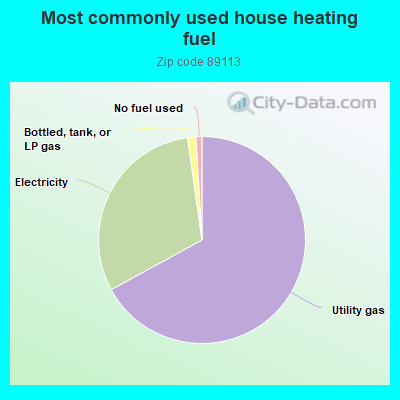
66.5%Utility gas
30.5%Electricity
1.3%Bottled, tank, or LP gas
0.9%No fuel used
Population in 1990: 1,801. Population change in the 1990s: +6,475 (+359.5%).
Place of birth for U.S.-born residents:
This state: 8,218
Northeast: 2,796
Midwest: 3,730
South: 2,370
West: 10,444
31% of the 89113 zip code residents lived in the same house 5 years ago. Out of people who lived in different houses, 53% lived in this county. Out of people who lived in different counties, 50% lived in Nevada.
83% of the 89113 zip code residents lived in the same house 1 year ago. Out of people who lived in different houses, 65% moved from this county. Out of people who lived in different houses, 2% moved from different county within same state. Out of people who lived in different houses, 25% moved from different state. Out of people who lived in different houses, 5% moved from abroad.
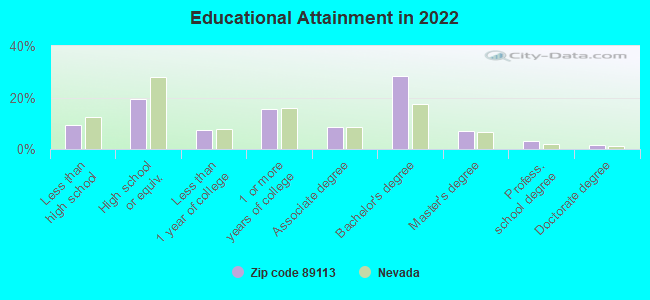
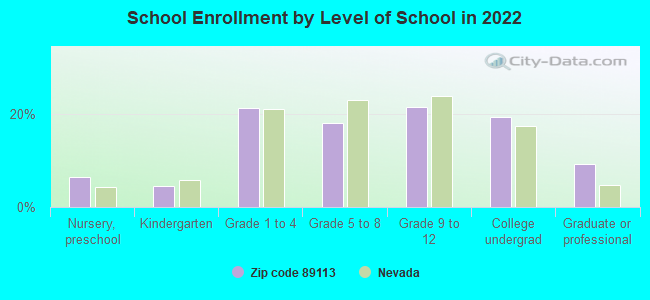
Private vs. public school enrollment:
Students in private schools in grades 1 to 8 (elementary and middle school): 879
Here:
28.8%
Nevada:
12.9%
Students in private schools in grades 9 to 12 (high school): 179
Here:
11.5%
Nevada:
6.9%
Students in private undergraduate colleges: 188
Here:
13.3%
Nevada:
16.0%
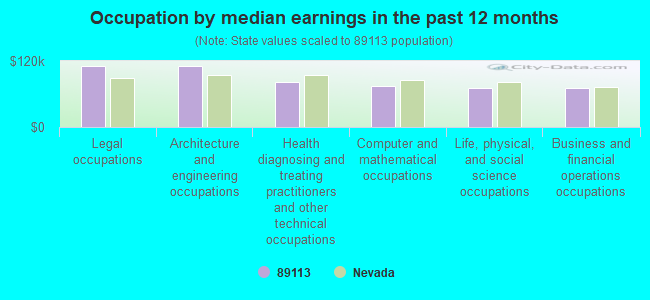
Occupation by median earnings in the past 12 months ($)
110,502Legal occupations
110,416Architecture and engineering occupations
82,245Health diagnosing and treating practitioners and other technical occupations
74,051Computer and mathematical occupations
71,793Life, physical, and social science occupations
71,663Business and financial operations occupations
Top industries in this zip code by the number of employees in 2005:
Construction: New Single-Family Housing Construction (except Operative Builders) (250-499 employees: 1 establishment, 50-99 employees: 1 establishment, 1-4 employees: 1 establishment)
Other Services (except Public Administration): Religious Organizations (100-249: 1, 1-4: 2)
Arts, Entertainment, and Recreation: Golf Courses and Country Clubs (100-249: 1)
Administrative and Support and Waste Management and Remediation Services: Convention and Trade Show Organizers (50-99: 2)
Finance and Insurance: Real Estate Credit (20-49: 2, 10-19: 1, 1-4: 2)
Other Services (except Public Administration): Other Similar Organizations (except Business, Professional, Labor, and Political Organizations) (50-99: 1, 1-4: 1)
Finance and Insurance: Direct Title Insurance Carriers (50-99: 1)
Fatal accident statistics in 2014:
Fatal accident count: 3
Vehicles involved in fatal accidents: 5
Fatal accidents caused by drunken drivers: 1
Fatalities: 3
Persons involved in fatal accidents: 6
Pedestrians involved in fatal accidents: 2
Fatal accident statistics in 2012:
Fatal accident count: 2
Vehicles involved in fatal accidents: 5
Fatal accidents caused by drunken drivers: 2
Fatalities: 2
Persons involved in fatal accidents: 5
Pedestrians involved in fatal accidents: 0
Home Mortgage Disclosure Act Aggregated Statistics For Year 2009 (Based on 4 full and 2 partial tracts)
A) FHA, FSA/RHS & VA Home Purchase Loans
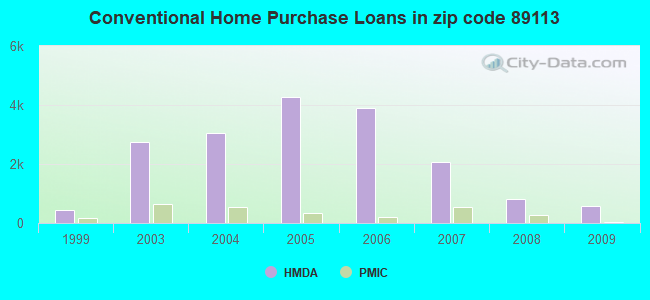
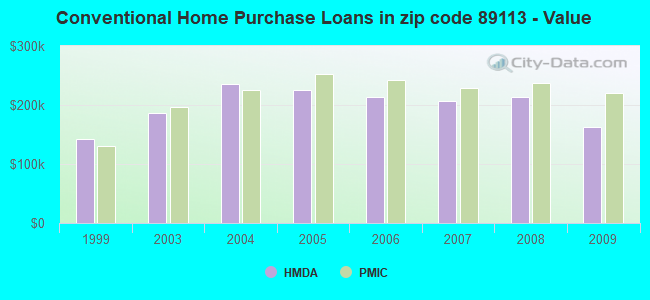
B) Conventional Home Purchase Loans
C) Refinancings
D) Home Improvement Loans
F) Non-occupant Loans on < 5 Family Dwellings (A B C & D)
G) Loans On Manufactured Home Dwelling (A B C & D)
Number
Average Value
Number
Average Value
Number
Average Value
Number
Average Value
Number
Average Value
Number
Average Value
LOANS ORIGINATED
615
$180,438
566
$162,233
590
$222,898
8
$70,918
265
$167,386
2
$152,515
APPLICATIONS APPROVED, NOT ACCEPTED
41
$206,151
60
$162,748
80
$225,222
8
$130,570
38
$146,866
0
$0
APPLICATIONS DENIED
144
$182,803
143
$176,595
323
$240,524
33
$69,754
110
$178,159
2
$26,410
APPLICATIONS WITHDRAWN
75
$171,662
89
$172,767
169
$247,949
19
$107,837
42
$153,665
0
$0
FILES CLOSED FOR INCOMPLETENESS
23
$182,840
14
$225,587
40
$249,675
0
$0
8
$175,590
0
$0
Aggregated Statistics For Year 2008 (Based on 4 full and 2 partial tracts)
A) FHA, FSA/RHS & VA Home Purchase Loans
B) Conventional Home Purchase Loans
C) Refinancings
D) Home Improvement Loans
E) Loans on Dwellings For 5+ Families
F) Non-occupant Loans on < 5 Family Dwellings (A B C & D)
Number
Average Value
Number
Average Value
Number
Average Value
Number
Average Value
Number
Average Value
Number
Average Value
LOANS ORIGINATED
517
$216,096
799
$213,559
392
$279,527
36
$39,193
2
$2,121,800
332
$196,960
APPLICATIONS APPROVED, NOT ACCEPTED
41
$231,495
93
$213,794
76
$218,851
3
$28,993
0
$0
60
$194,412
APPLICATIONS DENIED
111
$218,481
241
$215,657
449
$271,678
91
$88,194
0
$0
151
$200,533
APPLICATIONS WITHDRAWN
57
$224,518
109
$223,630
156
$259,378
11
$204,426
0
$0
54
$206,667
FILES CLOSED FOR INCOMPLETENESS
14
$244,283
37
$233,106
43
$310,702
7
$43,603
0
$0
25
$245,262
Aggregated Statistics For Year 2007 (Based on 4 full and 2 partial tracts)
A) FHA, FSA/RHS & VA Home Purchase Loans
B) Conventional Home Purchase Loans
C) Refinancings
D) Home Improvement Loans
E) Loans on Dwellings For 5+ Families
F) Non-occupant Loans on < 5 Family Dwellings (A B C & D)
G) Loans On Manufactured Home Dwelling (A B C & D)
Number
Average Value
Number
Average Value
Number
Average Value
Number
Average Value
Number
Average Value
Number
Average Value
Number
Average Value
LOANS ORIGINATED
34
$268,779
2,063
$206,992
1,149
$268,810
122
$111,646
2
$2,543,505
774
$190,770
0
$0
APPLICATIONS APPROVED, NOT ACCEPTED
3
$263,513
345
$227,852
360
$247,483
41
$108,629
0
$0
162
$212,522
0
$0
APPLICATIONS DENIED
13
$268,861
543
$254,558
1,117
$273,022
113
$133,224
0
$0
281
$251,318
4
$52,035
APPLICATIONS WITHDRAWN
3
$270,833
273
$232,916
411
$289,213
29
$168,693
0
$0
122
$250,759
0
$0
FILES CLOSED FOR INCOMPLETENESS
0
$0
56
$274,133
133
$293,386
15
$217,399
0
$0
21
$227,380
0
$0
Aggregated Statistics For Year 2006 (Based on 4 full and 2 partial tracts)
A) FHA, FSA/RHS & VA Home Purchase Loans
B) Conventional Home Purchase Loans
C) Refinancings
D) Home Improvement Loans
E) Loans on Dwellings For 5+ Families
F) Non-occupant Loans on < 5 Family Dwellings (A B C & D)
G) Loans On Manufactured Home Dwelling (A B C & D)
Number
Average Value
Number
Average Value
Number
Average Value
Number
Average Value
Number
Average Value
Number
Average Value
Number
Average Value
LOANS ORIGINATED
16
$224,447
3,891
$213,071
1,756
$278,419
196
$138,631
0
$0
1,261
$214,715
0
$0
APPLICATIONS APPROVED, NOT ACCEPTED
6
$238,700
809
$206,456
388
$295,320
74
$88,156
0
$0
199
$204,905
0
$0
APPLICATIONS DENIED
5
$237,230
1,028
$220,058
943
$319,832
128
$113,078
2
$995,500
362
$234,104
3
$89,693
APPLICATIONS WITHDRAWN
0
$0
667
$197,238
648
$275,806
49
$147,631
0
$0
190
$194,562
0
$0
FILES CLOSED FOR INCOMPLETENESS
0
$0
116
$223,717
140
$257,907
11
$155,950
0
$0
50
$210,882
0
$0
Aggregated Statistics For Year 2005 (Based on 4 full and 2 partial tracts)
A) FHA, FSA/RHS & VA Home Purchase Loans
B) Conventional Home Purchase Loans
C) Refinancings
D) Home Improvement Loans
E) Loans on Dwellings For 5+ Families
F) Non-occupant Loans on < 5 Family Dwellings (A B C & D)
G) Loans On Manufactured Home Dwelling (A B C & D)
Number
Average Value
Number
Average Value
Number
Average Value
Number
Average Value
Number
Average Value
Number
Average Value
Number
Average Value
LOANS ORIGINATED
47
$208,327
4,272
$225,965
2,232
$272,911
226
$153,602
4
$7,939,112
1,414
$218,876
4
$51,925
APPLICATIONS APPROVED, NOT ACCEPTED
2
$196,310
677
$256,474
332
$270,961
69
$129,244
0
$0
201
$265,334
0
$0
APPLICATIONS DENIED
13
$199,784
1,382
$238,739
866
$259,023
178
$108,835
0
$0
467
$222,491
18
$79,789
APPLICATIONS WITHDRAWN
5
$254,260
790
$232,799
688
$241,190
75
$154,687
4
$169,235
207
$199,873
1
$158,150
FILES CLOSED FOR INCOMPLETENESS
1
$131,860
167
$195,250
181
$274,858
14
$196,197
0
$0
58
$251,860
0
$0
Aggregated Statistics For Year 2004 (Based on 4 full and 2 partial tracts)
A) FHA, FSA/RHS & VA Home Purchase Loans
B) Conventional Home Purchase Loans
C) Refinancings
D) Home Improvement Loans
E) Loans on Dwellings For 5+ Families
F) Non-occupant Loans on < 5 Family Dwellings (A B C & D)
G) Loans On Manufactured Home Dwelling (A B C & D)
Number
Average Value
Number
Average Value
Number
Average Value
Number
Average Value
Number
Average Value
Number
Average Value
Number
Average Value
LOANS ORIGINATED
85
$167,606
3,039
$236,340
2,258
$229,359
235
$124,814
20
$997,308
957
$217,884
3
$86,037
APPLICATIONS APPROVED, NOT ACCEPTED
6
$192,247
611
$229,524
321
$228,221
37
$102,292
0
$0
171
$231,298
0
$0
APPLICATIONS DENIED
11
$151,159
690
$244,396
807
$216,745
178
$72,983
0
$0
234
$213,351
5
$61,316
APPLICATIONS WITHDRAWN
9
$193,541
529
$240,970
619
$235,542
52
$105,042
0
$0
143
$230,082
0
$0
FILES CLOSED FOR INCOMPLETENESS
2
$239,905
146
$194,775
160
$249,652
16
$113,607
0
$0
35
$268,803
0
$0
Aggregated Statistics For Year 2003 (Based on 4 full and 2 partial tracts)
A) FHA, FSA/RHS & VA Home Purchase Loans
B) Conventional Home Purchase Loans
C) Refinancings
D) Home Improvement Loans
E) Loans on Dwellings For 5+ Families
F) Non-occupant Loans on < 5 Family Dwellings (A B C & D)
Number
Average Value
Number
Average Value
Number
Average Value
Number
Average Value
Number
Average Value
Number
Average Value
LOANS ORIGINATED
184
$156,930
2,752
$187,101
2,684
$183,429
95
$35,339
0
$0
828
$163,991
APPLICATIONS APPROVED, NOT ACCEPTED
7
$177,591
411
$177,333
421
$181,559
38
$34,233
2
$21,901,000
135
$188,927
APPLICATIONS DENIED
25
$134,958
473
$188,278
839
$167,352
113
$47,007
0
$0
134
$161,144
APPLICATIONS WITHDRAWN
36
$150,675
447
$163,928
569
$186,463
15
$31,519
0
$0
118
$150,777
FILES CLOSED FOR INCOMPLETENESS
3
$208,580
101
$140,997
115
$174,923
6
$44,875
0
$0
15
$117,185
Aggregated Statistics For Year 1999 (Based on 1 partial tract)
A) FHA, FSA/RHS & VA Home Purchase Loans
B) Conventional Home Purchase Loans
C) Refinancings
D) Home Improvement Loans
F) Non-occupant Loans on < 5 Family Dwellings (A B C & D)
2002 - 2018 National Fire Incident Reporting System (NFIRS) incidents
According to the data from the years 2002 - 2018 the average number of fires per year is 45. The highest number of fires - 81 took place in 2018, and the least - 0 in 2003. The data has a rising trend.
When looking into fire subcategories, the most incidents belonged to: Outside Fires (51.3%), and Structure Fires (24.6%).
Fire incident types reported to NFIRS in Zip Code 89113
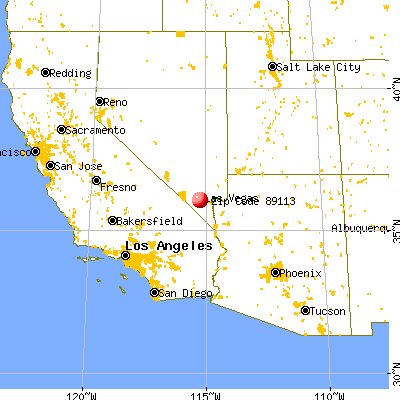


 Nearest zip codes: 89148, 89118, 89147, 89139, 89178, 89103.


 According to the data from the years 2002 - 2018 the average number of fires per year is 45. The highest number of fires - 81 took place in 2018, and the least - 0 in 2003. The data has a rising trend.
 When looking into fire subcategories, the most incidents belonged to: Outside Fires (51.3%), and Structure Fires (24.6%).