Estimated zip code population in 2022: 23,650 Zip code population in 2010: 19,318 Zip code population in 2000: 16,471
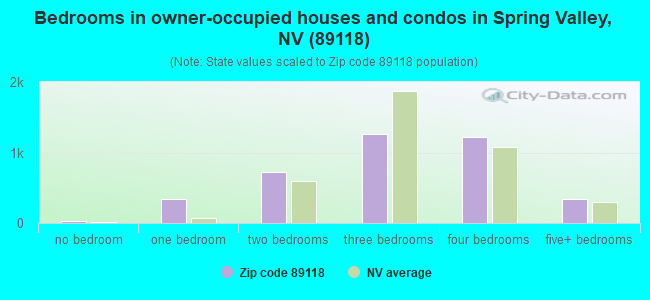
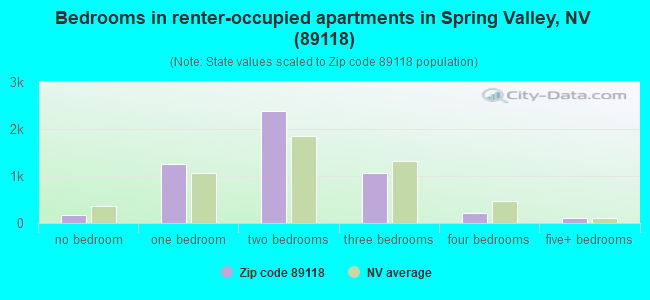
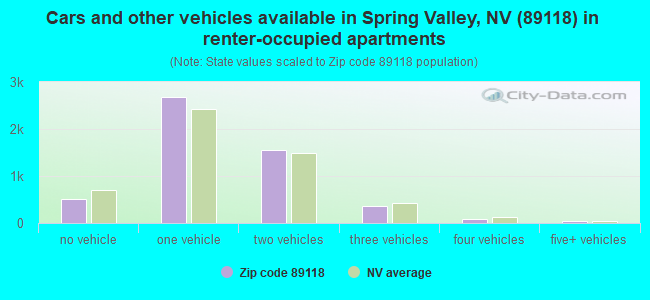
Houses and condos: 10,435 Renter-occupied apartments: 5,200
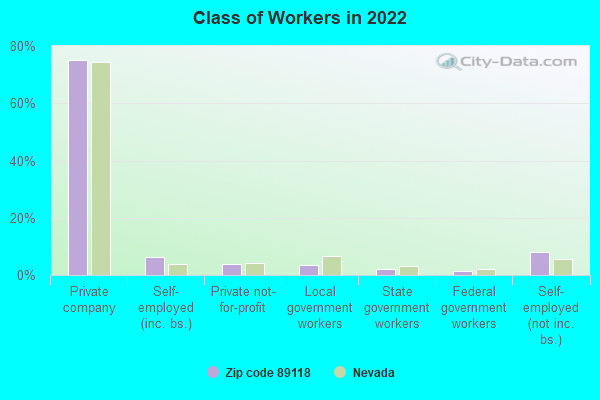
% of renters here:
57%
State:
40%
March 2022 cost of living index in zip code 89118: 99.8 (near average, U.S. average is 100)
Land area: 10.6 sq. mi. Water area: 0.0 sq. mi.
Population density: 2,235 people per square mile
(low).
OSM Map
General Map
Google Map
MSN Map
OSM Map
General Map
Google Map
MSN Map
OSM Map
General Map
Google Map
MSN Map
OSM Map
General Map
Google Map
MSN Map
Please wait while loading the map...
Real estate property taxes paid for housing units in 2022:
This zip code:
0.4% ($1,834)
Nevada:
0.4% ($1,889)
Median real estate property taxes paid for housing units with mortgages in 2022: $1,761 (0.4%) Median real estate property taxes paid for housing units with no mortgage in 2022: $2,100 (0.5%)
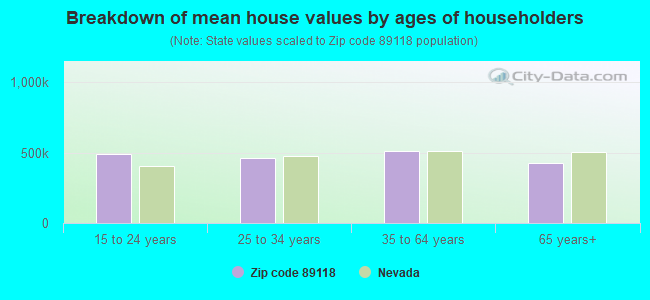
Estimated median house/condo value in 2022: $433,304
89118:
$433,304
Nevada:
$434,700
According to our research of Nevada and other state lists, there were 49 registered sex offenders living in 89118 zip code as of April 27, 2024. The ratio of all residents to sex offenders in zip code 89118 is 428 to 1. The ratio of registered sex offenders to all residents in this zip code is lower than the state average.
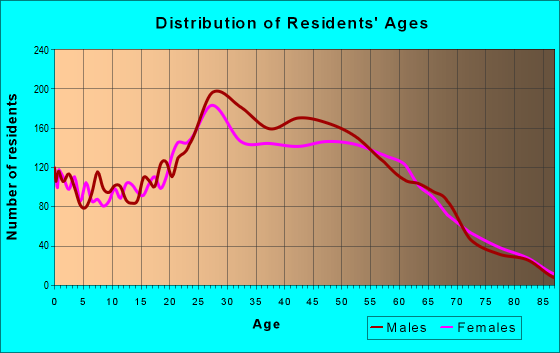
Median resident age:
This zip code:
40.9 years
Nevada median age:
39.0 years
Average household size:
This zip code:
2.5 people
Nevada:
2.6 people
Averages for the 2020 tax year for zip code 89118, filed in 2021:
Average Adjusted Gross Income (AGI) in 2020: $69,401 (Individual Income Tax Returns)
Here:
$69,401
State:
$78,964
Salary/wage: $43,318 (reported on 81.0% of returns)
Here:
$43,318
State:
$54,472
(% of AGI for various income ranges: 1133.4% for AGIs below $25k, 3245.3% for AGIs $25k-50k, 6343.0% for AGIs $50k-75k, 9023.7% for AGIs $75k-100k, 17528.3% for AGIs $100k-200k, 88760.0% for AGIs over 200k)
Taxable interest for individuals: $2,478 (reported on 18.3% of returns)
This zip code:
$2,478
Nevada:
$3,521
(% of AGI for various income ranges: 9.4% for AGIs below $25k, 8.8% for AGIs $25k-50k, 16.0% for AGIs $50k-75k, 66.7% for AGIs $75k-100k, 190.7% for AGIs $100k-200k, 3520.0% for AGIs over 200k)
Ordinary dividends: $7,231 (reported on 10.9% of returns)
Here:
$7,231
State:
$13,390
(% of AGI for various income ranges: 10.7% for AGIs below $25k, 13.5% for AGIs $25k-50k, 55.0% for AGIs $50k-75k, 148.2% for AGIs $75k-100k, 475.2% for AGIs $100k-200k, 5165.0% for AGIs over 200k)
Net capital gain/loss in AGI: +$66,773 (reported on 13.3% of returns)
Here:
+$66,773
State:
+$63,025
(% of AGI for various income ranges: 17.3% for AGIs below $25k, 19.9% for AGIs $25k-50k, 86.9% for AGIs $50k-75k, 187.8% for AGIs $75k-100k, 1248.7% for AGIs $100k-200k, 98668.0% for AGIs over 200k)
Profit/loss from business: +$11,203 (reported on 21.6% of returns)
Here:
+$11,203
State:
+$11,500
(% of AGI for various income ranges: 124.6% for AGIs below $25k, 131.1% for AGIs $25k-50k, 233.1% for AGIs $50k-75k, 311.6% for AGIs $75k-100k, 645.9% for AGIs $100k-200k, 14105.0% for AGIs over 200k)
Taxable individual retirement arrangement distribution: $18,569 (reported on 4.1% of returns)
89118:
$18,569
Nevada:
$23,628
(% of AGI for various income ranges: 38.2% for AGIs below $25k, 35.2% for AGIs $25k-50k, 83.8% for AGIs $50k-75k, 255.9% for AGIs $75k-100k, 584.6% for AGIs $100k-200k, 1904.0% for AGIs over 200k)
Self-employed (Keogh) retirement plans: $17,500 (reported on 0.2% of returns)
89118:
$17,500
Nevada:
$26,634
(% of AGI for various income ranges: 11.3% for AGIs below $25k)
Total itemized deductions: $53,396 (reported on 7.5% of returns)
Here:
$53,396
State:
$44,173
(% of AGI for various income ranges: 42.3% for AGIs below $25k, 113.5% for AGIs $25k-50k, 362.8% for AGIs $50k-75k, 730.2% for AGIs $75k-100k, 1748.7% for AGIs $100k-200k, 27893.0% for AGIs over 200k)
Charity contributions: $11,024 (reported on 5.8% of returns)
Here:
$11,024
State:
$12,589
(% of AGI for various income ranges: 3.6% for AGIs below $25k, 16.6% for AGIs $25k-50k, 50.0% for AGIs $50k-75k, 106.5% for AGIs $75k-100k, 230.4% for AGIs $100k-200k, 4922.0% for AGIs over 200k)
Taxes paid: $5,567 (reported on 7.5% of returns)
89118:
$5,567
State:
$6,112
(% of AGI for various income ranges: 6.3% for AGIs below $25k, 21.8% for AGIs $25k-50k, 58.6% for AGIs $50k-75k, 131.0% for AGIs $75k-100k, 270.4% for AGIs $100k-200k, 1568.0% for AGIs over 200k)
Earned income credit: $1,922 (reported on 19.2% of returns)
Here:
$1,922
State:
$2,214
(% of AGI for various income ranges: 81.9% for AGIs below $25k, 61.6% for AGIs $25k-50k, 0.8% for AGIs $50k-75k)
Percentage of individuals using paid preparers for their 2020 taxes: 92.5%
Here:
92%
State:
93%
(% for various income ranges: 91.8% for AGIs below $25k, 93.6% for AGIs $25k-50k, 92.4% for AGIs $50k-75k, 91.9% for AGIs $75k-100k, 92.2% for AGIs $100k-200k, 90.2% for AGIs over 200k)
Averages for the 2012 tax year for zip code 89118, filed in 2013:
Average Adjusted Gross Income (AGI) in 2012: $54,783 (Individual Income Tax Returns)
Here:
$54,783
State:
$61,164
Salary/wage: $40,186 (reported on 86.5% of returns)
Here:
$40,186
State:
$45,924
(% of AGI for various income ranges: 81.2% for AGIs below $25k, 88.7% for AGIs $25k-50k, 81.9% for AGIs $50k-75k, 75.7% for AGIs $75k-100k, 70.2% for AGIs $100k-200k, 25.2% for AGIs over 200k)
Taxable interest for individuals: $2,932 (reported on 18.6% of returns)
This zip code:
$2,932
Nevada:
$3,137
(% of AGI for various income ranges: 0.5% for AGIs below $25k, 0.3% for AGIs $25k-50k, 0.5% for AGIs $50k-75k, 0.6% for AGIs $75k-100k, 1.0% for AGIs $100k-200k, 2.0% for AGIs over 200k)
Ordinary dividends: $15,976 (reported on 9.6% of returns)
Here:
$15,976
State:
$11,762
(% of AGI for various income ranges: 1.6% for AGIs below $25k, 0.7% for AGIs $25k-50k, 0.9% for AGIs $50k-75k, 0.9% for AGIs $75k-100k, 2.0% for AGIs $100k-200k, 6.4% for AGIs over 200k)
Net capital gain/loss in AGI: +$49,915 (reported on 9.7% of returns)
Here:
+$49,915
State:
+$33,127
(% of AGI for various income ranges: 0.4% for AGIs $25k-50k, 0.5% for AGIs $50k-75k, 0.7% for AGIs $75k-100k, 1.0% for AGIs $100k-200k, 27.1% for AGIs over 200k)
Profit/loss from business: +$9,465 (reported on 14.2% of returns)
Here:
+$9,465
State:
+$12,567
(% of AGI for various income ranges: 7.6% for AGIs below $25k, 1.7% for AGIs $25k-50k, 2.2% for AGIs $50k-75k, 2.1% for AGIs $75k-100k, 3.0% for AGIs $100k-200k, 1.3% for AGIs over 200k)
Taxable individual retirement arrangement distribution: $19,114 (reported on 4.3% of returns)
89118:
$19,114
Nevada:
$20,808
(% of AGI for various income ranges: 1.2% for AGIs below $25k, 0.7% for AGIs $25k-50k, 1.3% for AGIs $50k-75k, 2.9% for AGIs $75k-100k, 3.2% for AGIs $100k-200k, 1.1% for AGIs over 200k)
Total itemized deductions: $25,179 (20% of AGI, reported on 23.9% of returns)
Here:
$25,179
State:
$26,148
Here:
20.5% of AGI
State:
20.0% of AGI
(% of AGI for various income ranges: 8.5% for AGIs below $25k, 9.8% for AGIs $25k-50k, 11.0% for AGIs $50k-75k, 13.5% for AGIs $75k-100k, 14.3% for AGIs $100k-200k, 10.6% for AGIs over 200k)
Charity contributions: $4,153 (reported on 19.4% of returns)
Here:
$4,153
State:
$4,329
(% of AGI for various income ranges: 0.6% for AGIs below $25k, 1.1% for AGIs $25k-50k, 1.4% for AGIs $50k-75k, 1.4% for AGIs $75k-100k, 1.7% for AGIs $100k-200k, 2.0% for AGIs over 200k)
Taxes paid: $4,622 (reported on 23.2% of returns)
89118:
$4,622
State:
$5,116
(% of AGI for various income ranges: 1.1% for AGIs below $25k, 1.4% for AGIs $25k-50k, 1.9% for AGIs $50k-75k, 2.2% for AGIs $75k-100k, 2.8% for AGIs $100k-200k, 2.2% for AGIs over 200k)
Earned income credit: $1,999 (reported on 21.4% of returns)
Here:
$1,999
State:
$2,279
(% of AGI for various income ranges: 5.7% for AGIs below $25k, 0.9% for AGIs $25k-50k)
Percentage of individuals using paid preparers for their 2012 taxes: 57.5%
Here:
57%
State:
55%
(% for various income ranges: 54.5% for AGIs below $25k, 57.9% for AGIs $25k-50k, 56.1% for AGIs $50k-75k, 59.3% for AGIs $75k-100k, 66.7% for AGIs $100k-200k, 85.0% for AGIs over 200k)
Averages for the 2004 tax year for zip code 89118, filed in 2005:
Average Adjusted Gross Income (AGI) in 2004: $53,847 (Individual Income Tax Returns)
Here:
$53,847
State:
$58,367
Salary/wage: $37,795 (reported on 89.0% of returns)
Here:
$37,795
State:
$42,695
(% of AGI for various income ranges: 886.3% for AGIs below $10k, 87.0% for AGIs $10k-25k, 88.6% for AGIs $25k-50k, 83.4% for AGIs $50k-75k, 75.8% for AGIs $75k-100k, 33.9% for AGIs over 100k)
Taxable interest for individuals: $4,355 (reported on 28.2% of returns)
This zip code:
$4,355
Nevada:
$3,867
(% of AGI for various income ranges: 25.2% for AGIs below $10k, 1.1% for AGIs $10k-25k, 0.5% for AGIs $25k-50k, 1.0% for AGIs $50k-75k, 1.1% for AGIs $75k-100k, 3.8% for AGIs over 100k)
Taxable dividends: $4,532 (reported on 12.9% of returns)
Here:
$4,532
State:
$5,770
(% of AGI for various income ranges: 16.4% for AGIs below $10k, 0.3% for AGIs $10k-25k, 0.5% for AGIs $25k-50k, 0.6% for AGIs $50k-75k, 0.5% for AGIs $75k-100k, 1.7% for AGIs over 100k)
Net capital gain/loss: +$33,166 (reported on 12.7% of returns)
Here:
+$33,166
State:
+$50,644
(% of AGI for various income ranges: 10.4% for AGIs below $10k, 0.1% for AGIs $10k-25k, 0.4% for AGIs $25k-50k, 0.9% for AGIs $50k-75k, 2.3% for AGIs $75k-100k, 15.9% for AGIs over 100k)
Profit/loss from business: +$13,389 (reported on 12.7% of returns)
Here:
+$13,389
State:
+$13,618
(% of AGI for various income ranges: 3.7% for AGIs below $10k, 3.6% for AGIs $10k-25k, 2.6% for AGIs $25k-50k, 1.5% for AGIs $50k-75k, 4.8% for AGIs $75k-100k, 3.6% for AGIs over 100k)
IRA payment deduction: $3,253 (reported on 2.1% of returns)
89118:
$3,253
Nevada:
$3,054
(% of AGI for various income ranges: 0.1% for AGIs $10k-25k, 0.2% for AGIs $25k-50k, 0.2% for AGIs $50k-75k, 0.2% for AGIs $75k-100k, 0.1% for AGIs over 100k)
Self-employed pension: $18,188 (reported on 0.4% of returns)
Here:
$18,188
Nevada:
$16,706
Total itemized deductions: $21,811 (21% of AGI, reported on 33.0% of returns)
Here:
$21,811
State:
$22,990
Here:
20.9% of AGI
State:
21.8% of AGI
(% of AGI for various income ranges: 100.3% for AGIs below $10k, 11.6% for AGIs $10k-25k, 13.6% for AGIs $25k-50k, 17.5% for AGIs $50k-75k, 17.8% for AGIs $75k-100k, 11.3% for AGIs over 100k)
Charity contributions deductions: $3,698 (3% of AGI, reported on 28.5% of returns)
Here:
$3,698
State:
$3,443
Here:
3.3% of AGI
State:
3.1% of AGI
(% of AGI for various income ranges: 4.3% for AGIs below $10k, 1.2% for AGIs $10k-25k, 1.4% for AGIs $25k-50k, 1.7% for AGIs $50k-75k, 2.4% for AGIs $75k-100k, 2.4% for AGIs over 100k)
Total tax: $9,630 (reported on 78.1% of returns)
89118:
$9,630
State:
$10,585
(% of AGI for various income ranges: 22.3% for AGIs below $10k, 4.4% for AGIs $10k-25k, 7.3% for AGIs $25k-50k, 9.6% for AGIs $50k-75k, 11.4% for AGIs $75k-100k, 20.7% for AGIs over 100k)
Earned income credit: $1,547 (reported on 14.7% of returns)
Here:
$1,547
State:
$1,676
Percentage of individuals using paid preparers for their 2004 taxes: 59.3%
Here:
59%
State:
60%
(% for various income ranges: 54.1% for AGIs below $10k, 58.6% for AGIs $10k-25k, 56.0% for AGIs $25k-50k, 62.8% for AGIs $50k-75k, 63.2% for AGIs $75k-100k, 78.0% for AGIs over 100k)
Likely homosexual households (counted as self-reported same-sex unmarried-partner households)
Lesbian couples: 0.2% of all households
Gay men: 0.4% of all households
Household received Food Stamps/SNAP in the past 12 months: 1,659 Household did not receive Food Stamps/SNAP in the past 12 months: 7,641
Women who had a birth in the past 12 months: 310 (224 now married, 87 unmarried) Women who did not have a birth in the past 12 months: 4,680 (1,612 now married, 3,078 unmarried)
Housing units in zip code 89118 with a mortgage: 2,566 (83 second mortgage, 75 both second mortgage and home equity loan) Houses without a mortgage: 4
Median monthly owner costs for units with a mortgage: $1,610 Median monthly owner costs for units without a mortgage: $526
Residents with income below the poverty level in 2022:
This zip code:
13.4%
Whole state:
12.5%
Residents with income below 50% of the poverty level in 2022:
This zip code:
6.2%
Whole state:
5.9%
Median number of rooms in houses and condos:
Here:
5.7
State:
6.0
Median number of rooms in apartments:
Here:
4.1
State:
4.2
Notable locations in this zip code not listed on our city pages
Notable locations in zip code 89118: Las Vegas Water Pollution Control Facility (A), Russell Campus Operations Center (B), Clark County Fire Department Station 21 (C). Display/hide their locations on the map
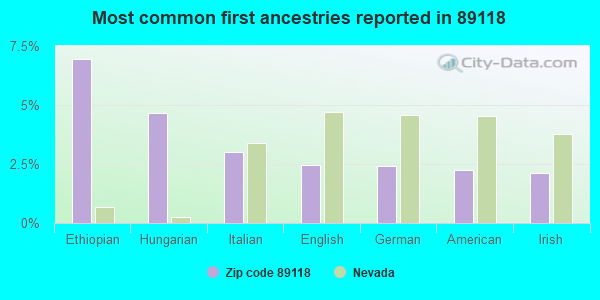
Churches in zip code 89118 include: Kingdom Hall of Jehovahs Witnesses (A), Ethiopian Word of Faith Church (B), Deliverance is Here Right Now Church (C). Display/hide their locations on the map
Tourist attractions (not listed on the city page) : The Las Vegas Photography Co. (Cultural Attractions- Events- & Facilities; 4680 W. Russell Rd. Ste A), Horizon Vending Service (Amusement & Theme Parks; 4145 West Ali Baba Lane Suite C), Big Time Amusement (Amusement & Theme Parks; 4993 West Diablo Drive), Able Amusement & Vending (Amusement & Theme Parks; 5675 South Valley View Boulevard), Showcase Slots (Amusement & Theme Parks; 3430 West Sunset Road), Las Vegas Travelog (7181 South Industrial Road), Desert Fox Hummer Tours (Tours & Charters; 6265 Dean Martin Drive).
1,840 married couples with children.
1,710 single-parent households (719 men, 991 women).
59.0% of residents of 89118 zip code speak English at home.
12.2% of residents speak Spanish at home (65% very well, 21% well, 11% not well, 4% not at all).
4.7% of residents speak other Indo-European language at home (63% very well, 33% well, 3% not well, 2% not at all).
13.1% of residents speak Asian or Pacific Island language at home (60% very well, 29% well, 8% not well, 3% not at all).
10.0% of residents speak other language at home (49% very well, 33% well, 9% not well, 8% not at all).
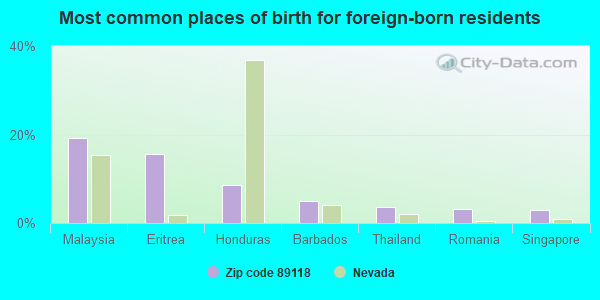
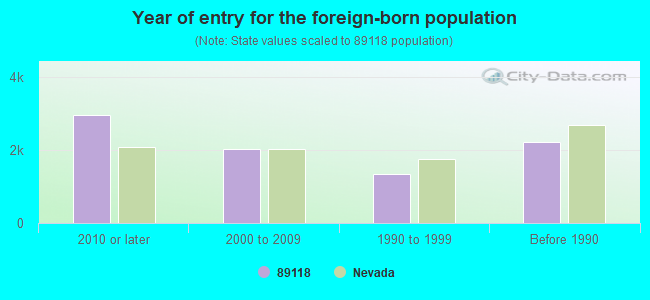
Foreign born population: 7,578 (32.0%) (64.1% of them are naturalized citizens)
Major facilities with environmental interests located in this zip code:
FEDERAL SIGN (3900 W DEWEY DR in LAS VEGAS, NV)
STATE MASTER (NV-FP) - STORMWATER-ISW-148, NPDES STORMWATER PERMIT Conditionally Exempt Small Quantity Generators, less than 100 kg/month of hazardous waste (Resource Conservation and Recovery Act (tracking hazardous waste)) - notification Organizations: FEDERAL SIGNAL CORPORATION (CONTACT/OWNER)
, FEDERAL HEATH SIGN COMPANY (CONTACT/OWNER)
Alternative names: LAS VEGAS WASH, SIGN SYSTEMS A DIV. OF FED. SIGNAL CORP.
NEVADA PAINT AND POWDER FINISHING INC (5775 S POLARIS AVE in LAS VEGAS, NV)
(Resource Conservation and Recovery Act (tracking hazardous waste)) Organizations: JOE A TIEP (CONTACT/OWNER)
, JOE GERALD TIEP (CONTACT/OWNER)
Alternative names: CARROUSEL PARTY FAVORS INC
MARION B EARL ELEMENTARY SCHOOL (6650 W RENO AVENUE in LAS VEGAS, NV)
(Geographic Names Information System) (National Center for Education Statistics) - STATE ID-02-296 Organizations: CLARK CO SCH DIST (SCHOOL DISTRICT)
Alternative names: EARL, MARION ELEM
KC ASPHALT LLC LAS VEGAS (3901 WEST PONDEROSA WAY in LAS VEGAS, NV)
CRITERIA AND HAZARDOUS AIR POLLUTANT INVENTORY (Inventory of air pollution sources) Conditionally Exempt Small Quantity Generators, less than 100 kg/month of hazardous waste (Resource Conservation and Recovery Act (tracking hazardous waste)) TRI REPORTER (Tracking of toxic chemicals releasing facilities) Business SIC classification: ASPHALT PAVING MIXTURES AND BLOCKS Business NAICS classification: ASPHALT PAVING MIXTURE AND BLOCK MANUFACTURING. Organizations: CONOCO INC (CONTACT/OPERATOR)
, KOCH PERFORMANCE ASPHALT CO (CONTACT/OPERATOR)
, CONOCO INC (CONTACT/OWNER)
Alternative names: CONOCO INCORPORATED, CONOCO LOS VEGAS TRANSPORT TERMINAL2 INV, CONOCO LOS VEGAS TRANSPORT TERMINAL 2 INV, KOCH PERFORMANCE ASPHALT COMPANY, KOCH PERFORMANCE ASPHALT CO. LAS VEGAS, KOCH PERFORMANCE ASPHALT CO. LAS VEGAS NV
SAWYER, GRANT MIDSCH (5450 REDWOOD STREET in LAS VEGAS, NV)
(National Center for Education Statistics) - STATE ID-02-328 Organizations: CLARK CO SCH DIST (SCHOOL DISTRICT)
AUTO QUEST WEST COLLISION CENTER (4801 W BELL DR in LAS VEGAS, NV)
Conditionally Exempt Small Quantity Generators, less than 100 kg/month of hazardous waste (Resource Conservation and Recovery Act (tracking hazardous waste)) (Resource Conservation and Recovery Act (tracking hazardous waste)) Business NAICS classification: AUTOMOTIVE BODY, PAINT, AND INTERIOR REPAIR AND MAINTENANCE. Organizations: BLACK DIAMOND (CONTACT/OWNER)
, BELL PROPERTIES (CONTACT/OWNER)
Alternative names: BLACK DIAMOND AUTO BODY
HELENA CHEMICAL CO (3650 W DEWEY DR in LAS VEGAS, NV)
(Integrated Compliance Information System) - ICIS-09-1999-0074, FORMAL ENFORCEMENT ACTION
FRIAS COVERT TRANSPORTA (5010 S VALLEY VIEW BLVD in LAS VEGAS, NV)
HAZARDOUS WASTE BIENNIAL REPORTER (Resource Conservation and Recovery Act (tracking hazardous waste)) Small Quantity Generators, between 100 kg and 1000 kg of hazardous waste/month (Resource Conservation and Recovery Act (tracking hazardous waste)) Organizations: ACE CAB CO (CONTACT/OPERATOR)
, FRIAS COVERT TRANSPORTATION (CONTACT/OPERATOR)
, CHARLES FRIAS (CONTACT/OWNER)
Alternative names: ABC UNION ACE CAB COMPANY, ACE CAB CO
AL PHILLIPS THE CLEANER INCORPORATED (3250 WEST ALI BABA LANE SUITE C in LAS VEGAS, NV)
HAZARDOUS WASTE BIENNIAL REPORTER (Resource Conservation and Recovery Act (tracking hazardous waste)) Large Quantity Generators, more that 1000 kg of hazardous waste/month (Resource Conservation and Recovery Act (tracking hazardous waste))
REGENCY CABINETS (5975 S POLARIS AVE in LAS VEGAS, NV)
COMPLIANCE ACTIVITY (Tracking inspections of insecticide, fungicide, and rodenticide, and toxic substances) (Resource Conservation and Recovery Act (tracking hazardous waste)) Business SIC classification: WOOD KITCHEN CABINETS Organizations: LARELL L STEPHENSEN (CONTACT/OWNER)
GREAT WESTERN PRINTING CO INC (4525 W HACIENDA in LAS VEGAS, NV)
(Resource Conservation and Recovery Act (tracking hazardous waste)) Organizations: RICHARD J SECCHIAROLI (CONTACT/OWNER)
OLSON GLASS CO OF NEVADA (5675 S VALLEY VW BLVD in LAS VEGAS, NV)
(Resource Conservation and Recovery Act (tracking hazardous waste))
AD-ART SIGNS INC (3921 W OQUENDO AVE in LAS VEGAS, NV)
Housing units lacking complete plumbing facilities: 0.2% Housing units lacking complete kitchen facilities: 0.9%
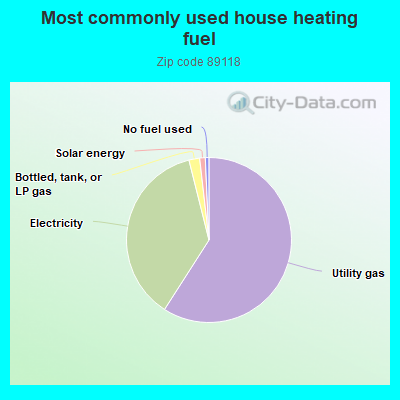
58.9%Utility gas
36.9%Electricity
2.1%Bottled, tank, or LP gas
1.1%Solar energy
0.7%No fuel used
Population in 1990: 9,932. Population change in the 1990s: +6,539 (+65.8%).
Place of birth for U.S.-born residents:
This state: 4,708
Northeast: 1,652
Midwest: 1,866
South: 1,283
West: 5,802
28% of the 89118 zip code residents lived in the same house 5 years ago. Out of people who lived in different houses, 51% lived in this county. Out of people who lived in different counties, 50% lived in Nevada.
82% of the 89118 zip code residents lived in the same house 1 year ago. Out of people who lived in different houses, 63% moved from this county. Out of people who lived in different houses, 2% moved from different county within same state. Out of people who lived in different houses, 27% moved from different state. Out of people who lived in different houses, 5% moved from abroad.
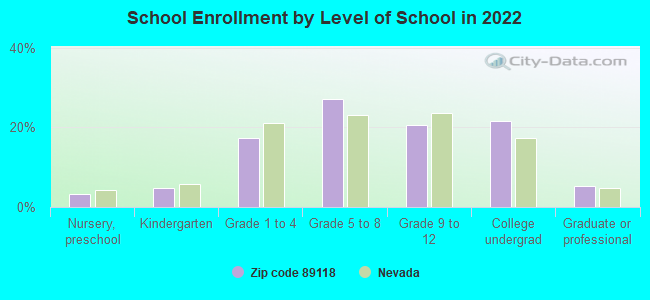
Private vs. public school enrollment:
Students in private schools in grades 1 to 8 (elementary and middle school): 205
Here:
12.2%
Nevada:
12.9%
Students in private schools in grades 9 to 12 (high school): 80
Here:
10.3%
Nevada:
6.9%
Students in private undergraduate colleges: 99
Here:
11.9%
Nevada:
16.0%
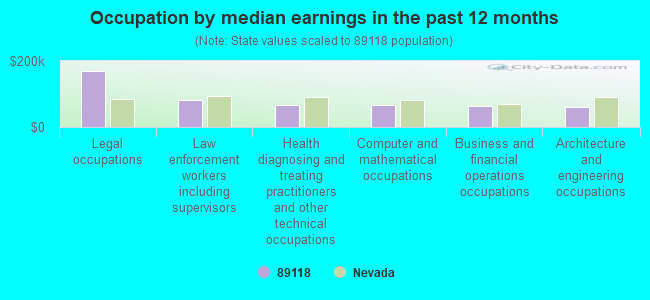
Occupation by median earnings in the past 12 months ($)
169,531Legal occupations
82,726Law enforcement workers including supervisors
67,625Health diagnosing and treating practitioners and other technical occupations
66,119Computer and mathematical occupations
63,764Business and financial operations occupations
59,796Architecture and engineering occupations
Companies with biggest federal contracts located in this zip code (LAS VEGAS, NV):
FLUID TECH INC (5720 S ARVILLE STREET; small business) : $7,838,751 in 250 contractsfrom 2000 to 2005
Contracts for Waste Treatment and Storage, Hazardous Substance Removal, Cleanup, and Disposal Services and Operational Support, Hazardous Substance Analysis, Other Professional Services by Defense Logistics Agency, Army, ENERGY, Department of Signed by year:2000: $1,608,210; 2001: $1,760,528; 2002: $2,157,862; 2003: $1,607,535; 2004: $442,039; 2005: $262,577; 2006: $0.
Biggest contracts:
$2,579,904 with Defense Logistics Agency for Waste Treatment and Storage. Taking place in CA. Signed on 2004-10-22. Completion date: 2004-11-21.
$632,644, same as above.Signed on 2004-05-10. Completion date: 2004-05-11.
$568,861 with Army for Hazardous Substance Removal, Cleanup, and Disposal Services and Operational Support. Taking place in CA. Signed on 2001-06-05. Completion date: 2001-12-31.
$390,618, same as above.Signed on 2002-06-03. Completion date: 2002-03-31.
VEGAS FASTENER MFG LLC (4315 W OQUENDO RD; small business) : $1,027,588 in 145 contractsfrom 2002 to 2006
Contracts for Nuts and Washers, Screws, Bolts, Studs, and moreby Navy, Defense Logistics Agency Signed by year:2000: $0; 2001: $0; 2002: $181,595; 2003: $119,548; 2004: $113,829; 2005: $386,463; 2006: $226,153.
Biggest contracts:
$119,548 with Navy for Nuts and Washers. Signed on 2003-08-25. Completion date: 2004-02-26.
$99,983 with Defense Logistics Agency for Screws. Signed on 2002-03-20. Completion date: 2002-05-01.
$69,498 with Defense Logistics Agency for Bolts. Signed on 2005-06-02. Completion date: 2005-10-28.
$56,440, same as above.Signed on 2002-03-28. Completion date: 2002-08-19.
LOMBARDO IMPORTS, INC (3250 W ALI BABA LN STE J; small business) : $684,339 in 96 contractsfrom 2004 to 2006
Contracts for Fruits and Vegetables by Defense Logistics Agency Signed by year:2000: $0; 2001: $0; 2002: $0; 2003: $0; 2004: $140,064; 2005: $59,682; 2006: $484,593.
Biggest contracts:
$19,879 with Defense Logistics Agency for Fruits and Vegetables. Signed on 2006-06-24. Completion date: 2006-06-24.
$16,428, same as above.Signed on 2006-05-27. Completion date: 2006-05-27.
$16,385, same as above.Signed on 2006-06-10. Completion date: 2006-06-10.
$15,858, same as above.Signed on 2006-06-17. Completion date: 2006-06-17.
VEGAS VALLEY LOCKING SYSTEMS, (6243 INDUSTRIAL ROAD; small business) : $358,660 in 5 contractsfrom 2003 to 2006
Contracts for Communications Security Equipment and Components, ADP Components, Hardware, Commercial, Radio and Television Communication Equipment, Except Airborne, and moreby Department of Veterans Affairs, Air Force Signed by year:2000: $0; 2001: $0; 2002: $0; 2003: $335,934; 2004: $0; 2005: $5,600; 2006: $17,126.
Biggest contracts:
$199,254 with Department of Veterans Affairs for Communications Security Equipment and Components. Signed on 2003-09-15. Completion date: 2003-12-15.
$71,772 with Air Force for ADP Components. Signed on 2003-12-31. Completion date: 2005-01-04.
$64,908 with Air Force for Hardware, Commercial. Signed on 2003-08-01. Completion date: 2003-08-08.
$17,126 with Air Force for Radio and Television Communication Equipment, Except Airborne. Signed on 2006-02-23. Completion date: 2006-04-07.
COLLINS PRODUCE ACQUISITION CO (5420 S VALLEY VIEW) : $229,993 in 22 contractsfrom 2000 to 2006
Contracts for Fruits and Vegetables by Defense Logistics Agency Signed by year:2000: $137,596; 2001: $0; 2002: $0; 2003: $0; 2004: $0; 2005: $79,744; 2006: $12,653.
Biggest contracts:
$32,399 with Defense Logistics Agency for Fruits and Vegetables. Signed on 2000-03-31. Completion date: 2000-03-31.
$27,902, same as above.Signed on 2000-05-30. Completion date: 2000-05-30.
$26,371, same as above.Signed on 2000-06-19. Completion date: 2000-06-19.
$25,675, same as above.Signed on 2000-04-22. Completion date: 2000-04-22.
NON FERROUS BOLT & MFG COMPANY (3850 PONDEROSA; small business)
$194,964 with Navy for Bolts. Signed on 2000-05-05. Completion date: 2001-02-04.
FISHER FORGING INC (SUITE 106; small business) : $175,182 in 10 contractsfrom 2002 to 2004
Contracts for Airframe Structural Components, Bars and Rods, Nonferrous Base Metal, Plate, Sheet, Strip, and Foil; Nonferrous Base Metal, Bars and Rods by Navy Signed by year:2000: $0; 2001: $0; 2002: $87,394; 2003: $84,028; 2004: $3,760; 2005: $0; 2006: $0.
Biggest contracts:
$45,444 with Navy for Airframe Structural Components. Taking place in CA. Signed on 2002-09-11. Completion date: 2003-01-16.
$43,069 with Navy for Bars and Rods, Nonferrous Base Metal. Signed on 2003-08-22. Completion date: 2004-01-06.
$41,950 with Navy for Airframe Structural Components. Taking place in CA. Signed on 2002-05-13. Completion date: 2002-09-30.
$16,439 with Navy for Plate, Sheet, Strip, and Foil; Nonferrous Base Metal. Signed on 2003-08-14. Completion date: 2003-12-31.
STG ENTERPRISES INC (3926 PONDEROSA WAY; small business) : $132,496 in 2 contractsfrom 2001 to 2002
$90,340 with Air Force for Carpet Laying and Cleaning. Signed on 2002-09-28. Completion date: 2002-09-28.
$42,156, same as above.Signed on 2001-01-03. Completion date: 2001-03-03.
IMPACT AUDIO VISUAL INCORPORAT (3855 W DIABLO DR STE 9; small business) : $96,426 in 2 contractsin 2005
$48,426 with Air Force for Installation of Equipment -- Miscellaneous. Signed on 2005-11-08. Completion date: 2005-11-10.
$48,000 with Air Force for Lease or Rental of Equipment -- Miscellaneous. Taking place in AR. Signed on 2005-09-09. Completion date: 2005-10-09.
ENCORE PRODUCTIONS, INC (5150 S DECATUR; small business) : $79,850 in 6 contractsfrom 2005 to 2006
Contracts for Other Management Support Services, Audio/Visual Services by Defense Information Systems Agency, EPA Signed by year:2000: $0; 2001: $0; 2002: $0; 2003: $0; 2004: $0; 2005: $4,993; 2006: $74,857.
Biggest contracts:
$84,162 with Defense Information Systems Agency for Other Management Support Services. Signed on 2006-04-28. Completion date: 2006-06-30.
$1,940 with EPA for Audio/Visual Services. Signed on 2005-04-06. Completion date: 2005-06-15.
$1,619, same as above.Signed on 2005-05-16. Completion date: 2005-06-15.
$1,550, same as above.Signed on 2005-05-12. Completion date: 2005-06-15.
Top industries in this zip code by the number of employees in 2005:
Real Estate and Rental and Leasing: Other Commercial and Industrial Machinery and Equipment Rental and Leasing (500-999: 1, 100-249: 1, 50-99: 2, 20-49: 1, 10-19: 1, 5-9: 3, 1-4: 4)
People in group quarters in 2010:
174 people in correctional residential facilities
26 people in group homes intended for adults
12 people in group homes for juveniles (non-correctional)
People in group quarters in 2000:
65 people in other noninstitutional group quarters
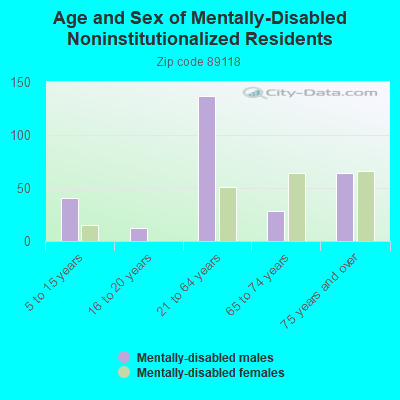
18 people in homes for the mentally retarded
4 people in homes for the mentally ill
Fatal accident statistics in 2014:
Fatal accident count: 4
Vehicles involved in fatal accidents: 5
Fatal accidents caused by drunken drivers: 2
Fatalities: 5
Persons involved in fatal accidents: 9
Pedestrians involved in fatal accidents: 0
Fatal accident statistics in 2013:
Fatal accident count: 3
Vehicles involved in fatal accidents: 4
Fatal accidents caused by drunken drivers: 1
Fatalities: 3
Persons involved in fatal accidents: 6
Pedestrians involved in fatal accidents: 1
Home Mortgage Disclosure Act Aggregated Statistics For Year 2009 (Based on 5 full and 4 partial tracts)
A) FHA, FSA/RHS & VA Home Purchase Loans
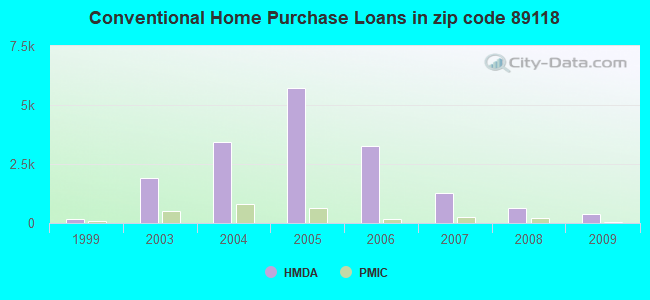
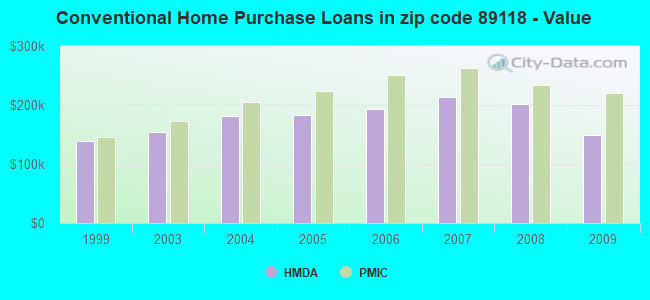
B) Conventional Home Purchase Loans
C) Refinancings
D) Home Improvement Loans
F) Non-occupant Loans on < 5 Family Dwellings (A B C & D)
G) Loans On Manufactured Home Dwelling (A B C & D)
Number
Average Value
Number
Average Value
Number
Average Value
Number
Average Value
Number
Average Value
Number
Average Value
LOANS ORIGINATED
680
$159,905
388
$149,235
401
$194,591
8
$46,156
189
$135,364
6
$138,122
APPLICATIONS APPROVED, NOT ACCEPTED
55
$153,571
52
$173,477
61
$214,952
3
$10,767
38
$185,571
0
$0
APPLICATIONS DENIED
184
$162,873
116
$137,607
229
$206,919
30
$26,288
108
$140,445
3
$80,910
APPLICATIONS WITHDRAWN
72
$167,337
59
$169,071
125
$201,293
10
$45,978
35
$173,718
0
$0
FILES CLOSED FOR INCOMPLETENESS
19
$178,304
26
$154,777
30
$210,394
3
$28,030
16
$121,281
0
$0
Aggregated Statistics For Year 2008 (Based on 5 full and 4 partial tracts)
A) FHA, FSA/RHS & VA Home Purchase Loans
B) Conventional Home Purchase Loans
C) Refinancings
D) Home Improvement Loans
E) Loans on Dwellings For 5+ Families
F) Non-occupant Loans on < 5 Family Dwellings (A B C & D)
G) Loans On Manufactured Home Dwelling (A B C & D)
Number
Average Value
Number
Average Value
Number
Average Value
Number
Average Value
Number
Average Value
Number
Average Value
Number
Average Value
LOANS ORIGINATED
419
$198,797
624
$201,785
291
$205,299
40
$69,276
4
$13,355,208
292
$168,229
0
$0
APPLICATIONS APPROVED, NOT ACCEPTED
41
$190,630
103
$208,201
82
$209,896
13
$58,473
0
$0
54
$179,041
0
$0
APPLICATIONS DENIED
91
$203,764
264
$222,892
418
$253,749
48
$38,405
0
$0
147
$186,865
3
$66,943
APPLICATIONS WITHDRAWN
55
$213,758
127
$188,250
154
$234,831
13
$135,295
0
$0
83
$183,740
0
$0
FILES CLOSED FOR INCOMPLETENESS
7
$243,706
28
$235,306
31
$175,034
5
$89,256
0
$0
13
$202,765
0
$0
Aggregated Statistics For Year 2007 (Based on 5 full and 4 partial tracts)
A) FHA, FSA/RHS & VA Home Purchase Loans
B) Conventional Home Purchase Loans
C) Refinancings
D) Home Improvement Loans
E) Loans on Dwellings For 5+ Families
F) Non-occupant Loans on < 5 Family Dwellings (A B C & D)
G) Loans On Manufactured Home Dwelling (A B C & D)
Number
Average Value
Number
Average Value
Number
Average Value
Number
Average Value
Number
Average Value
Number
Average Value
Number
Average Value
LOANS ORIGINATED
26
$268,537
1,257
$213,873
1,057
$245,273
87
$94,484
3
$47,812,000
620
$191,809
0
$0
APPLICATIONS APPROVED, NOT ACCEPTED
0
$0
277
$214,521
330
$231,636
29
$102,924
0
$0
151
$198,969
0
$0
APPLICATIONS DENIED
10
$231,596
556
$296,696
1,140
$255,673
115
$100,918
0
$0
365
$213,786
1
$54,080
APPLICATIONS WITHDRAWN
5
$236,888
287
$241,104
412
$257,608
11
$153,612
0
$0
107
$216,248
0
$0
FILES CLOSED FOR INCOMPLETENESS
0
$0
60
$346,878
141
$336,976
9
$55,599
0
$0
30
$207,048
0
$0
Aggregated Statistics For Year 2006 (Based on 5 full and 4 partial tracts)
A) FHA, FSA/RHS & VA Home Purchase Loans
B) Conventional Home Purchase Loans
C) Refinancings
D) Home Improvement Loans
E) Loans on Dwellings For 5+ Families
F) Non-occupant Loans on < 5 Family Dwellings (A B C & D)
G) Loans On Manufactured Home Dwelling (A B C & D)
Number
Average Value
Number
Average Value
Number
Average Value
Number
Average Value
Number
Average Value
Number
Average Value
Number
Average Value
LOANS ORIGINATED
15
$242,877
3,269
$193,553
1,625
$228,664
155
$124,141
2
$10,641,600
1,392
$178,211
4
$101,622
APPLICATIONS APPROVED, NOT ACCEPTED
1
$178,480
573
$201,624
377
$238,779
38
$95,616
0
$0
256
$173,412
2
$155,040
APPLICATIONS DENIED
4
$204,168
1,050
$232,410
1,118
$256,077
126
$115,357
2
$85,135
527
$208,522
6
$142,325
APPLICATIONS WITHDRAWN
2
$172,165
591
$205,021
765
$252,864
43
$147,997
0
$0
238
$189,864
1
$108,170
FILES CLOSED FOR INCOMPLETENESS
0
$0
103
$218,676
156
$257,335
5
$91,720
0
$0
35
$180,721
0
$0
Aggregated Statistics For Year 2005 (Based on 5 full and 4 partial tracts)
A) FHA, FSA/RHS & VA Home Purchase Loans
B) Conventional Home Purchase Loans
C) Refinancings
D) Home Improvement Loans
E) Loans on Dwellings For 5+ Families
F) Non-occupant Loans on < 5 Family Dwellings (A B C & D)
G) Loans On Manufactured Home Dwelling (A B C & D)
Number
Average Value
Number
Average Value
Number
Average Value
Number
Average Value
Number
Average Value
Number
Average Value
Number
Average Value
LOANS ORIGINATED
47
$200,777
5,737
$182,450
2,001
$233,122
198
$147,779
4
$13,893,500
2,287
$172,861
9
$127,971
APPLICATIONS APPROVED, NOT ACCEPTED
1
$182,980
862
$180,624
354
$221,223
50
$100,477
0
$0
322
$166,733
2
$53,210
APPLICATIONS DENIED
12
$217,128
1,488
$197,823
979
$437,648
162
$114,596
0
$0
586
$185,746
16
$71,131
APPLICATIONS WITHDRAWN
17
$206,154
1,240
$200,665
761
$242,486
81
$156,000
2
$106,415
383
$194,794
2
$113,575
FILES CLOSED FOR INCOMPLETENESS
3
$226,973
239
$194,865
144
$266,664
10
$232,618
0
$0
66
$195,452
1
$194,700
Aggregated Statistics For Year 2004 (Based on 5 full and 4 partial tracts)
A) FHA, FSA/RHS & VA Home Purchase Loans
B) Conventional Home Purchase Loans
C) Refinancings
D) Home Improvement Loans
E) Loans on Dwellings For 5+ Families
F) Non-occupant Loans on < 5 Family Dwellings (A B C & D)
G) Loans On Manufactured Home Dwelling (A B C & D)
Number
Average Value
Number
Average Value
Number
Average Value
Number
Average Value
Number
Average Value
Number
Average Value
Number
Average Value
LOANS ORIGINATED
85
$174,217
3,434
$181,085
1,866
$204,968
165
$114,507
5
$22,773,024
1,124
$173,324
12
$73,319
APPLICATIONS APPROVED, NOT ACCEPTED
11
$148,089
734
$180,067
319
$185,738
24
$67,055
0
$0
179
$173,902
4
$18,995
APPLICATIONS DENIED
13
$171,565
805
$181,669
737
$193,577
159
$61,522
0
$0
220
$175,961
8
$64,205
APPLICATIONS WITHDRAWN
21
$166,957
739
$204,304
540
$184,848
50
$81,324
2
$4,256,640
129
$179,637
1
$189,290
FILES CLOSED FOR INCOMPLETENESS
2
$152,530
153
$186,076
104
$172,079
16
$75,818
0
$0
46
$174,054
0
$0
Aggregated Statistics For Year 2003 (Based on 5 full and 4 partial tracts)
A) FHA, FSA/RHS & VA Home Purchase Loans
B) Conventional Home Purchase Loans
C) Refinancings
D) Home Improvement Loans
E) Loans on Dwellings For 5+ Families
F) Non-occupant Loans on < 5 Family Dwellings (A B C & D)
Number
Average Value
Number
Average Value
Number
Average Value
Number
Average Value
Number
Average Value
Number
Average Value
LOANS ORIGINATED
153
$153,902
1,915
$154,369
1,864
$153,348
54
$34,311
2
$9,400,080
638
$131,324
APPLICATIONS APPROVED, NOT ACCEPTED
5
$164,604
262
$149,178
383
$152,732
11
$40,985
0
$0
107
$141,302
APPLICATIONS DENIED
33
$157,879
407
$152,418
657
$150,749
109
$33,966
0
$0
147
$138,137
APPLICATIONS WITHDRAWN
23
$158,047
331
$161,108
504
$143,236
19
$64,779
0
$0
95
$132,384
FILES CLOSED FOR INCOMPLETENESS
3
$172,537
105
$145,908
105
$155,704
7
$50,903
0
$0
29
$133,190
Aggregated Statistics For Year 1999 (Based on 1 partial tract)
A) FHA, FSA/RHS & VA Home Purchase Loans
B) Conventional Home Purchase Loans
C) Refinancings
D) Home Improvement Loans
E) Loans on Dwellings For 5+ Families
F) Non-occupant Loans on < 5 Family Dwellings (A B C & D)
2002 - 2018 National Fire Incident Reporting System (NFIRS) incidents
According to the data from the years 2002 - 2018 the average number of fires per year is 115. The highest number of fires - 191 took place in 2006, and the least - 0 in 2003. The data has a growing trend.
When looking into fire subcategories, the most reports belonged to: Outside Fires (50.3%), and Mobile Property/Vehicle Fires (23.3%).
Fire incident types reported to NFIRS in Zip Code 89118
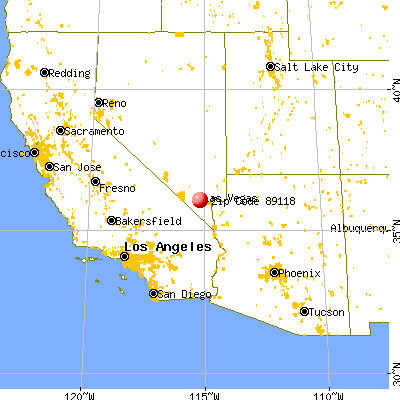


 Nearest zip codes: 89103, 89139, 89113, 89146, 89119, 89109.
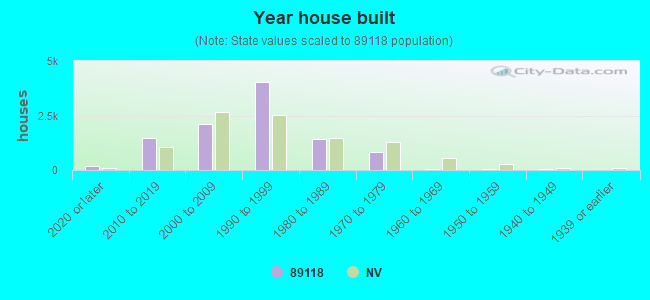


 According to the data from the years 2002 - 2018 the average number of fires per year is 115. The highest number of fires - 191 took place in 2006, and the least - 0 in 2003. The data has a growing trend.
 When looking into fire subcategories, the most reports belonged to: Outside Fires (50.3%), and Mobile Property/Vehicle Fires (23.3%).