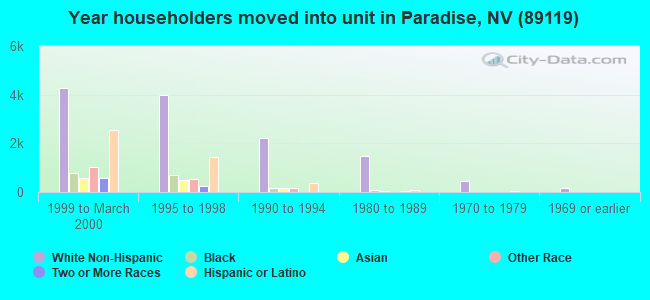
Estimated zip code population in 2022: 52,183 Zip code population in 2010: 49,445 Zip code population in 2000: 48,693
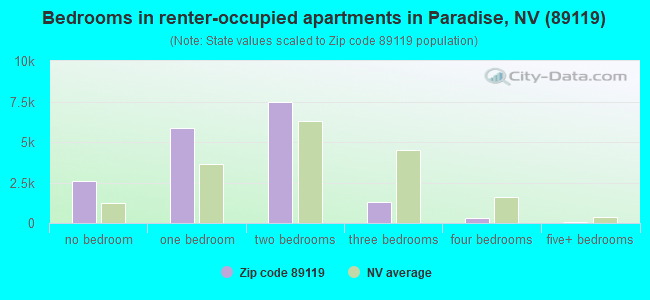
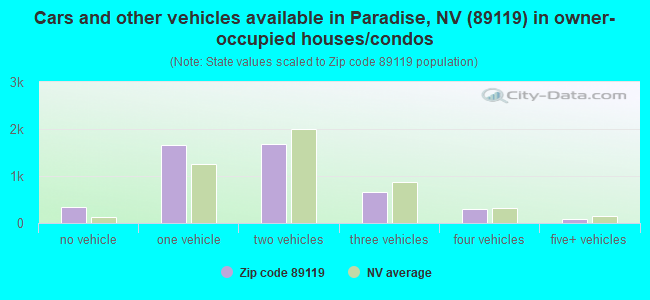
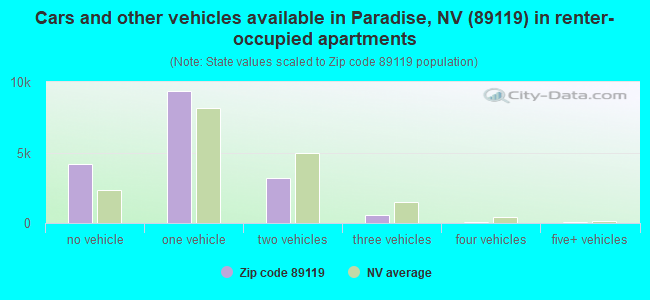
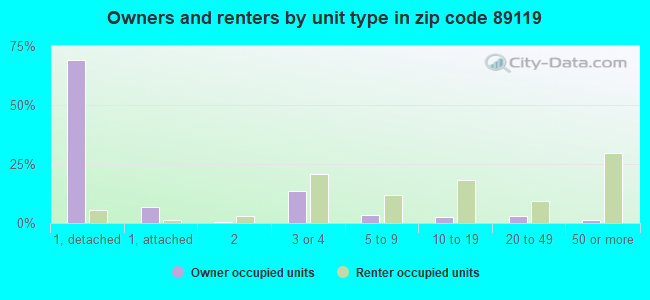
Houses and condos: 25,768 Renter-occupied apartments: 17,320
% of renters here:
79%
State:
40%
March 2022 cost of living index in zip code 89119: 99.6 (near average, U.S. average is 100)
Land area: 12.9 sq. mi. Water area: 0.0 sq. mi.
Population density: 4,036 people per square mile
(average).
OSM Map
General Map
Google Map
MSN Map
OSM Map
General Map
Google Map
MSN Map
OSM Map
General Map
Google Map
MSN Map
OSM Map
General Map
Google Map
MSN Map
Please wait while loading the map...
Real estate property taxes paid for housing units in 2022:
This zip code:
0.4% ($1,149)
Nevada:
0.4% ($1,889)
Median real estate property taxes paid for housing units with mortgages in 2022: $1,257 (0.4%) Median real estate property taxes paid for housing units with no mortgage in 2022: $689 (0.3%)
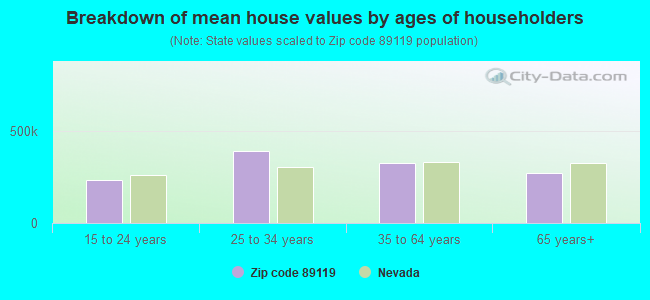
Estimated median house/condo value in 2022: $324,920
89119:
$324,920
Nevada:
$434,700
According to our research of Nevada and other state lists, there were 180 registered sex offenders living in 89119 zip code as of April 27, 2024. The ratio of all residents to sex offenders in zip code 89119 is 284 to 1. The ratio of registered sex offenders to all residents in this zip code is near the state average.
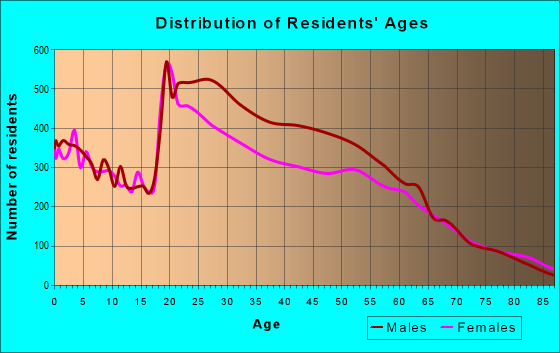
Median resident age:
This zip code:
35.5 years
Nevada median age:
39.0 years
Average household size:
This zip code:
2.2 people
Nevada:
2.6 people
Averages for the 2020 tax year for zip code 89119, filed in 2021:
Average Adjusted Gross Income (AGI) in 2020: $37,473 (Individual Income Tax Returns)
Here:
$37,473
State:
$78,964
Salary/wage: $29,794 (reported on 85.8% of returns)
Here:
$29,794
State:
$54,472
(% of AGI for various income ranges: 1192.9% for AGIs below $25k, 3454.7% for AGIs $25k-50k, 6597.2% for AGIs $50k-75k, 9362.1% for AGIs $75k-100k, 16881.6% for AGIs $100k-200k, 154163.3% for AGIs over 200k)
Taxable interest for individuals: $2,255 (reported on 10.5% of returns)
This zip code:
$2,255
Nevada:
$3,521
(% of AGI for various income ranges: 3.7% for AGIs below $25k, 4.9% for AGIs $25k-50k, 13.0% for AGIs $50k-75k, 59.1% for AGIs $75k-100k, 195.7% for AGIs $100k-200k, 11473.3% for AGIs over 200k)
Ordinary dividends: $7,225 (reported on 5.1% of returns)
Here:
$7,225
State:
$13,390
(% of AGI for various income ranges: 3.9% for AGIs below $25k, 5.2% for AGIs $25k-50k, 35.4% for AGIs $50k-75k, 111.4% for AGIs $75k-100k, 415.4% for AGIs $100k-200k, 16266.7% for AGIs over 200k)
Net capital gain/loss in AGI: +$16,753 (reported on 6.1% of returns)
Here:
+$16,753
State:
+$63,025
(% of AGI for various income ranges: 1.9% for AGIs below $25k, 11.4% for AGIs $25k-50k, 60.5% for AGIs $50k-75k, 135.1% for AGIs $75k-100k, 815.1% for AGIs $100k-200k, 58503.3% for AGIs over 200k)
Profit/loss from business: +$4,765 (reported on 17.4% of returns)
Here:
+$4,765
State:
+$11,500
(% of AGI for various income ranges: 75.8% for AGIs below $25k, 61.0% for AGIs $25k-50k, 183.3% for AGIs $50k-75k, 260.7% for AGIs $75k-100k, 549.2% for AGIs $100k-200k, 7116.7% for AGIs over 200k)
Taxable individual retirement arrangement distribution: $14,004 (reported on 2.1% of returns)
89119:
$14,004
Nevada:
$23,628
(% of AGI for various income ranges: 9.8% for AGIs below $25k, 15.2% for AGIs $25k-50k, 78.8% for AGIs $50k-75k, 126.5% for AGIs $75k-100k, 780.3% for AGIs $100k-200k)
Total itemized deductions: $39,356 (reported on 2.8% of returns)
Here:
$39,356
State:
$44,173
(% of AGI for various income ranges: 13.7% for AGIs below $25k, 66.2% for AGIs $25k-50k, 196.9% for AGIs $50k-75k, 403.2% for AGIs $75k-100k, 983.8% for AGIs $100k-200k, 34166.7% for AGIs over 200k)
Charity contributions: $17,496 (reported on 2.0% of returns)
Here:
$17,496
State:
$12,589
(% of AGI for various income ranges: 1.3% for AGIs below $25k, 9.6% for AGIs $25k-50k, 28.0% for AGIs $50k-75k, 65.8% for AGIs $75k-100k, 164.3% for AGIs $100k-200k, 19223.3% for AGIs over 200k)
Taxes paid: $5,475 (reported on 2.7% of returns)
89119:
$5,475
State:
$6,112
(% of AGI for various income ranges: 2.0% for AGIs below $25k, 12.4% for AGIs $25k-50k, 36.8% for AGIs $50k-75k, 71.9% for AGIs $75k-100k, 136.8% for AGIs $100k-200k, 2930.0% for AGIs over 200k)
Earned income credit: $2,143 (reported on 26.5% of returns)
Here:
$2,143
State:
$2,214
(% of AGI for various income ranges: 101.9% for AGIs below $25k, 66.2% for AGIs $25k-50k, 1.2% for AGIs $50k-75k)
Percentage of individuals using paid preparers for their 2020 taxes: 93.0%
Here:
93%
State:
93%
(% for various income ranges: 92.5% for AGIs below $25k, 93.6% for AGIs $25k-50k, 94.0% for AGIs $50k-75k, 91.8% for AGIs $75k-100k, 92.9% for AGIs $100k-200k, 93.8% for AGIs over 200k)
Averages for the 2012 tax year for zip code 89119, filed in 2013:
Average Adjusted Gross Income (AGI) in 2012: $38,881 (Individual Income Tax Returns)
Here:
$38,881
State:
$61,164
Salary/wage: $29,978 (reported on 88.2% of returns)
Here:
$29,978
State:
$45,924
(% of AGI for various income ranges: 83.0% for AGIs below $25k, 89.9% for AGIs $25k-50k, 82.3% for AGIs $50k-75k, 77.4% for AGIs $75k-100k, 68.9% for AGIs $100k-200k, 19.2% for AGIs over 200k)
Taxable interest for individuals: $5,326 (reported on 11.5% of returns)
This zip code:
$5,326
Nevada:
$3,137
(% of AGI for various income ranges: 0.3% for AGIs below $25k, 0.3% for AGIs $25k-50k, 0.4% for AGIs $50k-75k, 0.7% for AGIs $75k-100k, 1.5% for AGIs $100k-200k, 5.1% for AGIs over 200k)
Ordinary dividends: $12,652 (reported on 5.6% of returns)
Here:
$12,652
State:
$11,762
(% of AGI for various income ranges: 1.1% for AGIs below $25k, 0.6% for AGIs $25k-50k, 0.6% for AGIs $50k-75k, 0.7% for AGIs $75k-100k, 2.5% for AGIs $100k-200k, 4.6% for AGIs over 200k)
Net capital gain/loss in AGI: +$24,558 (reported on 3.6% of returns)
Here:
+$24,558
State:
+$33,127
(% of AGI for various income ranges: 0.2% for AGIs $50k-75k, 0.6% for AGIs $75k-100k, 1.8% for AGIs $100k-200k, 8.6% for AGIs over 200k)
Profit/loss from business: +$6,368 (reported on 11.3% of returns)
Here:
+$6,368
State:
+$12,567
(% of AGI for various income ranges: 7.2% for AGIs below $25k, 1.0% for AGIs $25k-50k, 1.4% for AGIs $50k-75k, 2.6% for AGIs $75k-100k, 2.8% for AGIs $100k-200k)
Taxable individual retirement arrangement distribution: $15,614 (reported on 3.1% of returns)
89119:
$15,614
Nevada:
$20,808
(% of AGI for various income ranges: 0.7% for AGIs below $25k, 0.8% for AGIs $25k-50k, 1.4% for AGIs $50k-75k, 2.1% for AGIs $75k-100k, 6.8% for AGIs $100k-200k)
Total itemized deductions: $25,243 (21% of AGI, reported on 13.1% of returns)
Here:
$25,243
State:
$26,148
Here:
21.1% of AGI
State:
20.0% of AGI
(% of AGI for various income ranges: 3.8% for AGIs below $25k, 6.7% for AGIs $25k-50k, 9.1% for AGIs $50k-75k, 10.6% for AGIs $75k-100k, 12.7% for AGIs $100k-200k, 12.0% for AGIs over 200k)
Charity contributions: $5,084 (reported on 10.2% of returns)
Here:
$5,084
State:
$4,329
(% of AGI for various income ranges: 0.3% for AGIs below $25k, 0.7% for AGIs $25k-50k, 1.0% for AGIs $50k-75k, 1.3% for AGIs $75k-100k, 1.3% for AGIs $100k-200k, 3.1% for AGIs over 200k)
Taxes paid: $4,025 (reported on 12.5% of returns)
89119:
$4,025
State:
$5,116
(% of AGI for various income ranges: 0.5% for AGIs below $25k, 1.1% for AGIs $25k-50k, 1.4% for AGIs $50k-75k, 1.7% for AGIs $75k-100k, 2.1% for AGIs $100k-200k, 1.7% for AGIs over 200k)
Earned income credit: $2,215 (reported on 25.8% of returns)
Here:
$2,215
State:
$2,279
(% of AGI for various income ranges: 6.0% for AGIs below $25k, 1.1% for AGIs $25k-50k)
Percentage of individuals using paid preparers for their 2012 taxes: 59.4%
Here:
59%
State:
55%
(% for various income ranges: 58.4% for AGIs below $25k, 60.9% for AGIs $25k-50k, 57.5% for AGIs $50k-75k, 57.4% for AGIs $75k-100k, 62.3% for AGIs $100k-200k, 91.7% for AGIs over 200k)
Averages for the 2004 tax year for zip code 89119, filed in 2005:
Average Adjusted Gross Income (AGI) in 2004: $40,087 (Individual Income Tax Returns)
Here:
$40,087
State:
$58,367
Salary/wage: $27,934 (reported on 88.3% of returns)
Here:
$27,934
State:
$42,695
(% of AGI for various income ranges: 114.4% for AGIs below $10k, 89.9% for AGIs $10k-25k, 90.1% for AGIs $25k-50k, 82.9% for AGIs $50k-75k, 75.7% for AGIs $75k-100k, 18.2% for AGIs over 100k)
Taxable interest for individuals: $7,229 (reported on 18.8% of returns)
This zip code:
$7,229
Nevada:
$3,867
(% of AGI for various income ranges: 5.0% for AGIs below $10k, 1.0% for AGIs $10k-25k, 0.6% for AGIs $25k-50k, 1.3% for AGIs $50k-75k, 1.4% for AGIs $75k-100k, 7.2% for AGIs over 100k)
Taxable dividends: $5,838 (reported on 8.1% of returns)
Here:
$5,838
State:
$5,770
(% of AGI for various income ranges: 1.6% for AGIs below $10k, 0.5% for AGIs $10k-25k, 0.3% for AGIs $25k-50k, 0.8% for AGIs $50k-75k, 0.7% for AGIs $75k-100k, 2.2% for AGIs over 100k)
Net capital gain/loss: +$97,171 (reported on 7.5% of returns)
Here:
+$97,171
State:
+$50,644
(% of AGI for various income ranges: 0.2% for AGIs below $10k, -0.3% for AGIs $10k-25k, 0.3% for AGIs $25k-50k, 0.8% for AGIs $50k-75k, 2.4% for AGIs $75k-100k, 47.2% for AGIs over 100k)
Profit/loss from business: +$4,849 (reported on 7.9% of returns)
Here:
+$4,849
State:
+$13,618
(% of AGI for various income ranges: 2.5% for AGIs below $10k, 2.1% for AGIs $10k-25k, 1.1% for AGIs $25k-50k, 1.6% for AGIs $50k-75k, 2.8% for AGIs $75k-100k, -0.2% for AGIs over 100k)
IRA payment deduction: $2,755 (reported on 1.2% of returns)
89119:
$2,755
Nevada:
$3,054
(% of AGI for various income ranges: 0.2% for AGIs $10k-25k, 0.1% for AGIs $25k-50k, 0.1% for AGIs $50k-75k, 0.1% for AGIs $75k-100k, 0.0% for AGIs over 100k)
Self-employed pension: $14,489 (reported on 0.2% of returns)
Here:
$14,489
Nevada:
$16,706
(% of AGI for various income ranges: 0.0% for AGIs $10k-25k, 0.2% for AGIs $50k-75k, 0.1% for AGIs over 100k)
Total itemized deductions: $19,695 (19% of AGI, reported on 20.2% of returns)
Here:
$19,695
State:
$22,990
Here:
19.3% of AGI
State:
21.8% of AGI
(% of AGI for various income ranges: 7.9% for AGIs below $10k, 6.3% for AGIs $10k-25k, 10.1% for AGIs $25k-50k, 14.3% for AGIs $50k-75k, 15.2% for AGIs $75k-100k, 9.1% for AGIs over 100k)
Charity contributions deductions: $2,868 (3% of AGI, reported on 16.4% of returns)
Here:
$2,868
State:
$3,443
Here:
2.7% of AGI
State:
3.1% of AGI
(% of AGI for various income ranges: 0.3% for AGIs below $10k, 0.6% for AGIs $10k-25k, 1.1% for AGIs $25k-50k, 1.4% for AGIs $50k-75k, 1.6% for AGIs $75k-100k, 1.4% for AGIs over 100k)
Total tax: $7,986 (reported on 68.5% of returns)
89119:
$7,986
State:
$10,585
(% of AGI for various income ranges: 6.2% for AGIs below $10k, 3.8% for AGIs $10k-25k, 6.6% for AGIs $25k-50k, 9.7% for AGIs $50k-75k, 12.1% for AGIs $75k-100k, 24.5% for AGIs over 100k)
Earned income credit: $1,648 (reported on 21.2% of returns)
Here:
$1,648
State:
$1,676
Percentage of individuals using paid preparers for their 2004 taxes: 61.5%
Here:
61%
State:
60%
(% for various income ranges: 59.8% for AGIs below $10k, 62.5% for AGIs $10k-25k, 60.1% for AGIs $25k-50k, 61.2% for AGIs $50k-75k, 62.6% for AGIs $75k-100k, 74.2% for AGIs over 100k)
Likely homosexual households (counted as self-reported same-sex unmarried-partner households)
Lesbian couples: 0.1% of all households
Gay men: 0.3% of all households
Household received Food Stamps/SNAP in the past 12 months: 5,657 Household did not receive Food Stamps/SNAP in the past 12 months: 17,347
Women who had a birth in the past 12 months: 666 (369 now married, 267 unmarried) Women who did not have a birth in the past 12 months: 13,867 (4,015 now married, 9,914 unmarried)
Housing units in zip code 89119 with a mortgage: 3,217 (254 second mortgage, 208 both second mortgage and home equity loan) Houses without a mortgage: 41
Median monthly owner costs for units with a mortgage: $1,325 Median monthly owner costs for units without a mortgage: $404
Residents with income below the poverty level in 2022:
This zip code:
20.7%
Whole state:
12.5%
Residents with income below 50% of the poverty level in 2022:
This zip code:
9.8%
Whole state:
5.9%
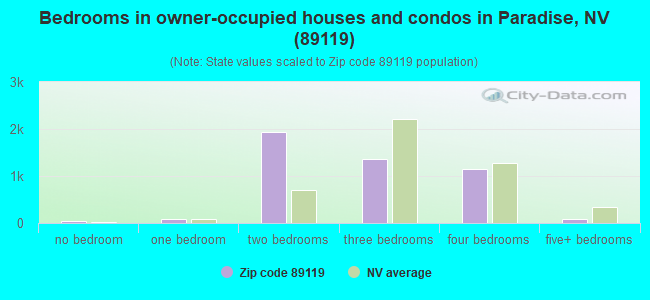
Median number of rooms in houses and condos:
Here:
5.0
State:
6.0
Median number of rooms in apartments:
Here:
3.6
State:
4.2
Notable locations in this zip code not listed on our city pages
Notable locations in zip code 89119: Sundance Plaza (A), University Plaza (B), Tropicana Spencer Square (C), Mission Center (D), Tiffany Square (E), Maryland Square (F), Runnin Rebel Plaza (G), Renaissance Center East (H), Tropicana East Centre (I), Clark County Fire Department Station 19 (J), Clark County Fire Department Station 18 (K), Clark County Fire Department Station 13 (L), Clark County Fire Department Station 11 (M), Central Desert Complex (N), Carol C Harter Classroom Building Complex (O), Cambridge Senior and Youth Center (P), Cambridge Community Resources Building (Q), Bennett Professional Development Center (R), Artemus W Ham Concert Hall (S), Archie C Grant Hall (T). Display/hide their locations on the map
Shopping Centers: Park 2000 Shopping Center (1), College Town Shopping Center (2), Camelot Shopping Center (3), College Town Number Two Shopping Center (4), University Gardens Shopping Center (5), Campus Village Shopping Center (6), Maryland Crossing Shopping Center (7), Mission Center Shopping Center (8). Display/hide their locations on the map
Churches in zip code 89119 include: Self-Realization Fellowship Church (A), University United Methodist Church (B), Saint Gabriel Byzantine Catholic Church (C), Tropicana Christian Fellowship Church (D), Islamic Information Center (E), Iglesia-Cristiana-Monte-Sinai (F), Harvest Church of South Las Vegas (G), First Church of Religious Science (H), Family Church of God (I). Display/hide their locations on the map
Parks in zip code 89119 include: Bill Wildcat Morris Rebel Park (1), Earl E Wilson Baseball Stadium (2), Eller Media Softball Stadium (3), Peter Johann Soccer Field (4), Myron Partridge Track Stadium (5), Paradise Vista Park (6). Display/hide their locations on the map
Tourist attractions (not listed on the city page) : Liberace Museum & Foundation (1775 East Tropicana Avenue), Attractions at Event Center Las Vegas (Amusement & Theme Parks; 121 E. Sunset Road), Dionne's World Class Travel (4220 South Maryland Parkway Suite 210), Ylv Host Inc (5030 Paradise Road), U TN Las Vegas (1050 East Flamingo Road), Travnet Llc (6380 South Eastern Avenue), At Las Vegas (5050 Tamarus Suite 222), Unity Celebration (4921 Wilbur Street), Teddy Bear Vacation (2235 East Flamingo Road Suite 406).
3,452 married couples with children.
4,528 single-parent households (1,016 men, 3,512 women).
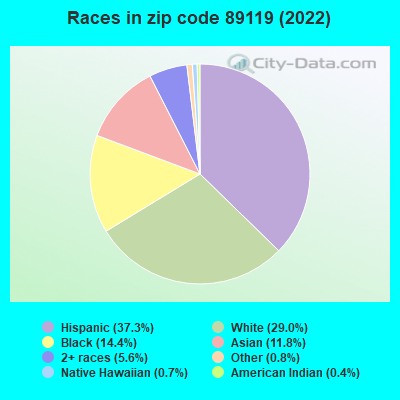
55.8% of residents of 89119 zip code speak English at home.
30.5% of residents speak Spanish at home (51% very well, 19% well, 19% not well, 11% not at all).
3.8% of residents speak other Indo-European language at home (66% very well, 18% well, 7% not well, 8% not at all).
8.7% of residents speak Asian or Pacific Island language at home (59% very well, 31% well, 10% not well).
0.9% of residents speak other language at home (52% very well, 33% well, 15% not well).
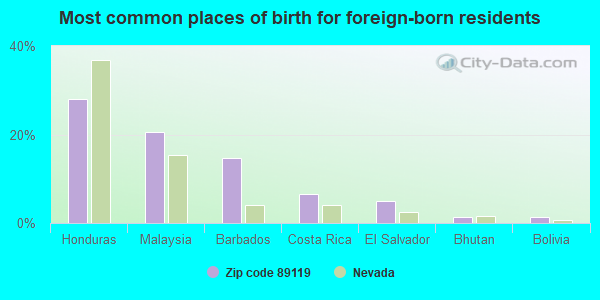
Foreign born population: 16,113 (30.9%) (40.6% of them are naturalized citizens)
Major facilities with environmental interests located in this zip code:
TRANSPORTATION SECURITY ADMINISTRATION (375 E WARM SPRINGS RD STE 200 in LAS VEGAS, NV)
(Resource Conservation and Recovery Act (tracking hazardous waste)) HAZARDOUS WASTE BIENNIAL REPORTER (Resource Conservation and Recovery Act (tracking hazardous waste)) - ICIS-, ENFORCEMENT/COMPLIANCE ACTIVITY Small Quantity Generators, between 100 kg and 1000 kg of hazardous waste/month (Resource Conservation and Recovery Act (tracking hazardous waste)) - ICIS-, ENFORCEMENT/COMPLIANCE ACTIVITY Conditionally Exempt Small Quantity Generators, less than 100 kg/month of hazardous waste (Resource Conservation and Recovery Act (tracking hazardous waste)) Business NAICS classification: OTHER AIRPORT OPERATIONS. Organizations: BOMBARDIER TRANSPORTATION (CONTACT/OPERATOR)
, T S A (CONTACT/OPERATOR)
, MC CARRAN INTERNATIONAL AIRPORT (CONTACT/OPERATOR)
, ABB DAIMLER BENZ TRANSPORTATION (CONTACT/OWNER)
, BOMBARDIER TRANSPORTATION (CONTACT/OWNER)
, CLARK CO BOARD OF COUNTY COMMISSIONERS (CONTACT/OWNER)
, CLARK COUNTY (CONTACT/OWNER)
Alternative names: ABB DAIMLER BENZ TRANSPORTATION, MCCARRAN AIRPORT MONITORING STA SITE 320031007, MCCARRAN INTERNATIONAL AIRPORT, SITE ID 320031007, T S A AT MCCARRAN INTERNATIONAL AIRPORT
LAS LABORATORIES INC (975 KELLY JOHNSON DRIVE in LAS VEGAS, NV)
STATE MASTER (New Jersey environmental info) - NJEMS-NV001, LABORATORY CERTIFICATION HAZARDOUS WASTE BIENNIAL REPORTER (Resource Conservation and Recovery Act (tracking hazardous waste)) (Resource Conservation and Recovery Act (tracking hazardous waste)) Business NAICS classification: AIRCRAFT MANUFACTURING.
MERILLAT INDUSTRIES (6405 ENSWORTH STREET in LAS VEGAS, NV)
STATE MASTER (NV-FP) - STORMWATER-ISW-113, NPDES STORMWATER PERMIT Conditionally Exempt Small Quantity Generators, less than 100 kg/month of hazardous waste (Resource Conservation and Recovery Act (tracking hazardous waste)) - notification Alternative names: MERRILLAT INDUSTRIES
GENE WARD ELEMENTARY SCHOOL (1555 EAST HACIENDA in LAS VEGAS, NV)
(Geographic Names Information System) (National Center for Education Statistics) - STATE ID-02-258 Organizations: CLARK CO SCH DIST (SCHOOL DISTRICT)
Alternative names: WARD, GENE ELEM
LEWIS E ROWE ELEMENTARY SCHOOL (4338 SOUTH BRUCE STREET in LAS VEGAS, NV)
(Geographic Names Information System) (National Center for Education Statistics) - STATE ID-02-221 Organizations: CLARK CO SCH DIST (SCHOOL DISTRICT)
Alternative names: ROWE, LEWIS ELEM
JACK DAILEY ELEMENTARY SCHOOL (2001 E. RENO AVE. in LAS VEGAS, NV)
(Geographic Names Information System) (National Center for Education Statistics) - STATE ID-02-130 Organizations: CLARK CO SCH DIST (SCHOOL DISTRICT)
Alternative names: DAILEY, JACK ELEM
MCC-UNIFLEX LLC (1151 GRIER DRIVE SUITE M in LAS VEGAS, NV)
CRITERIA AND HAZARDOUS AIR POLLUTANT INVENTORY (Inventory of air pollution sources) (Resource Conservation and Recovery Act (tracking hazardous waste)) TRI REPORTER (Tracking of toxic chemicals releasing facilities) Business SIC classification: COMMERCIAL PRINTING, GRAVURE Business NAICS classification: COMMERCIAL GRAVURE PRINTING.; COMMERCIAL GRAVURE PRINTING. Alternative names: M C C - UNIFLEX CORP, MCC-UNIFLEX L.L.C., UNIPLEX
N B INDUSTRIES (840 PILOT RD in LAS VEGAS, NV)
(Resource Conservation and Recovery Act (tracking hazardous waste)) Business NAICS classification: SHEET METAL WORK MANUFACTURING. Organizations: STANDARD REGISTER (CONTACT/OWNER)
, L BANN PRESIDENT (CONTACT/OWNER)
Alternative names: STAN FAST
CHEVRON NO 97537 (5722 S EASTERN AVE in LAS VEGAS, NV)
National Pollutant Discharge Elimination System NON-MAJOR (Tracking pollutant discharge elimination systems) - permit (Resource Conservation and Recovery Act (tracking hazardous waste)) Business SIC classification: GASOLINE SERVICE STATIONS Organizations: CHEVRON TEXACO PRODUCTS CO (CONTACT/OWNER)
Alternative names: CHEVRON STATION #9-7537, HAYES FOODMART
KALCO LIGHTING INCORPORATED (6355 SOUTH WINDY STREET #3 in LAS VEGAS, NV)
CRITERIA AND HAZARDOUS AIR POLLUTANT INVENTORY (Inventory of air pollution sources) HAZARDOUS WASTE BIENNIAL REPORTER (Resource Conservation and Recovery Act (tracking hazardous waste)) Small Quantity Generators, between 100 kg and 1000 kg of hazardous waste/month (Resource Conservation and Recovery Act (tracking hazardous waste)) - notification TRI REPORTER (Tracking of toxic chemicals releasing facilities) Business SIC classification: METAL HOUSEHOLD FURNITURE; RESIDENTIAL ELECTRIC LIGHTING FIXTURES; COMMERCIAL, INDUSTRIAL, AND INSTITUTIONAL ELECTRIC LIGHTING FIXTURES Business NAICS classification: RESIDENTIAL ELECTRIC LIGHTING FIXTURE MANUFACTURING. Organizations: HARRY KALLICK (CONTACT/OWNER)
, SIMKAR CORP (CONTACT/OWNER)
UNITED BROTHERHOOD OF CARPINTERS (6801 PLACID STREET in LAS VEGAS, NV)
(Integrated Compliance Information System) - ICIS-09-2004-0435, FORMAL ENFORCEMENT ACTION
AL PHILLIPS THE CLEANER (2201 E TROPICANA in LAS VEGAS, NV)
HAZARDOUS WASTE BIENNIAL REPORTER (Resource Conservation and Recovery Act (tracking hazardous waste)) Large Quantity Generators, more that 1000 kg of hazardous waste/month (Resource Conservation and Recovery Act (tracking hazardous waste)) Organizations: AL PHILLIPS THE CLEANER INC (CONTACT/OPERATOR)
INKWARE L L C (2020 PAMA LN in LAS VEGAS, NV)
(Resource Conservation and Recovery Act (tracking hazardous waste)) Business NAICS classification: ALL OTHER MISCELLANEOUS CHEMICAL PRODUCT AND PREPARATION MANUFACTURING. Organizations: INKWARE LLC (CONTACT/OPERATOR)
, BAKER SIMPSON L L C (CONTACT/OWNER)
Housing units lacking complete plumbing facilities: 0.8% Housing units lacking complete kitchen facilities: 2.0%
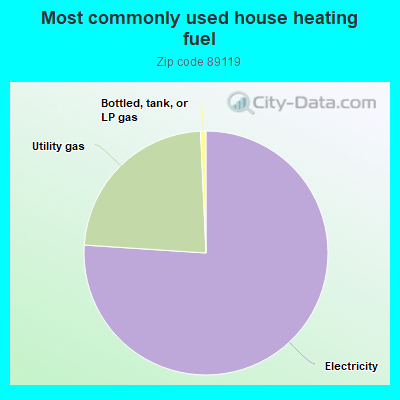
75.2%Electricity
23.0%Utility gas
0.7%Bottled, tank, or LP gas
Population in 1990: 38,719. Population change in the 1990s: +9,974 (+25.8%).
Place of birth for U.S.-born residents:
This state: 9,632
Northeast: 3,135
Midwest: 4,370
South: 3,788
West: 13,544
31% of the 89119 zip code residents lived in the same house 5 years ago. Out of people who lived in different houses, 49% lived in this county. Out of people who lived in different counties, 50% lived in Nevada.
81% of the 89119 zip code residents lived in the same house 1 year ago. Out of people who lived in different houses, 61% moved from this county. Out of people who lived in different houses, 1% moved from different county within same state. Out of people who lived in different houses, 29% moved from different state. Out of people who lived in different houses, 6% moved from abroad.
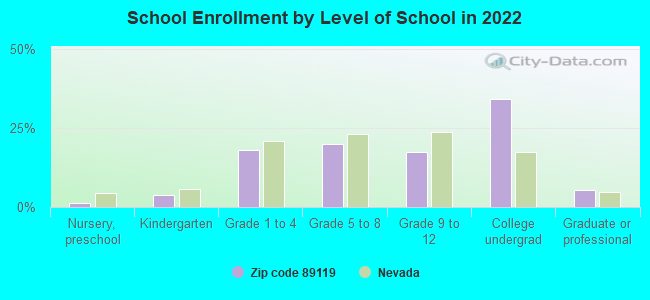
Private vs. public school enrollment:
Students in private schools in grades 1 to 8 (elementary and middle school): 207
Here:
4.9%
Nevada:
12.9%
Students in private schools in grades 9 to 12 (high school): 108
Here:
5.4%
Nevada:
6.9%
Students in private undergraduate colleges: 395
Here:
9.9%
Nevada:
16.0%
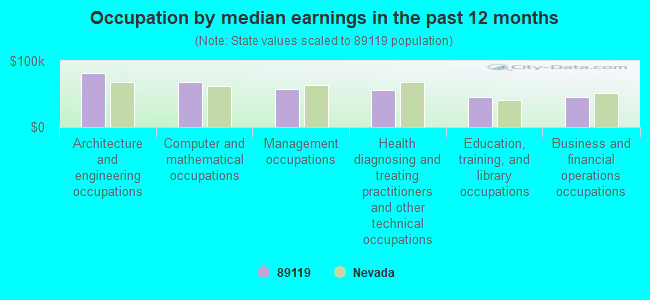
Occupation by median earnings in the past 12 months ($)
81,701Architecture and engineering occupations
67,631Computer and mathematical occupations
57,602Management occupations
55,466Health diagnosing and treating practitioners and other technical occupations
45,918Education, training, and library occupations
44,983Business and financial operations occupations
Companies with biggest federal contracts located in this zip code (LAS VEGAS, NV):
RAYTHEON TECHNICAL SERVICES CO (901A GRIER AVENUE) : $254,758,345 in 240 contractsfrom 2001 to 2006
Contracts for Maintenance, Repair and Rebuilding of Equipment -- Training Aids and Devices, Program Management/Support Services, Maintenance, Repair and Rebuilding of Equipment -- Automatic Data Processing Equipment (Including Firmware), Software, Supplies and Support Equipment, Operation of Government-Owned Facilities -- Electronic and Communications Facilities, and moreby Navy, Air Force, Army Signed by year:2000: $0; 2001: $5,934,208; 2002: $18,467,887; 2003: $102,001,099; 2004: $127,108,766; 2005: $1,019,689; 2006: $226,696.
Biggest contracts:
$9,005,411 with Navy for Maintenance, Repair and Rebuilding of Equipment -- Training Aids and Devices. Taking place in CA. Signed on 2004-01-20. Completion date: 2004-10-31.
$8,939,954, same as above.Signed on 2003-06-13. Completion date: 2003-11-30.
$8,486,744, same as above.Signed on 2004-07-13. Completion date: 2004-10-31.
$8,255,639, same as above.Signed on 2004-02-26. Completion date: 2004-10-31.
CO-ENERGY GROUP, (INC) (1050 E FLAMINGO RD; small business) : $26,734,684 in 74 contractsfrom 1999 to 2006
Contracts for Other Utilities, Maintenance, Repair and Rebuilding of Equipment -- Water Purification and Sewage Treatment Equipment, Maintenance, Repair or Alteration of Real Property -- Family Housing Facilities by Army Signed by year:2000: $5,150,785; 2001: $2,818,614; 2002: $4,580,990; 2003: $4,292,778; 2004: $1,077,774; 2005: $4,688,243; 2006: $3,065,500.
Biggest contracts:
$2,930,000 with Army for Other Utilities. Taking place in LA. Signed on 2005-01-20. Completion date: 2004-07-31.
$1,525,000, same as above.Signed on 2002-04-12. Completion date: 2002-12-31.
$1,347,000, same as above.Signed on 2006-04-12. Completion date: 2005-04-08.
$1,200,000, same as above.Signed on 2000-02-24. Completion date: 2000-12-31.
EG&G TECHNICAL SERVICES, INC (811 GRIER DRIVE) : $24,842,084 in 39 contractsfrom 2002 to 2006
Contracts for Operation of Government-Owned Facilities -- Radar and Navigational Facilities, Other Transportation Travel and Relocation Services, Other Special Studies and Analyses, Land Mines by Air Force, Army Signed by year:2000: $0; 2001: $0; 2002: $5,716,181; 2003: $13,013,912; 2004: $6,073,801; 2005: $0; 2006: $38,190.
Biggest contracts:
$2,920,945 with Air Force for Operation of Government-Owned Facilities -- Radar and Navigational Facilities. Taking place in NM. Signed on 2003-10-28. Completion date: 2004-09-30.
$2,919,397 with Air Force for Other Transportation Travel and Relocation Services. Taking place in TX. Signed on 2003-10-01. Completion date: 2004-09-30.
$1,774,000 with Air Force for Operation of Government-Owned Facilities -- Radar and Navigational Facilities. Taking place in NM. Signed on 2003-04-25. Completion date: 2004-09-30.
$1,773,635, same as above.Signed on 2002-11-25. Completion date: 2004-09-30.
SIGNATURE FLIGHT SUPPORT CORPO (6005 LAS VEGAS BLVD S STE) : $17,185,830 in 2 contractsfrom 2000 to 2006
$15,107,286 with Defense Logistics Agency for Liquid Propellants and Fuels, Petroleum Base. Signed on 2006-05-08. Completion date: 2010-03-31.
$2,078,544, same as above.Signed on 2000-02-28. Completion date: 2003-03-31.
ADT CONSTRUCTION GROUP, INC (1335 E SUNSET ROAD; small business) : $7,288,181 in 17 contractsfrom 2002 to 2005
Contracts for Maintenance, Repair or Alteration of Real Property -- Hospitals and Infirmaries, Construction of Structures and Facilities -- Miscellaneous Buildings, Construction of Structures and Facilities -- Other Administrative Facilities and Service Buildings, Construction of Structures and Facilities -- EPG Facilities - Other, Including Transmission, and moreby Department of Veterans Affairs, Army, Air Force, ENERGY, Department of, and others Signed by year:2000: $0; 2001: $0; 2002: $867,546; 2003: $6,104,940; 2004: $249,909; 2005: $65,786; 2006: $0.
Biggest contracts:
$3,371,654 with Department of Veterans Affairs for Maintenance, Repair or Alteration of Real Property -- Hospitals and Infirmaries. Signed on 2003-09-15. Completion date: 2005-06-15.
$2,691,475 with Army for Construction of Structures and Facilities -- Miscellaneous Buildings. Signed on 2003-06-17. Completion date: 2003-09-22.
$641,500 with Air Force for Construction of Structures and Facilities -- Other Administrative Facilities and Service Buildings. Signed on 2002-09-27. Completion date: 2003-05-08.
$150,061 with ENERGY, Department of for Construction of Structures and Facilities -- EPG Facilities - Other, Including Transmission. Signed on 2004-04-16. Completion date: 2004-11-15.
ASTEROID CORPORATION (2200 E PATRICK LN STE 14; small business) : $1,140,379 in 12 contractsfrom 1999 to 2003
Contracts for Technical Representation Services -- Miscellaneous by Navy Signed by year:2000: $363,920; 2001: $256,404; 2002: $147,000; 2003: $327,760; 2004: $0; 2005: $0; 2006: $0.
Biggest contracts:
$327,760 with Navy for Technical Representation Services -- Miscellaneous. Signed on 2003-05-01. Completion date: 2004-04-30.
$256,404, same as above.Signed on 2001-05-01. Completion date: 2002-04-30.
$147,000, same as above.Signed on 2002-05-01. Completion date: 2003-04-30.
$95,665 with Navy for Technical Representation Services -- Miscellaneous. Taking place in HI. Signed on 2000-08-11. Completion date: 2000-09-30.
BONNCORPORATION (4045 SOUTH SPENCER STREET; small business) : $835,373 in 7 contractsfrom 2001 to 2004
Contracts for Engineering and Technical Services, Industrial Hygienics, Airframe Structural Components, Other Defense -- Basic Research (R&D) by Navy, Air Force Signed by year:2000: $0; 2001: $123,968; 2002: $249,480; 2003: $259,872; 2004: $202,053; 2005: $0; 2006: $0.
Biggest contracts:
$259,872 with Navy for Engineering and Technical Services. Taking place in CA. Signed on 2003-05-01. Completion date: 2004-02-11.
$202,053 with Navy for Industrial Hygienics. Signed on 2004-06-16. Completion date: 2004-10-16.
$150,000 with Navy for Engineering and Technical Services. Signed on 2002-07-30. Completion date: 2002-12-31.
$123,968 with Air Force for Airframe Structural Components. Signed on 2001-04-05. Completion date: 2001-04-30.
ALL-STATE RENT A CAR INC (5175 RENTCAR RD) : $580,600 in 14 contractsfrom 2000 to 2006
Contracts for Services -- Basic Research (R&D), Lease or Rental of Equipment -- Ground Effect Vehicles, Motor Vehicles, Trailers, and Cycles, Lease or Rental of Equipment -- Weapons, Motor Passenger Services by Army Signed by year:2000: $109,982; 2001: $0; 2002: $66,037; 2003: $177,581; 2004: -$10,000; 2005: $132,000; 2006: $105,000.
Biggest contracts:
$177,581 with Army for Services -- Basic Research (R&D). Signed on 2003-12-17. Completion date: 2008-01-31.
$132,000, same as above.Signed on 2005-03-17. Completion date: 2006-01-31.
$109,982 with Army for Lease or Rental of Equipment -- Ground Effect Vehicles, Motor Vehicles, Trailers, and Cycles. Signed on 2000-07-12. Completion date: 2001-07-31.
$73,500 with Army for Services -- Basic Research (R&D). Signed on 2006-05-22. Completion date: 2008-01-31.
VIVA LAS VEGAS LLC (5100 PARADISE ROAD) : $221,199 in 5 contractsfrom 1999 to 2000
Contracts for Lodging - Hotel/Motel by Air Force Signed by year:2000: $113,348; 2001: $0; 2002: $0; 2003: $0; 2004: $0; 2005: $0; 2006: $0.
Biggest contracts:
$68,875 with Air Force for Lodging - Hotel/Motel. Signed on 1999-10-19. Completion date: 1999-11-06.
$48,620, same as above.Signed on 2000-10-20. Completion date: 2000-11-01.
$38,976, same as above.Signed on 1999-10-19. Completion date: 1999-11-06.
$32,364, same as above.Signed on 2000-01-19. Completion date: 2000-02-05.
DOCUMENTS ARCHAEOLOGY, INCORPO (1555 EAST FLAMINGO ROAD; small business) : $115,126 in 2 contractsfrom 2000 to 2001
$73,126 with U.S. Army Corps of Engineers - civil program financing only for Historical Studies. Signed on 2001-08-09. Completion date: 2002-06-29.
$42,000 with National Park Service for Policy Review/Development Services. Taking place in MS. Signed on 2000-08-15. Completion date: 2001-08-15.
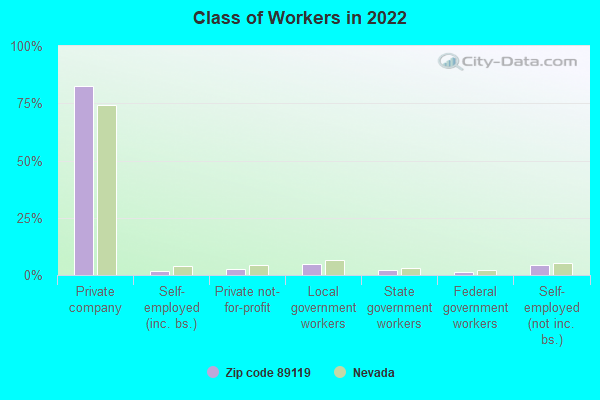
Top industries in this zip code by the number of employees in 2005:
Administrative and Support and Waste Management and Remediation Services: Temporary Help Services (500-999 employees: 2 establishments, 250-499 employees: 1 establishment, 100-249 employees: 5 establishments, 50-99 employees: 3 establishments, 20-49 employees: 5 establishments, 10-19 employees: 3 establishments, 5-9 employees: 1 establishment, 1-4 employees: 6 establishments)
Accommodation and Food Services: Casino Hotels (over 1000: 2)
Administrative and Support and Waste Management and Remediation Services: Convention and Trade Show Organizers (over 1000: 1, 250-499: 1, 100-249: 2, 20-49: 3, 10-19: 2, 5-9: 2, 1-4: 1)
Health Care and Social Assistance: General Medical and Surgical Hospitals (over 1000: 1, 250-499: 1)
Real Estate and Rental and Leasing: Residential Property Managers (500-999: 1, 250-499: 1, 100-249: 2, 50-99: 2, 20-49: 3, 10-19: 4, 5-9: 5, 1-4: 10)
Administrative and Support and Waste Management and Remediation Services: Office Administrative Services (over 1000: 1, 50-99: 2, 20-49: 3, 10-19: 1, 1-4: 13)
Management of Companies and Enterprises: Corporate, Subsidiary, and Regional Managing Offices (500-999: 1, 100-249: 3, 50-99: 1, 20-49: 6, 10-19: 4, 5-9: 2, 1-4: 10)
People in group quarters in 2010:
1,211 people in college/university student housing
43 people in nursing facilities/skilled-nursing facilities
13 people in group homes intended for adults
11 people in other noninstitutional facilities
People in group quarters in 2000:
1,042 people in college dormitories (includes college quarters off campus)
53 people in other noninstitutional group quarters
22 people in nursing homes
12 people in homes for the mentally ill
9 people in other nonhousehold living situations
8 people in hospitals/wards and hospices for chronically ill
8 people in other hospitals or wards for chronically ill
Fatal accident statistics in 2014:
Fatal accident count: 2
Vehicles involved in fatal accidents: 3
Fatal accidents caused by drunken drivers: 0
Fatalities: 2
Persons involved in fatal accidents: 3
Pedestrians involved in fatal accidents: 1
Fatal accident statistics in 2013:
Fatal accident count: 9
Vehicles involved in fatal accidents: 12
Fatal accidents caused by drunken drivers: 4
Fatalities: 9
Persons involved in fatal accidents: 13
Pedestrians involved in fatal accidents: 5
Home Mortgage Disclosure Act Aggregated Statistics For Year 2009 (Based on 14 full and 6 partial tracts)
A) FHA, FSA/RHS & VA Home Purchase Loans
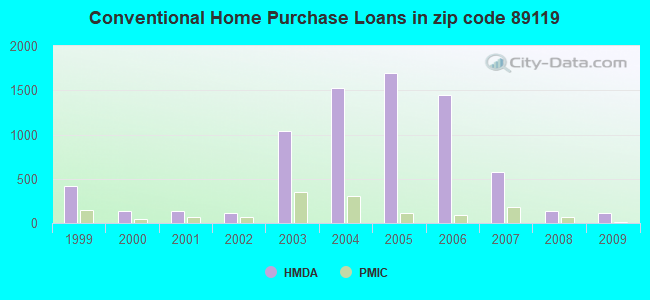
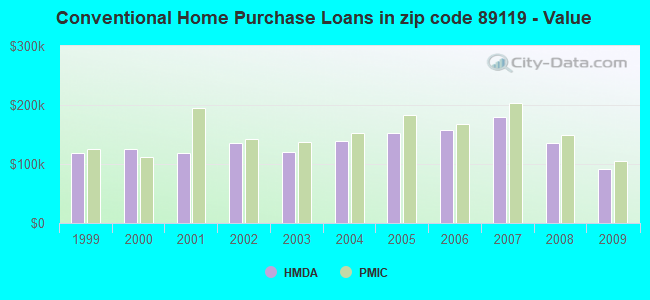
B) Conventional Home Purchase Loans
C) Refinancings
D) Home Improvement Loans
E) Loans on Dwellings For 5+ Families
F) Non-occupant Loans on < 5 Family Dwellings (A B C & D)
G) Loans On Manufactured Home Dwelling (A B C & D)
Number
Average Value
Number
Average Value
Number
Average Value
Number
Average Value
Number
Average Value
Number
Average Value
Number
Average Value
LOANS ORIGINATED
247
$124,331
116
$90,881
162
$143,889
1
$19,000
2
$832,385
66
$90,296
0
$0
APPLICATIONS APPROVED, NOT ACCEPTED
22
$129,174
6
$122,122
23
$128,607
5
$16,752
0
$0
5
$95,558
0
$0
APPLICATIONS DENIED
57
$112,299
44
$117,161
128
$152,505
26
$39,700
0
$0
55
$91,907
1
$134,000
APPLICATIONS WITHDRAWN
38
$125,705
29
$124,827
92
$142,627
14
$85,018
0
$0
28
$164,634
2
$284,145
FILES CLOSED FOR INCOMPLETENESS
6
$114,518
3
$165,167
28
$147,346
0
$0
0
$0
4
$111,165
0
$0
Aggregated Statistics For Year 2008 (Based on 14 full and 6 partial tracts)
A) FHA, FSA/RHS & VA Home Purchase Loans
B) Conventional Home Purchase Loans
C) Refinancings
D) Home Improvement Loans
E) Loans on Dwellings For 5+ Families
F) Non-occupant Loans on < 5 Family Dwellings (A B C & D)
G) Loans On Manufactured Home Dwelling (A B C & D)
Number
Average Value
Number
Average Value
Number
Average Value
Number
Average Value
Number
Average Value
Number
Average Value
Number
Average Value
LOANS ORIGINATED
122
$181,128
136
$136,335
240
$163,833
36
$36,677
9
$5,207,564
127
$130,140
0
$0
APPLICATIONS APPROVED, NOT ACCEPTED
19
$185,823
32
$176,619
57
$184,317
12
$24,556
0
$0
21
$147,410
0
$0
APPLICATIONS DENIED
33
$194,492
94
$147,196
373
$189,454
61
$50,459
0
$0
101
$130,926
2
$47,660
APPLICATIONS WITHDRAWN
39
$197,895
33
$224,755
124
$167,202
13
$97,779
1
$4,000,000
46
$154,802
2
$198,820
FILES CLOSED FOR INCOMPLETENESS
5
$178,220
20
$186,854
29
$221,638
4
$65,680
0
$0
15
$176,584
0
$0
Aggregated Statistics For Year 2007 (Based on 14 full and 6 partial tracts)
A) FHA, FSA/RHS & VA Home Purchase Loans
B) Conventional Home Purchase Loans
C) Refinancings
D) Home Improvement Loans
E) Loans on Dwellings For 5+ Families
F) Non-occupant Loans on < 5 Family Dwellings (A B C & D)
G) Loans On Manufactured Home Dwelling (A B C & D)
Number
Average Value
Number
Average Value
Number
Average Value
Number
Average Value
Number
Average Value
Number
Average Value
Number
Average Value
LOANS ORIGINATED
20
$247,396
579
$179,454
916
$179,860
65
$116,353
18
$4,150,133
386
$163,260
0
$0
APPLICATIONS APPROVED, NOT ACCEPTED
2
$244,255
127
$163,889
177
$180,862
25
$94,347
2
$212,400
90
$171,975
0
$0
APPLICATIONS DENIED
10
$235,905
290
$190,395
800
$246,951
88
$98,920
7
$747,094
217
$193,945
9
$115,599
APPLICATIONS WITHDRAWN
4
$216,420
171
$216,238
363
$205,284
30
$86,108
4
$171,710
92
$191,324
0
$0
FILES CLOSED FOR INCOMPLETENESS
0
$0
31
$194,896
98
$214,422
6
$169,965
0
$0
30
$148,278
0
$0
Aggregated Statistics For Year 2006 (Based on 14 full and 6 partial tracts)
A) FHA, FSA/RHS & VA Home Purchase Loans
B) Conventional Home Purchase Loans
C) Refinancings
D) Home Improvement Loans
E) Loans on Dwellings For 5+ Families
F) Non-occupant Loans on < 5 Family Dwellings (A B C & D)
G) Loans On Manufactured Home Dwelling (A B C & D)
Number
Average Value
Number
Average Value
Number
Average Value
Number
Average Value
Number
Average Value
Number
Average Value
Number
Average Value
LOANS ORIGINATED
12
$223,197
1,450
$157,052
1,383
$177,881
126
$116,038
17
$7,207,154
732
$156,720
4
$65,728
APPLICATIONS APPROVED, NOT ACCEPTED
1
$181,000
308
$145,349
238
$183,918
36
$58,219
0
$0
124
$154,537
0
$0
APPLICATIONS DENIED
1
$197,000
630
$182,247
780
$196,195
133
$96,526
2
$245,440
321
$162,856
9
$62,507
APPLICATIONS WITHDRAWN
0
$0
386
$150,982
611
$192,666
25
$158,936
3
$1,464,000
159
$164,619
4
$34,722
FILES CLOSED FOR INCOMPLETENESS
0
$0
72
$171,567
126
$210,947
2
$99,880
0
$0
31
$175,441
0
$0
Aggregated Statistics For Year 2005 (Based on 14 full and 6 partial tracts)
A) FHA, FSA/RHS & VA Home Purchase Loans
B) Conventional Home Purchase Loans
C) Refinancings
D) Home Improvement Loans
E) Loans on Dwellings For 5+ Families
F) Non-occupant Loans on < 5 Family Dwellings (A B C & D)
G) Loans On Manufactured Home Dwelling (A B C & D)
Number
Average Value
Number
Average Value
Number
Average Value
Number
Average Value
Number
Average Value
Number
Average Value
Number
Average Value
LOANS ORIGINATED
28
$178,401
1,695
$152,663
1,720
$169,836
160
$107,848
27
$4,570,657
814
$155,227
2
$89,500
APPLICATIONS APPROVED, NOT ACCEPTED
3
$185,470
277
$161,614
259
$174,440
26
$77,530
0
$0
128
$179,091
2
$193,705
APPLICATIONS DENIED
9
$172,909
637
$169,501
916
$177,676
164
$91,040
5
$634,718
292
$189,318
12
$139,892
APPLICATIONS WITHDRAWN
11
$175,526
406
$190,075
723
$168,355
91
$172,156
1
$1,500,000
143
$195,687
5
$46,716
FILES CLOSED FOR INCOMPLETENESS
1
$127,360
99
$162,123
156
$192,228
2
$52,800
0
$0
34
$170,486
0
$0
Aggregated Statistics For Year 2004 (Based on 14 full and 6 partial tracts)
A) FHA, FSA/RHS & VA Home Purchase Loans
B) Conventional Home Purchase Loans
C) Refinancings
D) Home Improvement Loans
E) Loans on Dwellings For 5+ Families
F) Non-occupant Loans on < 5 Family Dwellings (A B C & D)
G) Loans On Manufactured Home Dwelling (A B C & D)
Number
Average Value
Number
Average Value
Number
Average Value
Number
Average Value
Number
Average Value
Number
Average Value
Number
Average Value
LOANS ORIGINATED
57
$147,972
1,529
$139,224
1,622
$146,141
122
$97,536
37
$2,479,920
706
$133,123
2
$99,290
APPLICATIONS APPROVED, NOT ACCEPTED
8
$132,245
283
$150,037
341
$140,301
23
$100,347
6
$2,464,993
126
$151,569
5
$43,656
APPLICATIONS DENIED
20
$216,090
498
$134,687
845
$134,572
167
$62,491
4
$563,568
245
$125,611
11
$72,345
APPLICATIONS WITHDRAWN
12
$126,973
236
$141,540
554
$138,711
37
$76,216
0
$0
107
$137,196
2
$38,050
FILES CLOSED FOR INCOMPLETENESS
0
$0
84
$137,742
122
$148,098
12
$56,558
3
$1,625,977
20
$157,232
0
$0
Aggregated Statistics For Year 2003 (Based on 14 full and 6 partial tracts)
A) FHA, FSA/RHS & VA Home Purchase Loans
B) Conventional Home Purchase Loans
C) Refinancings
D) Home Improvement Loans
E) Loans on Dwellings For 5+ Families
F) Non-occupant Loans on < 5 Family Dwellings (A B C & D)
Number
Average Value
Number
Average Value
Number
Average Value
Number
Average Value
Number
Average Value
Number
Average Value
LOANS ORIGINATED
160
$126,293
1,035
$119,895
2,101
$111,458
56
$30,467
26
$2,046,455
559
$118,239
APPLICATIONS APPROVED, NOT ACCEPTED
8
$125,691
228
$116,678
335
$115,878
12
$78,472
0
$0
92
$114,843
APPLICATIONS DENIED
35
$141,326
388
$130,512
894
$119,469
118
$25,103
10
$3,048,175
145
$116,635
APPLICATIONS WITHDRAWN
35
$131,393
174
$127,571
589
$115,812
16
$41,881
11
$4,395,314
81
$114,049
FILES CLOSED FOR INCOMPLETENESS
8
$123,260
37
$100,722
115
$118,031
2
$23,030
0
$0
29
$104,238
Aggregated Statistics For Year 2002 (Based on 2 full and 2 partial tracts)
A) FHA, FSA/RHS & VA Home Purchase Loans
B) Conventional Home Purchase Loans
C) Refinancings
D) Home Improvement Loans
E) Loans on Dwellings For 5+ Families
F) Non-occupant Loans on < 5 Family Dwellings (A B C & D)
Number
Average Value
Number
Average Value
Number
Average Value
Number
Average Value
Number
Average Value
Number
Average Value
LOANS ORIGINATED
67
$126,161
112
$136,292
241
$119,780
10
$26,575
2
$7,559,425
78
$139,573
APPLICATIONS APPROVED, NOT ACCEPTED
6
$125,883
72
$133,259
43
$125,358
1
$69,890
2
$156,965
12
$122,168
APPLICATIONS DENIED
20
$145,676
84
$111,823
148
$111,275
23
$11,027
0
$0
40
$128,844
APPLICATIONS WITHDRAWN
11
$125,526
46
$166,853
103
$112,802
4
$6,182
0
$0
18
$105,981
FILES CLOSED FOR INCOMPLETENESS
3
$91,843
13
$122,024
20
$113,264
0
$0
0
$0
8
$134,371
Aggregated Statistics For Year 2001 (Based on 2 full and 2 partial tracts)
A) FHA, FSA/RHS & VA Home Purchase Loans
B) Conventional Home Purchase Loans
C) Refinancings
D) Home Improvement Loans
F) Non-occupant Loans on < 5 Family Dwellings (A B C & D)
Number
Average Value
Number
Average Value
Number
Average Value
Number
Average Value
Number
Average Value
LOANS ORIGINATED
31
$143,222
137
$118,044
177
$113,228
26
$29,062
67
$115,200
APPLICATIONS APPROVED, NOT ACCEPTED
9
$99,941
41
$117,036
67
$98,673
6
$20,502
13
$86,535
APPLICATIONS DENIED
27
$117,079
119
$92,423
161
$85,738
49
$17,818
34
$113,237
APPLICATIONS WITHDRAWN
17
$126,915
45
$114,648
118
$110,396
15
$20,245
23
$96,619
FILES CLOSED FOR INCOMPLETENESS
10
$89,422
25
$152,838
43
$111,802
2
$40,770
7
$93,817
Aggregated Statistics For Year 2000 (Based on 2 full and 2 partial tracts)
A) FHA, FSA/RHS & VA Home Purchase Loans
B) Conventional Home Purchase Loans
C) Refinancings
D) Home Improvement Loans
E) Loans on Dwellings For 5+ Families
F) Non-occupant Loans on < 5 Family Dwellings (A B C & D)
Number
Average Value
Number
Average Value
Number
Average Value
Number
Average Value
Number
Average Value
Number
Average Value
LOANS ORIGINATED
52
$117,983
130
$124,763
64
$87,159
16
$19,327
0
$0
32
$86,098
APPLICATIONS APPROVED, NOT ACCEPTED
8
$114,394
58
$94,499
30
$93,218
13
$24,932
0
$0
13
$81,403
APPLICATIONS DENIED
20
$129,956
103
$113,021
107
$71,039
66
$22,350
4
$480,408
26
$90,833
APPLICATIONS WITHDRAWN
6
$151,382
47
$100,106
35
$96,126
6
$35,627
0
$0
1
$90,860
FILES CLOSED FOR INCOMPLETENESS
4
$129,378
21
$154,710
17
$101,502
0
$0
0
$0
6
$341,880
Aggregated Statistics For Year 1999 (Based on 4 full and 3 partial tracts)
A) FHA, FSA/RHS & VA Home Purchase Loans
B) Conventional Home Purchase Loans
C) Refinancings
D) Home Improvement Loans
E) Loans on Dwellings For 5+ Families
F) Non-occupant Loans on < 5 Family Dwellings (A B C & D)
2002 - 2018 National Fire Incident Reporting System (NFIRS) incidents
According to the data from the years 2002 - 2018 the average number of fires per year is 300. The highest number of fires - 519 took place in 2018, and the least - 0 in 2003. The data has a growing trend.
When looking into fire subcategories, the most reports belonged to: Outside Fires (49.1%), and Structure Fires (30.5%).
Fire incident types reported to NFIRS in Zip Code 89119


 Nearest zip codes: 89169, 89123, 89120, 89109, 89121, 89118.
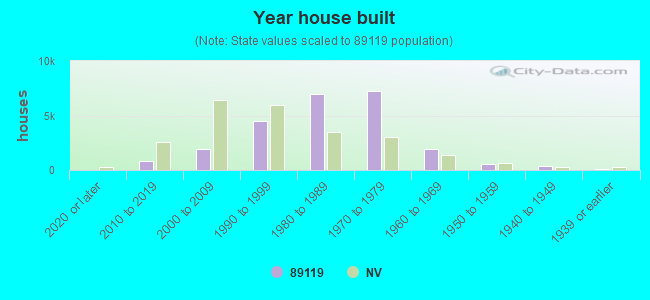


 According to the data from the years 2002 - 2018 the average number of fires per year is 300. The highest number of fires - 519 took place in 2018, and the least - 0 in 2003. The data has a growing trend.
 When looking into fire subcategories, the most reports belonged to: Outside Fires (49.1%), and Structure Fires (30.5%).