Estimated zip code population in 2022: 60,265 Zip code population in 2010: 56,300 Zip code population in 2000: 46,877
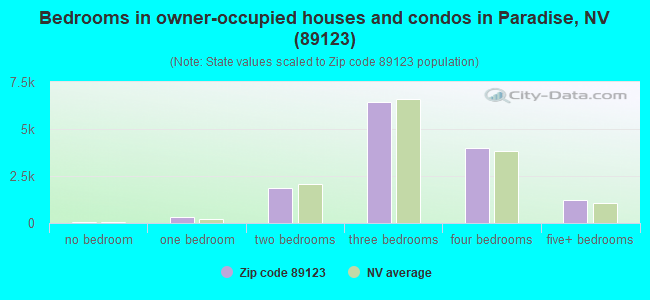
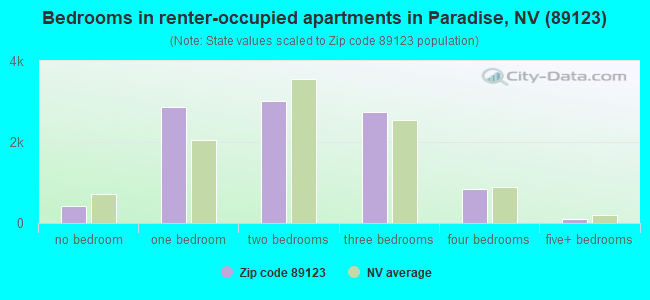
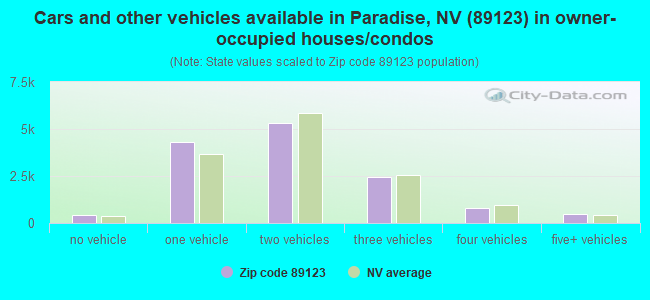
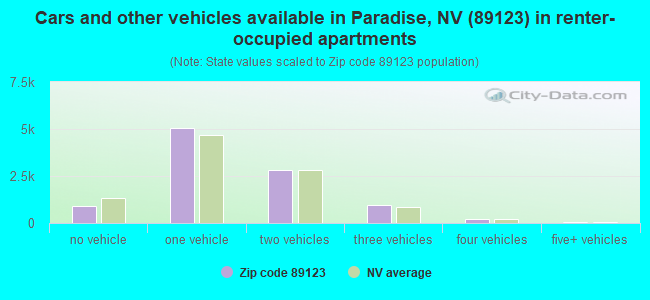
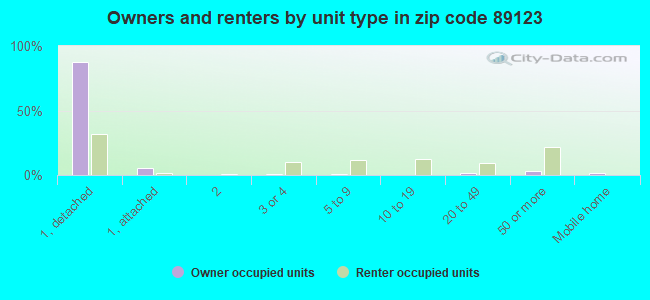
Houses and condos: 26,433 Renter-occupied apartments: 9,977
% of renters here:
42%
State:
40%
March 2022 cost of living index in zip code 89123: 99.3 (near average, U.S. average is 100)
Land area: 10.7 sq. mi. Water area: 0.0 sq. mi.
Population density: 5,654 people per square mile
(average).
OSM Map
General Map
Google Map
MSN Map
OSM Map
General Map
Google Map
MSN Map
OSM Map
General Map
Google Map
MSN Map
OSM Map
General Map
Google Map
MSN Map
Please wait while loading the map...
Real estate property taxes paid for housing units in 2022:
This zip code:
0.4% ($1,908)
Nevada:
0.4% ($1,889)
Median real estate property taxes paid for housing units with mortgages in 2022: $1,909 (0.4%) Median real estate property taxes paid for housing units with no mortgage in 2022: $1,901 (0.4%)
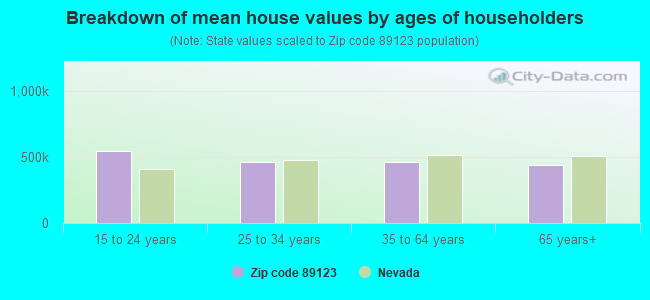
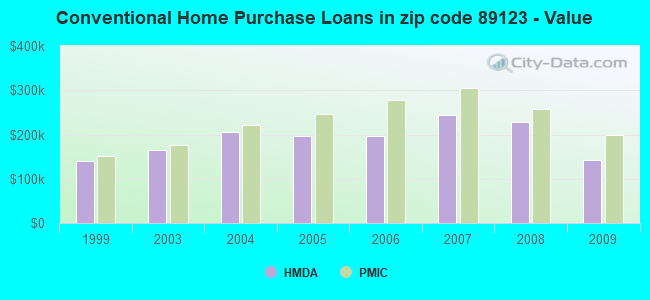
Estimated median house/condo value in 2022: $461,331
89123:
$461,331
Nevada:
$434,700
According to our research of Nevada and other state lists, there were 111 registered sex offenders living in 89123 zip code as of April 27, 2024. The ratio of all residents to sex offenders in zip code 89123 is 524 to 1. The ratio of registered sex offenders to all residents in this zip code is lower than the state average.
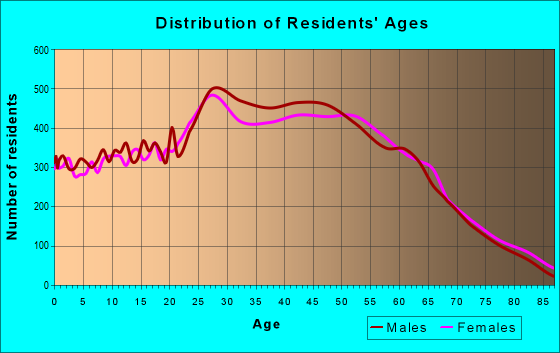
Median resident age:
This zip code:
42.5 years
Nevada median age:
39.0 years
Average household size:
This zip code:
2.5 people
Nevada:
2.6 people
Averages for the 2020 tax year for zip code 89123, filed in 2021:
Average Adjusted Gross Income (AGI) in 2020: $67,796 (Individual Income Tax Returns)
Here:
$67,796
State:
$78,964
Salary/wage: $52,544 (reported on 81.2% of returns)
Here:
$52,544
State:
$54,472
(% of AGI for various income ranges: 1113.5% for AGIs below $25k, 3361.1% for AGIs $25k-50k, 6378.1% for AGIs $50k-75k, 9261.1% for AGIs $75k-100k, 17768.8% for AGIs $100k-200k, 73090.9% for AGIs over 200k)
Taxable interest for individuals: $2,391 (reported on 23.4% of returns)
This zip code:
$2,391
Nevada:
$3,521
(% of AGI for various income ranges: 12.4% for AGIs below $25k, 13.5% for AGIs $25k-50k, 33.3% for AGIs $50k-75k, 58.0% for AGIs $75k-100k, 135.3% for AGIs $100k-200k, 3047.9% for AGIs over 200k)
Ordinary dividends: $6,618 (reported on 14.2% of returns)
Here:
$6,618
State:
$13,390
(% of AGI for various income ranges: 14.7% for AGIs below $25k, 21.6% for AGIs $25k-50k, 60.1% for AGIs $50k-75k, 114.0% for AGIs $75k-100k, 202.7% for AGIs $100k-200k, 5304.5% for AGIs over 200k)
Net capital gain/loss in AGI: +$30,985 (reported on 15.3% of returns)
Here:
+$30,985
State:
+$63,025
(% of AGI for various income ranges: 8.1% for AGIs below $25k, 17.8% for AGIs $25k-50k, 81.7% for AGIs $50k-75k, 180.0% for AGIs $75k-100k, 666.8% for AGIs $100k-200k, 36176.4% for AGIs over 200k)
Profit/loss from business: +$9,560 (reported on 18.1% of returns)
Here:
+$9,560
State:
+$11,500
(% of AGI for various income ranges: 89.7% for AGIs below $25k, 145.3% for AGIs $25k-50k, 192.6% for AGIs $50k-75k, 299.9% for AGIs $75k-100k, 543.5% for AGIs $100k-200k, 4056.1% for AGIs over 200k)
Taxable individual retirement arrangement distribution: $19,166 (reported on 6.2% of returns)
89123:
$19,166
Nevada:
$23,628
(% of AGI for various income ranges: 35.7% for AGIs below $25k, 60.1% for AGIs $25k-50k, 151.0% for AGIs $50k-75k, 333.7% for AGIs $75k-100k, 511.6% for AGIs $100k-200k, 2364.2% for AGIs over 200k)
Self-employed (Keogh) retirement plans: $20,600 (reported on 0.2% of returns)
89123:
$20,600
Nevada:
$26,634
(% of AGI for various income ranges: 3.9% for AGIs $25k-50k, 36.5% for AGIs $100k-200k)
Total itemized deductions: $39,089 (reported on 9.2% of returns)
Here:
$39,089
State:
$44,173
(% of AGI for various income ranges: 52.9% for AGIs below $25k, 149.4% for AGIs $25k-50k, 342.7% for AGIs $50k-75k, 652.9% for AGIs $75k-100k, 1340.4% for AGIs $100k-200k, 13261.8% for AGIs over 200k)
Charity contributions: $8,781 (reported on 7.4% of returns)
Here:
$8,781
State:
$12,589
(% of AGI for various income ranges: 3.8% for AGIs below $25k, 22.1% for AGIs $25k-50k, 50.8% for AGIs $50k-75k, 90.5% for AGIs $75k-100k, 222.1% for AGIs $100k-200k, 2982.7% for AGIs over 200k)
Taxes paid: $5,332 (reported on 9.1% of returns)
89123:
$5,332
State:
$6,112
(% of AGI for various income ranges: 8.2% for AGIs below $25k, 29.0% for AGIs $25k-50k, 63.7% for AGIs $50k-75k, 112.2% for AGIs $75k-100k, 210.2% for AGIs $100k-200k, 1098.5% for AGIs over 200k)
Earned income credit: $1,907 (reported on 14.4% of returns)
Here:
$1,907
State:
$2,214
(% of AGI for various income ranges: 73.7% for AGIs below $25k, 49.6% for AGIs $25k-50k, 0.9% for AGIs $50k-75k)
Percentage of individuals using paid preparers for their 2020 taxes: 92.8%
Here:
93%
State:
93%
(% for various income ranges: 92.7% for AGIs below $25k, 93.9% for AGIs $25k-50k, 91.7% for AGIs $50k-75k, 92.4% for AGIs $75k-100k, 92.9% for AGIs $100k-200k, 91.1% for AGIs over 200k)
Averages for the 2012 tax year for zip code 89123, filed in 2013:
Average Adjusted Gross Income (AGI) in 2012: $55,595 (Individual Income Tax Returns)
Here:
$55,595
State:
$61,164
Salary/wage: $48,040 (reported on 84.5% of returns)
Here:
$48,040
State:
$45,924
(% of AGI for various income ranges: 72.6% for AGIs below $25k, 83.8% for AGIs $25k-50k, 81.1% for AGIs $50k-75k, 79.6% for AGIs $75k-100k, 78.1% for AGIs $100k-200k, 41.1% for AGIs over 200k)
Taxable interest for individuals: $1,160 (reported on 23.9% of returns)
This zip code:
$1,160
Nevada:
$3,137
(% of AGI for various income ranges: 0.7% for AGIs below $25k, 0.3% for AGIs $25k-50k, 0.4% for AGIs $50k-75k, 0.4% for AGIs $75k-100k, 0.4% for AGIs $100k-200k, 0.8% for AGIs over 200k)
Ordinary dividends: $5,116 (reported on 13.7% of returns)
Here:
$5,116
State:
$11,762
(% of AGI for various income ranges: 3.2% for AGIs below $25k, 1.0% for AGIs $25k-50k, 0.7% for AGIs $50k-75k, 0.7% for AGIs $75k-100k, 0.9% for AGIs $100k-200k, 2.2% for AGIs over 200k)
Net capital gain/loss in AGI: +$9,182 (reported on 12.2% of returns)
Here:
+$9,182
State:
+$33,127
(% of AGI for various income ranges: 0.2% for AGIs $50k-75k, 0.3% for AGIs $75k-100k, 0.9% for AGIs $100k-200k, 10.0% for AGIs over 200k)
Profit/loss from business: +$16,565 (reported on 14.9% of returns)
Here:
+$16,565
State:
+$12,567
(% of AGI for various income ranges: 7.3% for AGIs below $25k, 2.8% for AGIs $25k-50k, 2.0% for AGIs $50k-75k, 1.9% for AGIs $75k-100k, 2.4% for AGIs $100k-200k, 12.1% for AGIs over 200k)
Taxable individual retirement arrangement distribution: $15,863 (reported on 6.6% of returns)
89123:
$15,863
Nevada:
$20,808
(% of AGI for various income ranges: 2.0% for AGIs below $25k, 1.4% for AGIs $25k-50k, 1.6% for AGIs $50k-75k, 2.1% for AGIs $75k-100k, 2.1% for AGIs $100k-200k, 2.1% for AGIs over 200k)
Self-employment retirement plans: $23,117 (reported on 0.2% of returns)
89123:
$23,117
Nevada:
$22,197
Total itemized deductions: $23,630 (25% of AGI, reported on 31.4% of returns)
Here:
$23,630
State:
$26,148
Here:
24.6% of AGI
State:
20.0% of AGI
(% of AGI for various income ranges: 10.1% for AGIs below $25k, 10.9% for AGIs $25k-50k, 13.0% for AGIs $50k-75k, 13.5% for AGIs $75k-100k, 13.9% for AGIs $100k-200k, 16.8% for AGIs over 200k)
Charity contributions: $2,950 (reported on 26.0% of returns)
Here:
$2,950
State:
$4,329
(% of AGI for various income ranges: 0.7% for AGIs below $25k, 1.1% for AGIs $25k-50k, 1.4% for AGIs $50k-75k, 1.5% for AGIs $75k-100k, 1.8% for AGIs $100k-200k, 1.4% for AGIs over 200k)
Taxes paid: $4,086 (reported on 30.9% of returns)
89123:
$4,086
State:
$5,116
(% of AGI for various income ranges: 1.6% for AGIs below $25k, 1.9% for AGIs $25k-50k, 2.3% for AGIs $50k-75k, 2.5% for AGIs $75k-100k, 2.6% for AGIs $100k-200k, 2.3% for AGIs over 200k)
Earned income credit: $1,897 (reported on 14.2% of returns)
Here:
$1,897
State:
$2,279
(% of AGI for various income ranges: 4.2% for AGIs below $25k, 0.8% for AGIs $25k-50k)
Percentage of individuals using paid preparers for their 2012 taxes: 52.3%
Here:
52%
State:
55%
(% for various income ranges: 46.8% for AGIs below $25k, 51.5% for AGIs $25k-50k, 53.8% for AGIs $50k-75k, 56.4% for AGIs $75k-100k, 61.8% for AGIs $100k-200k, 75.9% for AGIs over 200k)
Averages for the 2004 tax year for zip code 89123, filed in 2005:
Average Adjusted Gross Income (AGI) in 2004: $52,363 (Individual Income Tax Returns)
Here:
$52,363
State:
$58,367
Salary/wage: $44,662 (reported on 90.2% of returns)
Here:
$44,662
State:
$42,695
(% of AGI for various income ranges: 200.6% for AGIs below $10k, 86.0% for AGIs $10k-25k, 88.8% for AGIs $25k-50k, 86.4% for AGIs $50k-75k, 85.2% for AGIs $75k-100k, 58.9% for AGIs over 100k)
Taxable interest for individuals: $1,863 (reported on 34.9% of returns)
This zip code:
$1,863
Nevada:
$3,867
(% of AGI for various income ranges: 5.7% for AGIs below $10k, 1.1% for AGIs $10k-25k, 0.6% for AGIs $25k-50k, 0.7% for AGIs $50k-75k, 0.8% for AGIs $75k-100k, 2.0% for AGIs over 100k)
Taxable dividends: $2,033 (reported on 15.6% of returns)
Here:
$2,033
State:
$5,770
(% of AGI for various income ranges: 4.6% for AGIs below $10k, 0.6% for AGIs $10k-25k, 0.4% for AGIs $25k-50k, 0.3% for AGIs $50k-75k, 0.5% for AGIs $75k-100k, 0.9% for AGIs over 100k)
Net capital gain/loss: +$23,046 (reported on 15.0% of returns)
Here:
+$23,046
State:
+$50,644
(% of AGI for various income ranges: 1.5% for AGIs below $10k, 0.2% for AGIs $10k-25k, 0.5% for AGIs $25k-50k, 0.9% for AGIs $50k-75k, 1.4% for AGIs $75k-100k, 16.1% for AGIs over 100k)
Profit/loss from business: +$11,026 (reported on 13.7% of returns)
Here:
+$11,026
State:
+$13,618
(% of AGI for various income ranges: -2.9% for AGIs below $10k, 4.6% for AGIs $10k-25k, 2.2% for AGIs $25k-50k, 2.3% for AGIs $50k-75k, 2.4% for AGIs $75k-100k, 3.5% for AGIs over 100k)
IRA payment deduction: $3,036 (reported on 2.3% of returns)
89123:
$3,036
Nevada:
$3,054
(% of AGI for various income ranges: 0.3% for AGIs below $10k, 0.2% for AGIs $10k-25k, 0.2% for AGIs $25k-50k, 0.1% for AGIs $50k-75k, 0.2% for AGIs $75k-100k, 0.1% for AGIs over 100k)
Self-employed pension: $14,786 (reported on 0.5% of returns)
Here:
$14,786
Nevada:
$16,706
(% of AGI for various income ranges: 0.0% for AGIs $25k-50k, 0.1% for AGIs $50k-75k, 0.1% for AGIs $75k-100k, 0.2% for AGIs over 100k)
Total itemized deductions: $20,823 (26% of AGI, reported on 44.5% of returns)
Here:
$20,823
State:
$22,990
Here:
25.8% of AGI
State:
21.8% of AGI
(% of AGI for various income ranges: 31.4% for AGIs below $10k, 13.3% for AGIs $10k-25k, 17.6% for AGIs $25k-50k, 21.3% for AGIs $50k-75k, 21.0% for AGIs $75k-100k, 15.3% for AGIs over 100k)
Charity contributions deductions: $2,404 (3% of AGI, reported on 38.7% of returns)
Here:
$2,404
State:
$3,443
Here:
2.9% of AGI
State:
3.1% of AGI
(% of AGI for various income ranges: 1.3% for AGIs below $10k, 0.9% for AGIs $10k-25k, 1.5% for AGIs $25k-50k, 2.0% for AGIs $50k-75k, 2.2% for AGIs $75k-100k, 1.8% for AGIs over 100k)
Total tax: $7,623 (reported on 80.1% of returns)
89123:
$7,623
State:
$10,585
(% of AGI for various income ranges: 4.8% for AGIs below $10k, 4.4% for AGIs $10k-25k, 7.0% for AGIs $25k-50k, 8.8% for AGIs $50k-75k, 10.1% for AGIs $75k-100k, 17.7% for AGIs over 100k)
Earned income credit: $1,567 (reported on 11.8% of returns)
Here:
$1,567
State:
$1,676
Percentage of individuals using paid preparers for their 2004 taxes: 56.8%
Here:
57%
State:
60%
(% for various income ranges: 48.5% for AGIs below $10k, 55.3% for AGIs $10k-25k, 55.5% for AGIs $25k-50k, 58.7% for AGIs $50k-75k, 60.9% for AGIs $75k-100k, 68.6% for AGIs over 100k)
Likely homosexual households (counted as self-reported same-sex unmarried-partner households)
Lesbian couples: 0.5% of all households
Gay men: 0.5% of all households
Household received Food Stamps/SNAP in the past 12 months: 1,907 Household did not receive Food Stamps/SNAP in the past 12 months: 21,765
Women who had a birth in the past 12 months: 421 (409 now married, 46 unmarried) Women who did not have a birth in the past 12 months: 14,407 (6,070 now married, 8,327 unmarried)
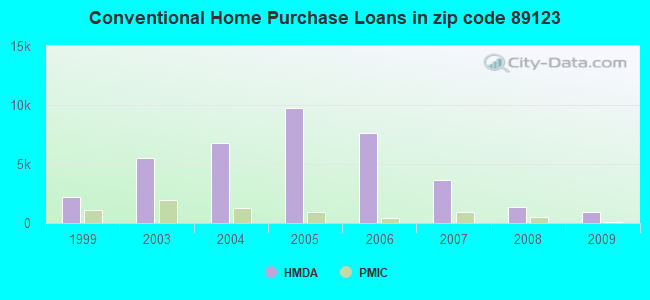
Housing units in zip code 89123 with a mortgage: 9,841 (526 second mortgage, 7 home equity loan, 461 both second mortgage and home equity loan) Houses without a mortgage: 72
Median monthly owner costs for units with a mortgage: $1,773 Median monthly owner costs for units without a mortgage: $513
Residents with income below the poverty level in 2022:
This zip code:
8.3%
Whole state:
12.5%
Residents with income below 50% of the poverty level in 2022:
This zip code:
4.2%
Whole state:
5.9%
Median number of rooms in houses and condos:
Here:
6.0
State:
6.0
Median number of rooms in apartments:
Here:
4.3
State:
4.2
Notable locations in this zip code not listed on our city pages
Notable locations in zip code 89123: Clark County Fire Department Station 29 (A), Enterprise Library (B), Clark County Fire Department Station 38 (C). Display/hide their locations on the map
Shopping Centers: Belz Factory Outlet World Shopping Center (1), Colonnade Square Shopping Center (2), Eastern Beltway Center Shopping Center (3), Eastwind Center Shopping Center (4), Las Palmas Village Shopping Center (5), Las Vegas Pointe Plaza Shopping Center (6). Display/hide their locations on the map
Churches in zip code 89123 include: Thy Word Ministries (A), The Church of Jesus Christ of Latter Day Saints (B), International Faith Center (C), Hope Baptist Church (D), Green Valley Presbyterian Church (E), Beautiful Savior Lutheran Church (F), Pebble Kingdom Hall of Jehovahs Witnesses (G), Our Lady of Victory Traditional Catholic Church (H). Display/hide their locations on the map
Tourist attractions (not listed on the city page) : Art USA Framing Factory (Art Museums; 8140 S Eastern Ave # 3), VIP Golf Services Las Vegas (Tourism Consultants; 10245 S. Maryland Pkwy #236), Las Vegas Reservation Center (Tours & Charters; 931 SWeeping Vine Avenue), Drive-Yourself Tours (Tours & Charters; 8170 South Eastern Avenue Suite 4-278), Grand Canyon West (Tours & Charters; 8170 South Eastern Avenue Suite 4-278), Las Vegas Tourism- Official Site- Las Vegas Tourism Bureau (Tours & Charters; P.o. Box 230561), Budget Buy Tours (Tours & Charters; 875 East Silverado Ranch Boulevard).
6,678 married couples with children.
1,933 single-parent households (775 men, 1,158 women).
70.8% of residents of 89123 zip code speak English at home.
13.0% of residents speak Spanish at home (67% very well, 17% well, 10% not well, 6% not at all).
4.0% of residents speak other Indo-European language at home (57% very well, 22% well, 14% not well, 6% not at all).
11.5% of residents speak Asian or Pacific Island language at home (57% very well, 30% well, 12% not well).
0.6% of residents speak other language at home (89% very well, 6% well, 5% not well).
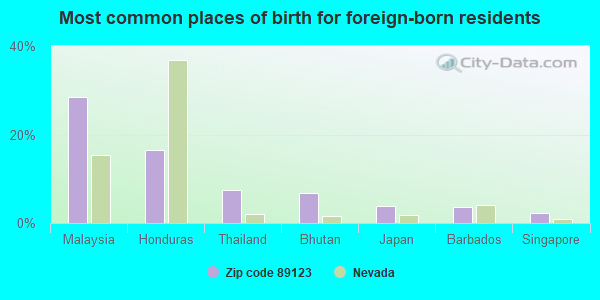
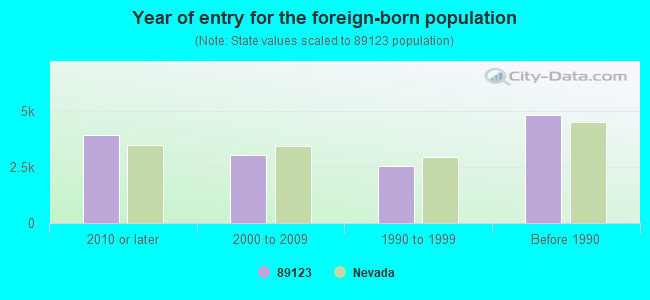
Foreign born population: 12,774 (21.2%) (68.3% of them are naturalized citizens)
Major facilities with environmental interests located in this zip code:
JOHN R BEATTY ELEMENTARY SCHOOL (8685 HIDDEN PALMS in LAS VEGAS, NV)
(Geographic Names Information System) (National Center for Education Statistics) - STATE ID-02-108 Organizations: CLARK CO SCH DIST (SCHOOL DISTRICT)
BASS, JOHN ELEM (10377 RANCHO DESTINO ROAD in LAS VEGAS, NV)
(National Center for Education Statistics) - STATE ID-02-280 Organizations: CLARK CO SCH DIST (SCHOOL DISTRICT)
GEHRING ELEM (1155 EAST RICHMAR AVENUE in LAS VEGAS, NV)
(National Center for Education Statistics) - STATE ID-02-181 Organizations: CLARK CO SCH DIST (SCHOOL DISTRICT)
HILL, CHARLOTTE ELEM (7440 BATES STREET in LAS VEGAS, NV)
(National Center for Education Statistics) - STATE ID-02-122 Organizations: CLARK CO SCH DIST (SCHOOL DISTRICT)
SCHOFIELD, JACK MIDSCH (8625 SPENCER STREET in LAS VEGAS, NV)
(National Center for Education Statistics) - STATE ID-02-344 Organizations: CLARK CO SCH DIST (SCHOOL DISTRICT)
SILVERADO HS (1650 SILVER HAWK AVENUE in LAS VEGAS, NV)
(National Center for Education Statistics) - STATE ID-02-421 Organizations: CLARK CO SCH DIST (SCHOOL DISTRICT)
SILVESTRI, CHARLESMIDSCH (1055 SILVERADO RANCH BLVD. in LAS VEGAS, NV)
(National Center for Education Statistics) - STATE ID-02-334 Organizations: CLARK CO SCH DIST (SCHOOL DISTRICT)
HOME DEPOT USA INC HD3306 (2200 E SERENE AVE in LAS VEGAS, NV)
Conditionally Exempt Small Quantity Generators, less than 100 kg/month of hazardous waste (Resource Conservation and Recovery Act (tracking hazardous waste)) Organizations: THE HOME DEPOT (CONTACT/OWNER)
Alternative names: THE HOME DEPOT NO 3306
PACIFIC OCEAN MNGMT LLC (9934 LAS VEGAS BLVD S in LAS VEGAS, NV)
Large Quantity Generators, more that 1000 kg of hazardous waste/month (Resource Conservation and Recovery Act (tracking hazardous waste)) Organizations: MICHAEL PASCHAIE (CONTACT/OWNER)
RALEYS NO 144 (8140 S EASTERN in LAS VEGAS, NV)
(Resource Conservation and Recovery Act (tracking hazardous waste))
SMITH FOOD AND DRUG ONE HOUR PHOTO (2211 N RAMPART in LAS VEGAS, NV)
(Resource Conservation and Recovery Act (tracking hazardous waste)) Organizations: SMITHS FOOD AND DRUG CENTER INC (CONTACT/OWNER)
SMITHS PHOTO LAB NO 347 (9851 W CHARLESTON in LAS VEGAS, NV)
(Resource Conservation and Recovery Act (tracking hazardous waste)) Organizations: SMITHS FOOD AND DRUG CENTER INC (CONTACT/OWNER)
SMITHS PHOTO LAB NO 376 (2385 E WINDMILL in LAS VEGAS, NV)
(Resource Conservation and Recovery Act (tracking hazardous waste)) Organizations: SMITHS FOOD AND DRUG CENTER INC (CONTACT/OWNER)
Housing units lacking complete plumbing facilities: 0.7% Housing units lacking complete kitchen facilities: 2.1%
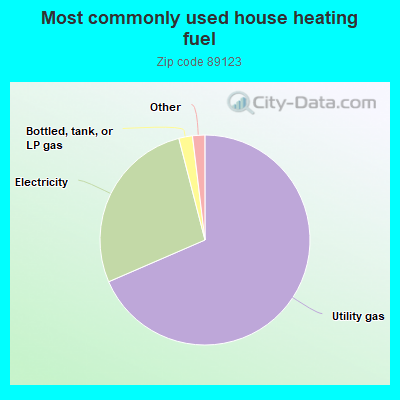
68.5%Utility gas
27.5%Electricity
2.1%Bottled, tank, or LP gas
0.7%Solar energy
0.6%No fuel used
Population in 1990: 6,706. Population change in the 1990s: +40,171 (+599.0%).
Place of birth for U.S.-born residents:
This state: 13,182
Northeast: 4,489
Midwest: 7,271
South: 4,698
West: 16,311
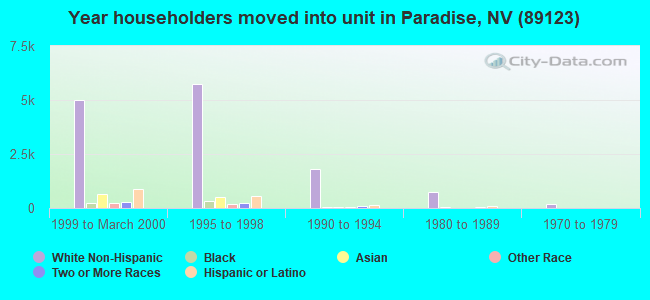
24% of the 89123 zip code residents lived in the same house 5 years ago. Out of people who lived in different houses, 51% lived in this county. Out of people who lived in different counties, 50% lived in Nevada.
89% of the 89123 zip code residents lived in the same house 1 year ago. Out of people who lived in different houses, 67% moved from this county. Out of people who lived in different houses, 0% moved from different county within same state. Out of people who lived in different houses, 29% moved from different state. Out of people who lived in different houses, 4% moved from abroad.
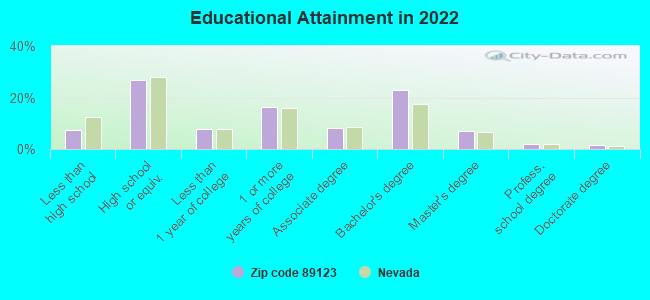
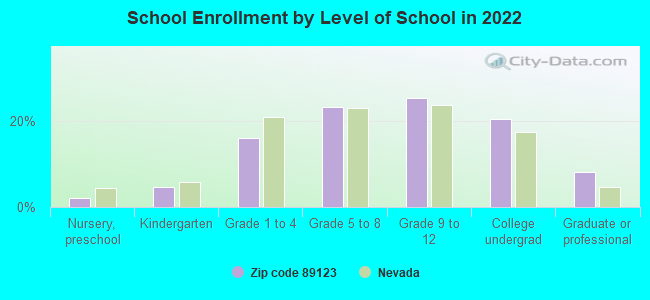
Private vs. public school enrollment:
Students in private schools in grades 1 to 8 (elementary and middle school): 839
Here:
20.2%
Nevada:
12.9%
Students in private schools in grades 9 to 12 (high school): 95
Here:
3.6%
Nevada:
6.9%
Students in private undergraduate colleges: 273
Here:
12.9%
Nevada:
16.0%
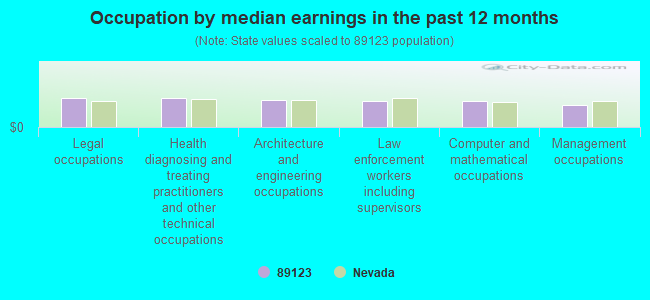
Occupation by median earnings in the past 12 months ($)
88,774Legal occupations
86,891Health diagnosing and treating practitioners and other technical occupations
82,680Architecture and engineering occupations
79,494Law enforcement workers including supervisors
79,317Computer and mathematical occupations
68,090Management occupations
Companies with federal contracts located in this zip code (LAS VEGAS, NV):
AMERICAN BIO-CLEAN CORPORATION (810 CLINE CELLARS AVE; small business) : $341,712 in 9 contractsfrom 2000 to 2005
Contracts for Recycling and Reclamation Equipment, Other Environmental Protection -- Advanced Development (R&D), Miscellaneous Maintenance and Repair Shop Specialized Equipment, Aircraft Ground Servicing Equipment, and moreby Defense Logistics Agency, Navy Signed by year:2000: $76,119; 2001: $106,238; 2002: $41,672; 2003: $0; 2004: $95,162; 2005: $22,521; 2006: $0.
Biggest contracts:
$71,682 with Defense Logistics Agency for Recycling and Reclamation Equipment. Signed on 2004-11-21. Completion date: 2005-01-20.
$64,566 with Navy for Other Environmental Protection -- Advanced Development (R&D). Taking place in CA. Signed on 2001-07-27. Completion date: 2002-09-30.
$47,680 with Defense Logistics Agency for Recycling and Reclamation Equipment. Signed on 2000-09-20. Completion date: 2000-10-20.
$41,672 with Navy for Miscellaneous Maintenance and Repair Shop Specialized Equipment. Signed on 2002-02-13. Completion date: 2002-03-15.
DIVERSIFIED FEDERAL SALES (683 PERSIAN VIOLET AVE; small business) : $89,187 in 16 contractsfrom 2003 to 2004
Contracts for Fire Fighting Equipment, Miscellaneous Electrical and Electronic Components, Cable, Cord, and Wire Assemblies: Communications Equipment, Miscellaneous Household and Commercial Furnishings and Appliances, and moreby Navy, Army Signed by year:2000: $0; 2001: $0; 2002: $0; 2003: $65,067; 2004: $24,120; 2005: $0; 2006: $0.
Biggest contracts:
$18,250 with Navy for Fire Fighting Equipment. Signed on 2003-09-25. Completion date: 2004-01-05.
$17,244 with Navy for Miscellaneous Electrical and Electronic Components. Signed on 2004-02-09. Completion date: 2004-03-12.
$14,649 with Navy for Cable, Cord, and Wire Assemblies: Communications Equipment. Signed on 2003-12-09. Completion date: 2003-12-31.
$10,656 with Navy for Miscellaneous Household and Commercial Furnishings and Appliances. Signed on 2003-06-13. Completion date: 2003-07-14.
AMUSEMENT GAME RENTALS INC (505 E WINDMILL LANE; small business)
$70,000 with Army for Training Aids. Signed on 2006-06-01. Completion date: 2006-07-10.
JASON, VOHS (10575 ALONDRA PEAK ST; small business) : $54,996 in 2 contractsin 2006
$49,996 with Army for Public Relations Services(includes writing services, event planning and management, media relations, radio and television analysis, and press services). Signed on 2006-03-21. Completion date: 2006-10-31.
$5,000, same as above.Signed on 2006-03-24. Completion date: 2006-10-31.
BRUCATO PAINTING & DECORATING (373 GLENRIDDING ST; small business) : $51,255 in 2 contractsfrom 2002 to 2003
$38,128 with Air Force for Floor Coverings. Signed on 2002-09-06. Completion date: 2002-10-25.
$13,127 with Air Force for Maintenance, Repair or Alteration of Real Property -- Other Administrative Facilities and Service Buildings. Signed on 2003-12-12. Completion date: 2003-12-29.
OZOSKY, PATRICK (8619 GABILAN CT; small business)
$24,000 with Army for Landscaping/Groundskeeping Services. Signed on 2005-08-08. Completion date: 2006-08-07.
EMERALD SUITES LLC (9145 LAS VEGAS BLVD S; small business)
$9,244 with Army for Lodging - Hotel/Motel. Signed on 2003-02-11. Completion date: 2003-02-15.
Top industries in this zip code by the number of employees in 2005:
2002 - 2018 National Fire Incident Reporting System (NFIRS) incidents
According to the data from the years 2002 - 2018 the average number of fires per year is 117. The highest number of fires - 197 took place in 2005, and the least - 8 in 2003. The data has a growing trend.
When looking into fire subcategories, the most reports belonged to: Outside Fires (47.0%), and Structure Fires (31.9%).
Fire incident types reported to NFIRS in Zip Code 89123


 Nearest zip codes: 89183, 89119, 89139, 89074, 89120, 89141.
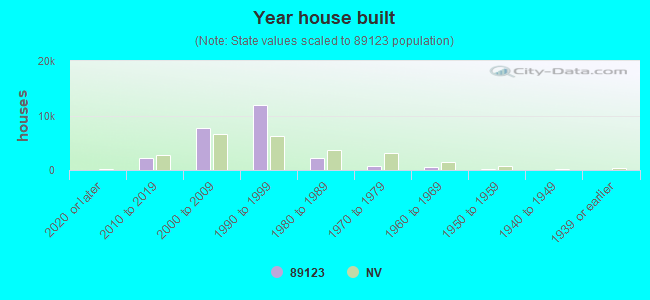


 According to the data from the years 2002 - 2018 the average number of fires per year is 117. The highest number of fires - 197 took place in 2005, and the least - 8 in 2003. The data has a growing trend.
 When looking into fire subcategories, the most reports belonged to: Outside Fires (47.0%), and Structure Fires (31.9%).