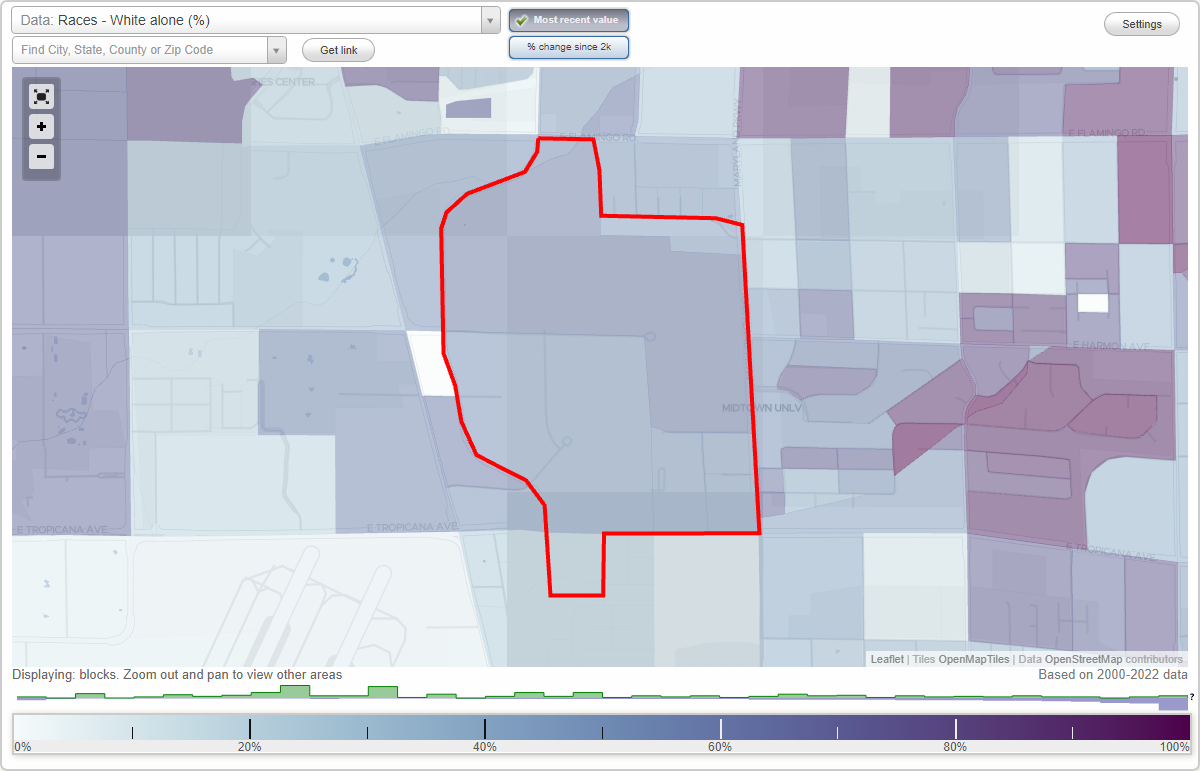
UNLV (University of Nevada, Las Vegas) neighborhood in Las Vegas, Nevada (NV), 89119, 89154 detailed profile
Settings
X

Business Search - 14 Million verified businesses
Area: 0.575 square miles
Population: 1,606
Population density:
| UNLV (University of Nevada, Las Vegas): | 2,795 people per square mile |
| Las Vegas: | 5,792 people per square mile |

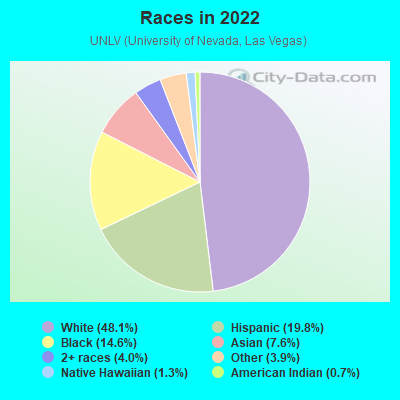
- 80248.1%White
- 33119.8%Hispanic or Latino
- 24314.6%Black
- 1277.6%Asian
- 674.0%Two or more races
- 653.9%Some other race
- 211.3%Native Hawaiian and Other
Pacific Islander - 120.7%American Indian
Distribution of median household income
![Distribution of median household income]()
- 306Less than $10,000
- 313$10,000 to $19,999
- 298$20,000 to $29,999
- 197$30,000 to $39,999
- 186$40,000 to $49,999
- 115$50,000 to $59,999
- 37$60,000 to $74,999
- 46$75,000 to $99,999
- 132$100,000 to $124,999
- 94$125,000 to $149,999
- 23$150,000 to $199,999
- 66$200,000 or more

Distribution of owner-occupied house/condo value
![Distribution of owner-occupied house/condo value]()
- 124Less than $50,000
- 62$50,000 to $99,999
- 190$100,000 to $149,999
- 103$150,000 to $199,999
- 70$200,000 to $249,999
- 56$250,000 to $299,999
- 17$300,000 to $399,999
- 119$400,000 to $499,999
- 18$500,000 to $749,999

Distribution of rent paid by renters
![Distribution of rent paid by renters]()
- 316$400 to $499
- 282$500 to $599
- 224$600 to $699
- 194$700 to $799
- 143$800 to $899
- 272$900 to $999
- 231$1,000 to $1,249
- 28$1,250 to $1,499
- 79$1,500 to $1,999
- 35$2,000 or more

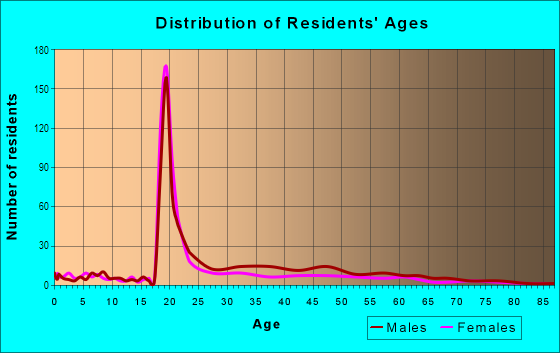
| Males: | 660 |
| Females: | 946 |
Males:
| This neighborhood: | 30.0 years |
| Whole city: | 38.4 years |
| This neighborhood: | 29.6 years |
| Whole city: | 38.9 years |
Percentage of family households:
| UNLV (University of Nevada, Las Vegas): | 14.5% |
| Las Vegas: | 45.8% |
| Here: | 1.3% |
| Las Vegas: | 40.9% |
Percentage of married-couple families with children (among all households):
| UNLV (University of Nevada, Las Vegas): | 61.2% |
| Las Vegas: | 23.4% |
Percentage of single-mother households (among all households):
| UNLV (University of Nevada, Las Vegas): | 73.0% |
| Las Vegas: | 10.1% |
Percentage of never married males 15 years old and over:
Percentage of never married females 15 years old and over:
| UNLV (University of Nevada, Las Vegas): | 33.4% |
| Las Vegas: | 19.7% |
Percentage of never married females 15 years old and over:
| UNLV (University of Nevada, Las Vegas): | 50.7% |
| city: | 17.0% |
Percentage of people that speak English not well or not at all:
| UNLV (University of Nevada, Las Vegas): | 2.1% |
| Las Vegas: | 7.0% |
Percentage of people born in this state:
Percentage of people born in another U.S. state:
Percentage of native residents but born outside the U.S.:
Percentage of foreign born residents:
| Here: | 9.5% |
| Las Vegas: | 27.3% |
Percentage of people born in another U.S. state:
| UNLV (University of Nevada, Las Vegas): | 71.8% |
| Las Vegas: | 49.8% |
Percentage of native residents but born outside the U.S.:
| Here: | 2.2% |
| city: | 1.9% |
Percentage of foreign born residents:
| Here: | 16.5% |
| Las Vegas: | 21.0% |
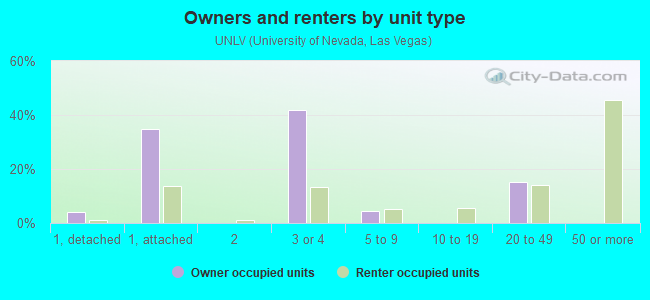
Owner-occupied
Renter-occupied

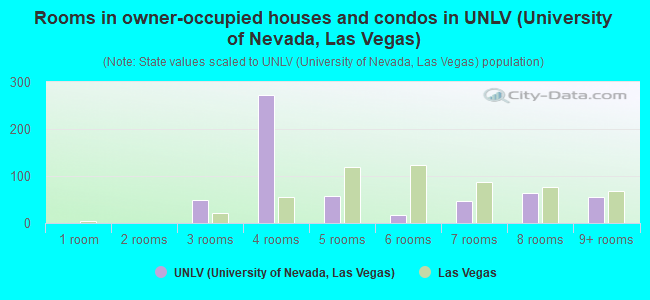
- Rooms in owner-occupied houses and condos in UNLV <
> - 01 room
- 02 rooms
- 483 rooms
- 2724 rooms
- 575 rooms
- 166 rooms
- 467 rooms
- 648 rooms
- 569+ rooms
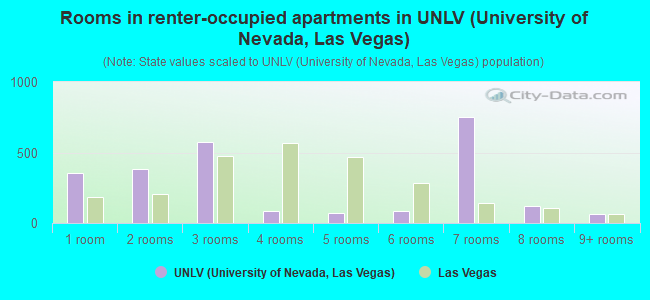
- Rooms in renter-occupied apartments in UNLV <
> - 3541 room
- 3862 rooms
- 5773 rooms
- 884 rooms
- 695 rooms
- 846 rooms
- 7497 rooms
- 1188 rooms
- 659+ rooms
Owner-occupied
Renter-occupied
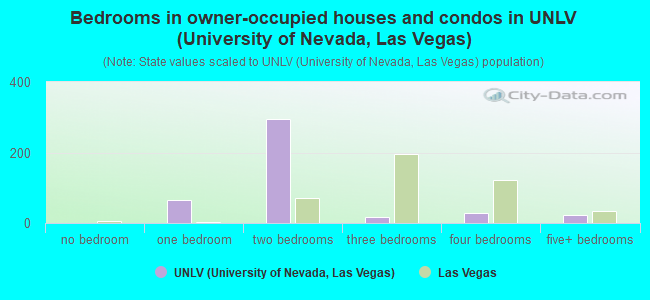
- Bedrooms in owner-occupied houses and condos in UNLV <
> - 0no bedroom
- 651 bedroom
- 2962 bedrooms
- 173 bedrooms
- 294 bedrooms
- 245+ bedrooms
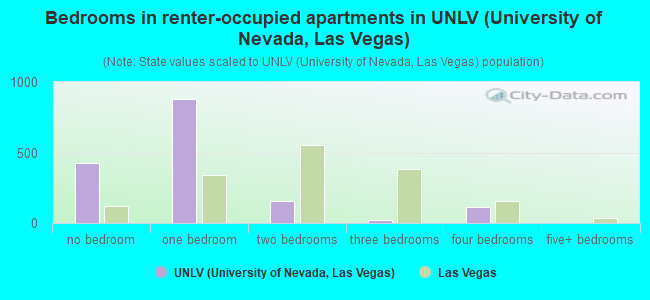
- Bedrooms in renter-occupied apartments in UNLV <
> - 426no bedroom
- 8761 bedroom
- 1532 bedrooms
- 193 bedrooms
- 1164 bedrooms
- 05+ bedrooms
Average number of cars or other vehicles available in houses/condos:
Average number of cars or other vehicles available in apartments:
| This neighborhood: | |
| Las Vegas: |
Average number of cars or other vehicles available in apartments:
| Here: | |
| city: |
Percentage of units with a mortgage:
| UNLV (University of Nevada, Las Vegas): | 10.4% |
| Las Vegas: | 69.3% |
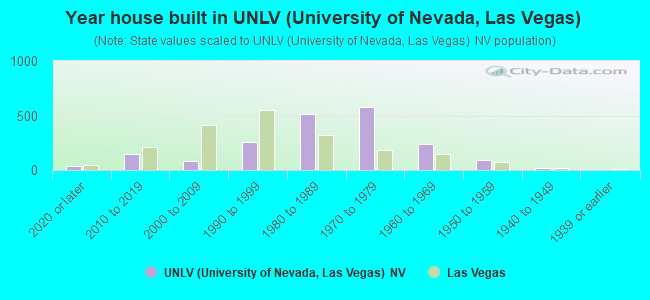
- Year house built in UNLV <
> - 342020 or later
- 1492010 to 2019
- 862000 to 2009
- 2561990 to 1999
- 5171980 to 1989
- 5801970 to 1979
- 2371960 to 1969
- 931950 to 1959
- 181940 to 1949
- 01939 or earlier
City-data.com crime index for city in 2020 (higher means more crime):
| City: | 280.7 |
| U.S. average: | 219.5 |
Travel time to work (commute)
![Travel time to work (commute)]()
- 41Less than 5 minutes
- 1655 to 9 minutes
- 18810 to 14 minutes
- 35715 to 19 minutes
- 29320 to 24 minutes
- 14725 to 29 minutes
- 12330 to 34 minutes
- 2335 to 39 minutes
- 1940 to 44 minutes
- 5745 to 59 minutes
- 1160 to 89 minutes
- 3190 or more minutes

Means of transportation to work
![Means of transportation to work]()
- 54.1%322Drove a car alone
- 8.1%48Carpooled
- 5.0%30Bus
- 0.8%5Long-distance train or commuter rail
- 3.4%20Taxi
- 10.9%65Bicycle
- 29.6%176Walked
- 4.0%24Other means
- 7.2%43Worked at home

Time leaving home to go to work
![Time leaving home to go to work]()
- 4712:00 a.m. to 4:59 a.m.
- 215:00 a.m. to 5:29 a.m.
- 385:30 a.m. to 5:59 a.m.
- 386:00 a.m. to 6:29 a.m.
- 126:30 a.m. to 6:59 a.m.
- 1517:00 a.m. to 7:29 a.m.
- 1707:30 a.m. to 7:59 a.m.
- 1618:00 a.m. to 8:29 a.m.
- 388:30 a.m. to 8:59 a.m.
- 709:00 a.m. to 9:59 a.m.
- 4010:00 a.m. to 10:59 a.m.
- 1311:00 a.m. to 11:59 a.m.
- 37512:00 p.m. to 3:59 p.m.
- 2984:00 p.m. to 11:59 p.m.

Occupations of males:
- Percentage of males in management occupations (except farmers):
Here: 8.6% city: 9.6%
- Percentage of males in computer and mathematical occupations:
Here: 2.2% city: 3.4%
- Percentage of males in legal occupations:
Here: 1.7% city: 0.9%
- Percentage of males in education, training, and library occupations:
Here: 2.5% city: 2.5%
- Percentage of males in arts, design, entertainment, sports, and media occupations:
Here: 2.8% city: 2.5%
- Percentage of males in service occupations:
Here: 31.7% city: 23.3%
- Percentage of males in sales and office occupations:
Here: 31.2% city: 16.6%
- Percentage of males in transportation occupations:
Here: 9.0% city: 6.6%
- Percentage of males in material moving occupations:
Here: 2.9% city: 5.4%
Occupations of females:
- Percentage of females in business and financial operations occupations:
Here: 3.0% city: 5.7%
- Percentage of females in legal occupations:
Here: 1.6% city: 1.5%
- Percentage of females in education, training, and library occupations:
Here: 2.7% city: 8.0%
- Percentage of females in arts, design, entertainment, sports, and media occupations:
Here: 1.0% city: 1.8%
- Percentage of females in service occupations:
Here: 50.1% city: 26.5%
- Percentage of females in sales and office occupations:
Here: 36.5% city: 30.5%
- Percentage of females in material moving occupations:
Here: 5.7% city: 2.2%
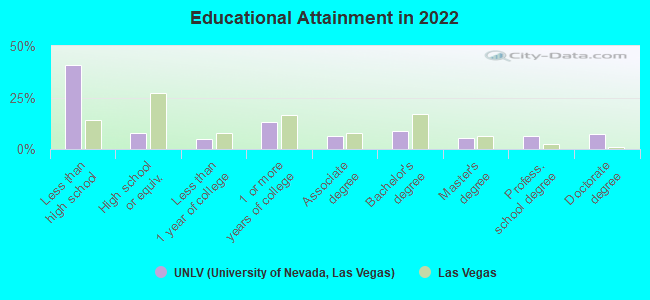
Education in this neighborhood (subdivision or community):
- Percentage of people 3 years and older in K-12 schools:
UNLV (University of Nevada, Las Vegas): 47.8% Las Vegas: 17.4%
- Percentage of people 3 years and older in undergraduate colleges:
UNLV (University of Nevada, Las Vegas): 52.8% Las Vegas: 4.2%
- Percentage of people 3 years and older in grad. or professional schools:
UNLV (University of Nevada, Las Vegas): 21.7% Las Vegas: 1.0%
- Percentage of students K-12 enrolled in private schools:
UNLV (University of Nevada, Las Vegas): 23.9% Las Vegas: 12.9%
Percentage of population below poverty level:
| UNLV (University of Nevada, Las Vegas): | 33.1% |
| Las Vegas: | 14.1% |
Percentage of married-couple families with both working:
| UNLV (University of Nevada, Las Vegas): | 151.4% |
| Las Vegas: | 62.0% |
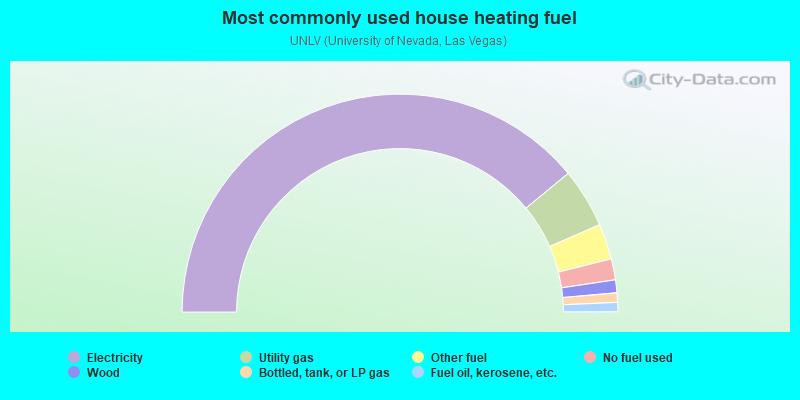
- 77.9%Electricity
- 8.8%Utility gas
- 5.3%Other fuel
- 3.1%No fuel used
- 1.9%Wood
- 1.4%Bottled, tank, or LP gas
- 1.4%Fuel oil, kerosene, etc.
Roads and streets:
S Maryland Pkwy
Length: 0.70 miles
Direction: N-S
Address range: 4300 to 4899
Direction: N-S
Address range: 4300 to 4899
E Tropicana Ave
Length: 0.38 miles
Direction: E-W
Address range: 900 to 1199
Direction: E-W
Address range: 900 to 1199
University Rd
Length: 0.30 miles
Directions: E-W, SE-NW
Address range: 900 to 1199
Directions: E-W, SE-NW
Address range: 900 to 1199
Gym Rd
Length: 0.26 miles
Direction: N-S
Direction: N-S
Brussels St
Length: 0.24 miles
Direction: N-S
Address range: 4600 to 4999
Direction: N-S
Address range: 4600 to 4999
Gym Dr
Length: 0.21 miles
Directions: N-S, SE-NW
Address range: 4500 to 4799
Directions: N-S, SE-NW
Address range: 4500 to 4799
Dorothy Ave
Length: 0.15 miles
Direction: E-W
Address range: 1100 to 1199
Direction: E-W
Address range: 1100 to 1199
Bock St
Length: 0.12 miles
Direction: N-S
Address range: 4900 to 4999
Direction: N-S
Address range: 4900 to 4999