Estimated zip code population in 2022: 21,205 Zip code population in 2010: 19,071 Zip code population in 2000: 18,265
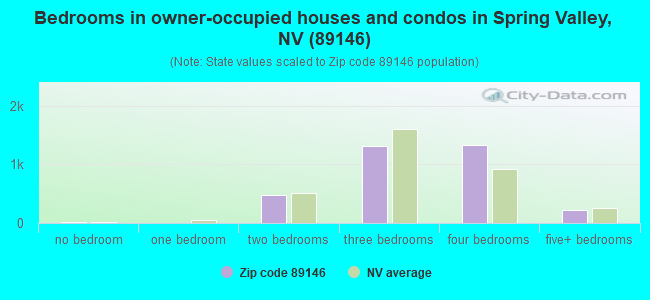
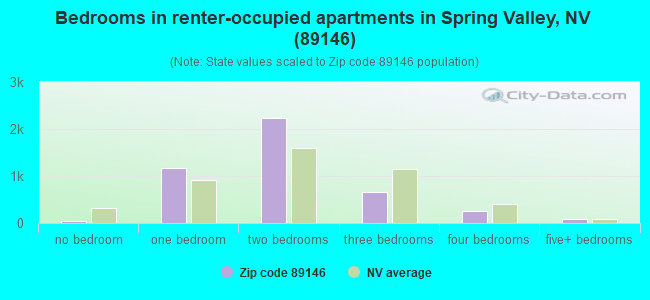
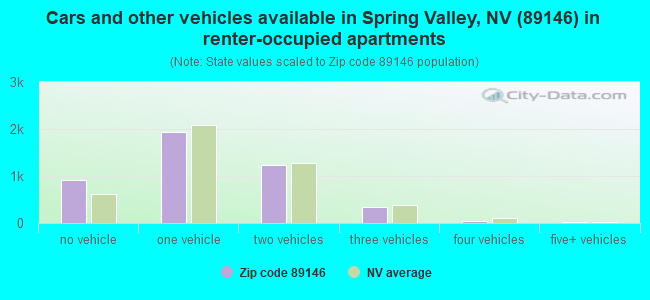
Houses and condos: 8,556 Renter-occupied apartments: 4,492
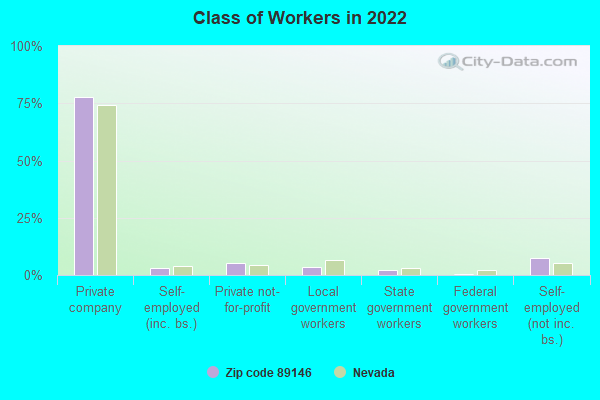
% of renters here:
57%
State:
40%
March 2022 cost of living index in zip code 89146: 100.9 (near average, U.S. average is 100)
Land area: 4.8 sq. mi. Water area: 0.0 sq. mi.
Population density: 4,425 people per square mile
(average).
OSM Map
General Map
Google Map
MSN Map
OSM Map
General Map
Google Map
MSN Map
OSM Map
General Map
Google Map
MSN Map
OSM Map
General Map
Google Map
MSN Map
Please wait while loading the map...
Real estate property taxes paid for housing units in 2022:
This zip code:
0.4% ($2,054)
Nevada:
0.4% ($1,889)
Median real estate property taxes paid for housing units with mortgages in 2022: $1,935 (0.4%) Median real estate property taxes paid for housing units with no mortgage in 2022: $2,237 (0.5%)
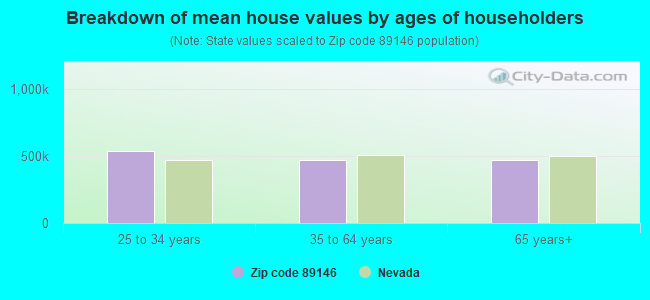
Estimated median house/condo value in 2022: $459,354
89146:
$459,354
Nevada:
$434,700
According to our research of Nevada and other state lists, there were 63 registered sex offenders living in 89146 zip code as of April 26, 2024. The ratio of all residents to sex offenders in zip code 89146 is 288 to 1. The ratio of registered sex offenders to all residents in this zip code is near the state average.
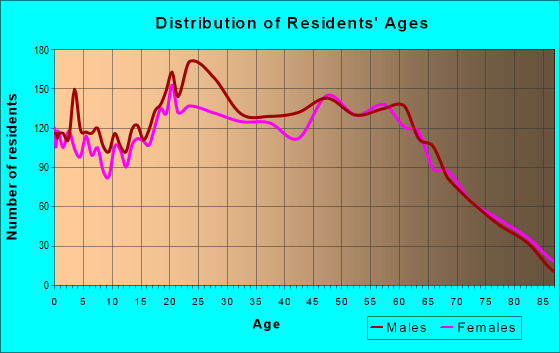
Median resident age:
This zip code:
39.3 years
Nevada median age:
39.0 years
Average household size:
This zip code:
2.6 people
Nevada:
2.6 people
Averages for the 2020 tax year for zip code 89146, filed in 2021:
Average Adjusted Gross Income (AGI) in 2020: $53,988 (Individual Income Tax Returns)
Here:
$53,988
State:
$78,964
Salary/wage: $38,834 (reported on 79.5% of returns)
Here:
$38,834
State:
$54,472
(% of AGI for various income ranges: 1174.6% for AGIs below $25k, 3426.1% for AGIs $25k-50k, 6473.3% for AGIs $50k-75k, 9405.6% for AGIs $75k-100k, 16475.9% for AGIs $100k-200k, 74471.4% for AGIs over 200k)
Taxable interest for individuals: $2,385 (reported on 17.6% of returns)
This zip code:
$2,385
Nevada:
$3,521
(% of AGI for various income ranges: 9.4% for AGIs below $25k, 11.7% for AGIs $25k-50k, 38.4% for AGIs $50k-75k, 70.6% for AGIs $75k-100k, 252.9% for AGIs $100k-200k, 3062.9% for AGIs over 200k)
Ordinary dividends: $8,293 (reported on 10.9% of returns)
Here:
$8,293
State:
$13,390
(% of AGI for various income ranges: 9.0% for AGIs below $25k, 16.3% for AGIs $25k-50k, 64.6% for AGIs $50k-75k, 177.5% for AGIs $75k-100k, 398.8% for AGIs $100k-200k, 8114.3% for AGIs over 200k)
Net capital gain/loss in AGI: +$42,133 (reported on 12.4% of returns)
Here:
+$42,133
State:
+$63,025
(% of AGI for various income ranges: 5.4% for AGIs below $25k, 23.8% for AGIs $25k-50k, 106.3% for AGIs $50k-75k, 290.9% for AGIs $75k-100k, 1417.9% for AGIs $100k-200k, 61922.9% for AGIs over 200k)
Profit/loss from business: +$10,254 (reported on 20.4% of returns)
Here:
+$10,254
State:
+$11,500
(% of AGI for various income ranges: 119.6% for AGIs below $25k, 140.7% for AGIs $25k-50k, 294.1% for AGIs $50k-75k, 685.0% for AGIs $75k-100k, 614.1% for AGIs $100k-200k, 9960.0% for AGIs over 200k)
Taxable individual retirement arrangement distribution: $21,715 (reported on 4.8% of returns)
89146:
$21,715
Nevada:
$23,628
(% of AGI for various income ranges: 15.8% for AGIs below $25k, 35.4% for AGIs $25k-50k, 162.4% for AGIs $50k-75k, 454.7% for AGIs $75k-100k, 1028.5% for AGIs $100k-200k, 3715.7% for AGIs over 200k)
Total itemized deductions: $36,932 (reported on 6.4% of returns)
Here:
$36,932
State:
$44,173
(% of AGI for various income ranges: 29.7% for AGIs below $25k, 109.0% for AGIs $25k-50k, 376.0% for AGIs $50k-75k, 803.1% for AGIs $75k-100k, 1617.4% for AGIs $100k-200k, 12528.6% for AGIs over 200k)
Charity contributions: $8,512 (reported on 5.1% of returns)
Here:
$8,512
State:
$12,589
(% of AGI for various income ranges: 3.8% for AGIs below $25k, 15.0% for AGIs $25k-50k, 39.0% for AGIs $50k-75k, 137.2% for AGIs $75k-100k, 235.6% for AGIs $100k-200k, 3135.7% for AGIs over 200k)
Taxes paid: $5,720 (reported on 6.3% of returns)
89146:
$5,720
State:
$6,112
(% of AGI for various income ranges: 5.3% for AGIs below $25k, 23.8% for AGIs $25k-50k, 60.1% for AGIs $50k-75k, 130.0% for AGIs $75k-100k, 245.6% for AGIs $100k-200k, 1578.6% for AGIs over 200k)
Earned income credit: $2,177 (reported on 23.4% of returns)
Here:
$2,177
State:
$2,214
(% of AGI for various income ranges: 108.0% for AGIs below $25k, 71.0% for AGIs $25k-50k)
Percentage of individuals using paid preparers for their 2020 taxes: 91.8%
Here:
92%
State:
93%
(% for various income ranges: 90.8% for AGIs below $25k, 92.4% for AGIs $25k-50k, 92.5% for AGIs $50k-75k, 92.7% for AGIs $75k-100k, 92.8% for AGIs $100k-200k, 93.5% for AGIs over 200k)
Averages for the 2012 tax year for zip code 89146, filed in 2013:
Average Adjusted Gross Income (AGI) in 2012: $47,828 (Individual Income Tax Returns)
Here:
$47,828
State:
$61,164
Salary/wage: $37,030 (reported on 81.4% of returns)
Here:
$37,030
State:
$45,924
(% of AGI for various income ranges: 75.8% for AGIs below $25k, 84.0% for AGIs $25k-50k, 73.5% for AGIs $50k-75k, 69.7% for AGIs $75k-100k, 62.8% for AGIs $100k-200k, 30.2% for AGIs over 200k)
Taxable interest for individuals: $2,620 (reported on 20.1% of returns)
This zip code:
$2,620
Nevada:
$3,137
(% of AGI for various income ranges: 0.8% for AGIs below $25k, 0.7% for AGIs $25k-50k, 0.9% for AGIs $50k-75k, 0.3% for AGIs $75k-100k, 0.9% for AGIs $100k-200k, 2.2% for AGIs over 200k)
Ordinary dividends: $7,536 (reported on 13.1% of returns)
Here:
$7,536
State:
$11,762
(% of AGI for various income ranges: 2.2% for AGIs below $25k, 1.5% for AGIs $25k-50k, 1.1% for AGIs $50k-75k, 1.2% for AGIs $75k-100k, 1.8% for AGIs $100k-200k, 3.5% for AGIs over 200k)
Net capital gain/loss in AGI: +$24,411 (reported on 11.7% of returns)
Here:
+$24,411
State:
+$33,127
(% of AGI for various income ranges: 0.6% for AGIs $50k-75k, 0.7% for AGIs $75k-100k, 2.6% for AGIs $100k-200k, 21.8% for AGIs over 200k)
Profit/loss from business: +$11,719 (reported on 17.1% of returns)
Here:
+$11,719
State:
+$12,567
(% of AGI for various income ranges: 10.1% for AGIs below $25k, 3.3% for AGIs $25k-50k, 2.2% for AGIs $50k-75k, 3.1% for AGIs $75k-100k, 3.3% for AGIs $100k-200k, 4.0% for AGIs over 200k)
Taxable individual retirement arrangement distribution: $17,707 (reported on 6.3% of returns)
89146:
$17,707
Nevada:
$20,808
(% of AGI for various income ranges: 1.5% for AGIs below $25k, 1.0% for AGIs $25k-50k, 2.5% for AGIs $50k-75k, 3.1% for AGIs $75k-100k, 4.2% for AGIs $100k-200k, 2.1% for AGIs over 200k)
Self-employment retirement plans: $15,250 (reported on 0.2% of returns)
89146:
$15,250
Nevada:
$22,197
(% of AGI for various income ranges: 0.6% for AGIs $50k-75k)
Total itemized deductions: $31,747 (30% of AGI, reported on 22.3% of returns)
Here:
$31,747
State:
$26,148
Here:
30.4% of AGI
State:
20.0% of AGI
(% of AGI for various income ranges: 7.7% for AGIs below $25k, 9.2% for AGIs $25k-50k, 12.1% for AGIs $50k-75k, 13.4% for AGIs $75k-100k, 14.0% for AGIs $100k-200k, 25.9% for AGIs over 200k)
Charity contributions: $3,846 (reported on 17.9% of returns)
Here:
$3,846
State:
$4,329
(% of AGI for various income ranges: 0.6% for AGIs below $25k, 1.0% for AGIs $25k-50k, 1.4% for AGIs $50k-75k, 1.8% for AGIs $75k-100k, 2.0% for AGIs $100k-200k, 1.8% for AGIs over 200k)
Taxes paid: $4,029 (reported on 21.6% of returns)
89146:
$4,029
State:
$5,116
(% of AGI for various income ranges: 1.2% for AGIs below $25k, 1.4% for AGIs $25k-50k, 1.9% for AGIs $50k-75k, 2.6% for AGIs $75k-100k, 2.6% for AGIs $100k-200k, 1.5% for AGIs over 200k)
Earned income credit: $2,214 (reported on 24.3% of returns)
Here:
$2,214
State:
$2,279
(% of AGI for various income ranges: 6.9% for AGIs below $25k, 1.1% for AGIs $25k-50k)
Percentage of individuals using paid preparers for their 2012 taxes: 58.9%
Here:
59%
State:
55%
(% for various income ranges: 56.8% for AGIs below $25k, 59.3% for AGIs $25k-50k, 57.8% for AGIs $50k-75k, 57.1% for AGIs $75k-100k, 65.0% for AGIs $100k-200k, 85.0% for AGIs over 200k)
Averages for the 2004 tax year for zip code 89146, filed in 2005:
Average Adjusted Gross Income (AGI) in 2004: $60,904 (Individual Income Tax Returns)
Here:
$60,904
State:
$58,367
Salary/wage: $38,954 (reported on 84.3% of returns)
Here:
$38,954
State:
$42,695
(% of AGI for various income ranges: 186.0% for AGIs below $10k, 84.7% for AGIs $10k-25k, 84.6% for AGIs $25k-50k, 78.3% for AGIs $50k-75k, 70.5% for AGIs $75k-100k, 32.0% for AGIs over 100k)
Taxable interest for individuals: $4,950 (reported on 31.9% of returns)
This zip code:
$4,950
Nevada:
$3,867
(% of AGI for various income ranges: 16.0% for AGIs below $10k, 1.6% for AGIs $10k-25k, 1.0% for AGIs $25k-50k, 1.5% for AGIs $50k-75k, 2.0% for AGIs $75k-100k, 3.3% for AGIs over 100k)
Taxable dividends: $4,045 (reported on 17.1% of returns)
Here:
$4,045
State:
$5,770
(% of AGI for various income ranges: 8.1% for AGIs below $10k, 0.7% for AGIs $10k-25k, 0.8% for AGIs $25k-50k, 0.9% for AGIs $50k-75k, 0.8% for AGIs $75k-100k, 1.3% for AGIs over 100k)
Net capital gain/loss: +$88,997 (reported on 16.8% of returns)
Here:
+$88,997
State:
+$50,644
(% of AGI for various income ranges: -5.4% for AGIs below $10k, 0.3% for AGIs $10k-25k, 0.6% for AGIs $25k-50k, 1.2% for AGIs $50k-75k, 3.0% for AGIs $75k-100k, 43.0% for AGIs over 100k)
Profit/loss from business: +$16,247 (reported on 14.0% of returns)
Here:
+$16,247
State:
+$13,618
(% of AGI for various income ranges: -3.1% for AGIs below $10k, 3.3% for AGIs $10k-25k, 2.3% for AGIs $25k-50k, 3.7% for AGIs $50k-75k, 4.8% for AGIs $75k-100k, 4.2% for AGIs over 100k)
IRA payment deduction: $3,406 (reported on 2.4% of returns)
89146:
$3,406
Nevada:
$3,054
(% of AGI for various income ranges: 0.2% for AGIs $10k-25k, 0.2% for AGIs $25k-50k, 0.3% for AGIs $50k-75k, 0.2% for AGIs $75k-100k, 0.1% for AGIs over 100k)
Self-employed pension: $15,326 (reported on 0.5% of returns)
Here:
$15,326
Nevada:
$16,706
Total itemized deductions: $23,474 (23% of AGI, reported on 33.3% of returns)
Here:
$23,474
State:
$22,990
Here:
22.9% of AGI
State:
21.8% of AGI
(% of AGI for various income ranges: 30.5% for AGIs below $10k, 11.5% for AGIs $10k-25k, 15.1% for AGIs $25k-50k, 17.8% for AGIs $50k-75k, 17.3% for AGIs $75k-100k, 10.6% for AGIs over 100k)
Charity contributions deductions: $3,861 (4% of AGI, reported on 28.8% of returns)
Here:
$3,861
State:
$3,443
Here:
3.5% of AGI
State:
3.1% of AGI
(% of AGI for various income ranges: 1.1% for AGIs below $10k, 0.9% for AGIs $10k-25k, 1.5% for AGIs $25k-50k, 2.0% for AGIs $50k-75k, 2.2% for AGIs $75k-100k, 2.0% for AGIs over 100k)
Total tax: $11,516 (reported on 73.9% of returns)
89146:
$11,516
State:
$10,585
(% of AGI for various income ranges: 5.5% for AGIs below $10k, 4.0% for AGIs $10k-25k, 6.9% for AGIs $25k-50k, 9.9% for AGIs $50k-75k, 11.5% for AGIs $75k-100k, 18.7% for AGIs over 100k)
Earned income credit: $1,651 (reported on 16.3% of returns)
Here:
$1,651
State:
$1,676
Percentage of individuals using paid preparers for their 2004 taxes: 61.6%
Here:
62%
State:
60%
(% for various income ranges: 56.1% for AGIs below $10k, 59.4% for AGIs $10k-25k, 59.8% for AGIs $25k-50k, 67.4% for AGIs $50k-75k, 66.2% for AGIs $75k-100k, 73.8% for AGIs over 100k)
Likely homosexual households (counted as self-reported same-sex unmarried-partner households)
Lesbian couples: 0.1% of all households
Gay men: 0.3% of all households
Household received Food Stamps/SNAP in the past 12 months: 1,431 Household did not receive Food Stamps/SNAP in the past 12 months: 6,578
Women who had a birth in the past 12 months: 498 (434 now married, 89 unmarried) Women who did not have a birth in the past 12 months: 4,255 (1,336 now married, 2,933 unmarried)
Housing units in zip code 89146 with a mortgage: 2,100 (174 second mortgage, 10 home equity loan, 139 both second mortgage and home equity loan) Houses without a mortgage: 9
Median monthly owner costs for units with a mortgage: $1,751 Median monthly owner costs for units without a mortgage: $642
Residents with income below the poverty level in 2022:
This zip code:
17.1%
Whole state:
12.5%
Residents with income below 50% of the poverty level in 2022:
This zip code:
7.3%
Whole state:
5.9%
Median number of rooms in houses and condos:
Here:
6.3
State:
6.0
Median number of rooms in apartments:
Here:
4.0
State:
4.2
Notable locations in this zip code not listed on our city pages
Shopping Centers: Westland Mall (1), Fountains Shopping Center (2), The Springs Shopping Center (3), Charleston West Shopping Center (4), Spring Mountain Center Shopping Center (5). Display/hide their locations on the map
Churches in zip code 89146 include: United Pentecostal Gospel Lighthouse Church (A), Trinity United Methodist Church (B), The Potters House (C), The First Korean Baptist Church (D), The Church at Las Vegas (E), Daybreak Christian Fellowship Church (F), Community of Christ Church (G), Bahai Center (H), Our Lady of Wisdom Church (I). Display/hide their locations on the map
2,240 married couples with children.
1,110 single-parent households (172 men, 938 women).
59.7% of residents of 89146 zip code speak English at home.
25.5% of residents speak Spanish at home (58% very well, 15% well, 18% not well, 9% not at all).
2.4% of residents speak other Indo-European language at home (64% very well, 23% well, 13% not well).
11.6% of residents speak Asian or Pacific Island language at home (46% very well, 28% well, 15% not well, 11% not at all).
1.0% of residents speak other language at home (47% very well, 35% well, 18% not well).
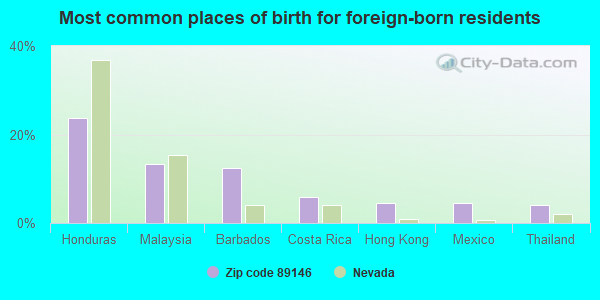
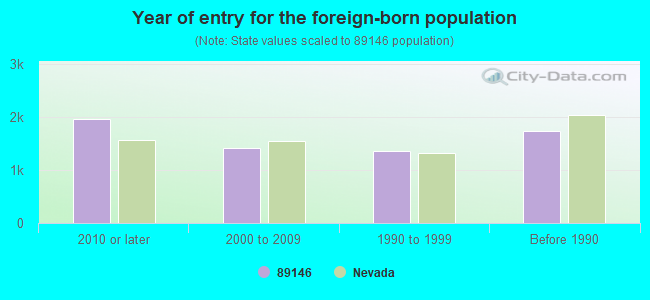
Foreign born population: 6,029 (28.4%) (51.9% of them are naturalized citizens)
Facilities with environmental interests located in this zip code:
BONANZA HIGH SCHOOL (6665 W. DEL REY AVE in LAS VEGAS, NV)
(Geographic Names Information System) (National Center for Education Statistics) - STATE ID-02-411 Organizations: CLARK CO SCH DIST (SCHOOL DISTRICT)
Alternative names: BONANZA HS
DORIS HANCOCK ELEMENTARY SCHOOL (1661 LINDELL ROAD in LAS VEGAS, NV)
(Geographic Names Information System) (National Center for Education Statistics) - STATE ID-02-207 Organizations: CLARK CO SCH DIST (SCHOOL DISTRICT)
Alternative names: HANCOCK, DORIS ELEM
ELAINE WYNN ELEMENTARY SCHOOL (5655 EDNA AVE in LAS VEGAS, NV)
(Geographic Names Information System) (National Center for Education Statistics) - STATE ID-02-121 Organizations: CLARK CO SCH DIST (SCHOOL DISTRICT)
Alternative names: WYNN, ELAINE ELEM
R GUILD GRAY ELEMENTARY SCHOOL (2825 SOUTH TORREY PINES in LAS VEGAS, NV)
(Geographic Names Information System) (National Center for Education Statistics) - STATE ID-02-278 Organizations: CLARK CO SCH DIST (SCHOOL DISTRICT)
Alternative names: GRAY, R GUILD ELEM
ODYSSEY CHARTER SCHOOL (6701 W. CHARLESTON BLVD. in LAS VEGAS, NV)
(National Center for Education Statistics) - STATE ID-02-299 Organizations: CLARK CO SCH DIST (SCHOOL DISTRICT)
TOSHIBA BUSINESS SOLUTIONS (6029 W CHARLESTON BLVD in LAS VEGAS, NV)
(Resource Conservation and Recovery Act (tracking hazardous waste)) Business NAICS classification: ALL OTHER MISCELLANEOUS STORE RETAILERS (EXCEPT TOBACCO STORES). Organizations: DWIGHT HAROUFF (CONTACT/OWNER)
, MARY HAROUFF (CONTACT/OWNER)
, S & L INVESTMENTS (CONTACT/OWNER)
Alternative names: SKIPCO INC
7 - ELEVEN CORPORATION (6655 WEST SAHARA AVENUE in LAS VEGAS, NV)
National Pollutant Discharge Elimination System NON-MAJOR (Tracking pollutant discharge elimination systems) - permit Business SIC classification: GROCERY STORES
ALL STAR DRY CLEANERS (6789 W CHARLESTON BLVD STE A in LAS VEGAS, NV)
Small Quantity Generators, between 100 kg and 1000 kg of hazardous waste/month (Resource Conservation and Recovery Act (tracking hazardous waste))
COURTESY OLDSMOBILE, INC (5800 WEST SAHARA AVENUE in LAS VEGAS, NV)
HAZARDOUS WASTE BIENNIAL REPORTER (Resource Conservation and Recovery Act (tracking hazardous waste)) (Resource Conservation and Recovery Act (tracking hazardous waste)) Business NAICS classification: GENERAL AUTOMOTIVE REPAIR.; AUTOMOTIVE BODY, PAINT, AND INTERIOR REPAIR AND MAINTENANCE.
SATURN OF WEST SAHARA (5325 W SAHARA AVE in LAS VEGAS, NV)
Conditionally Exempt Small Quantity Generators, less than 100 kg/month of hazardous waste (Resource Conservation and Recovery Act (tracking hazardous waste)) - notification Organizations: PETE FINDLAY (CONTACT/OWNER)
ETEX LTD. (5000 W. OAKEY BLVD., STE D-24 in LAS VEGAS, NV)
COMPLIANCE ACTIVITY (Tracking inspections of insecticide, fungicide, and rodenticide, and toxic substances)
TOWBIN JEEP (5555 W SAHARA AVE in LAS VEGAS, NV)
Conditionally Exempt Small Quantity Generators, less than 100 kg/month of hazardous waste (Resource Conservation and Recovery Act (tracking hazardous waste)) Alternative names: TOWBIN JEEP EAGLE
Housing units lacking complete plumbing facilities: 0.1% Housing units lacking complete kitchen facilities: 0.3%
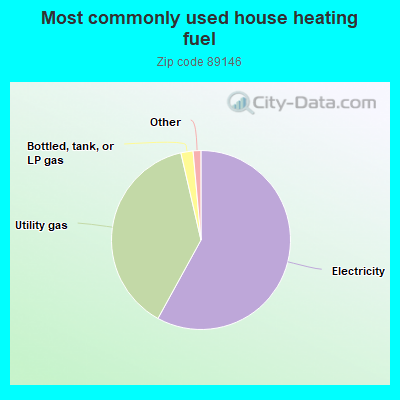
58.0%Electricity
38.4%Utility gas
2.2%Bottled, tank, or LP gas
Place of birth for U.S.-born residents:
This state: 5,082
Northeast: 1,358
Midwest: 1,696
South: 1,285
West: 5,390
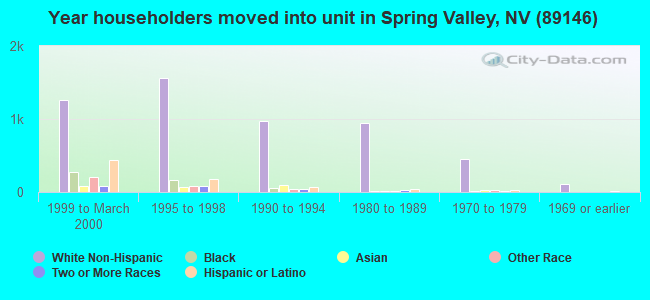
46% of the 89146 zip code residents lived in the same house 5 years ago. Out of people who lived in different houses, 59% lived in this county. Out of people who lived in different counties, 50% lived in Nevada.
84% of the 89146 zip code residents lived in the same house 1 year ago. Out of people who lived in different houses, 70% moved from this county. Out of people who lived in different houses, 2% moved from different county within same state. Out of people who lived in different houses, 24% moved from different state. Out of people who lived in different houses, 1% moved from abroad.
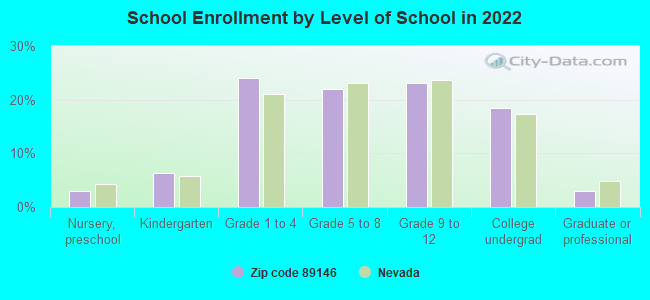
Private vs. public school enrollment:
Students in private schools in grades 1 to 8 (elementary and middle school): 162
Here:
9.3%
Nevada:
12.9%
Students in private schools in grades 9 to 12 (high school): 109
Here:
12.2%
Nevada:
6.9%
Students in private undergraduate colleges: 156
Here:
21.1%
Nevada:
16.0%
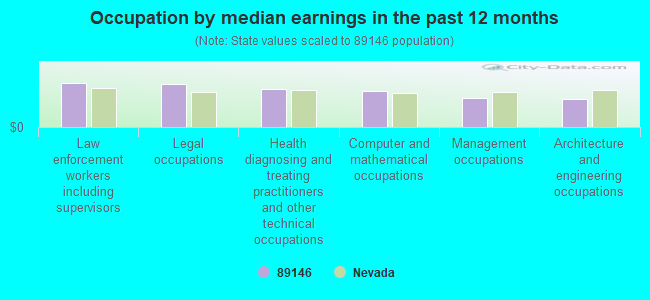
Occupation by median earnings in the past 12 months ($)
107,326Law enforcement workers including supervisors
105,402Legal occupations
92,592Health diagnosing and treating practitioners and other technical occupations
86,987Computer and mathematical occupations
70,655Management occupations
67,492Architecture and engineering occupations
Companies with federal contracts located in this zip code (LAS VEGAS, NV):
NEVADA POWER COMPANY (6226 WEST SAHARA AVENUE) : $26,964,148 in 51 contractsfrom 2000 to 2006
Contracts for Electric Services, Telephone and/or Communications Services (includes Telegraph, Telex, and Cablevision Services), Other Housekeeping Services, Utilities, and moreby Air Force, Department of Veterans Affairs, Public Buildings Service, ENERGY, Department of, and others Signed by year:2000: $4,100,892; 2001: $4,428,804; 2002: $6,641,788; 2003: $10,322,825; 2004: $853,816; 2005: $515,858; 2006: $100,165.
Biggest contracts:
$9,057,524 with Air Force for Electric Services. Signed on 2003-09-27. Completion date: 2003-09-30.
$5,923,561, same as above.Signed on 2002-09-27. Completion date: 2002-09-30.
$3,316,291, same as above.Signed on 2000-09-30. Completion date: 2000-09-30.
$1,287,557, same as above.Signed on 2001-09-29. Completion date: 2001-09-29.
OPPORTUNITY VILLAGE ARC, INC (6300 W OAKEY BLVD) : $26,427,495 in 109 contractsfrom 1999 to 2006
Contracts for Food Services, Other Housekeeping Services, Custodial Janitorial Services, Mailing and Distribution Services, and moreby Air Force, Department of Defense, Department of Veterans Affairs, Public Buildings Service, and others Signed by year:2000: $1,660,102; 2001: $5,175,037; 2002: $5,174,160; 2003: $4,294,905; 2004: $4,987,938; 2005: $3,966,487; 2006: $436,569.
Biggest contracts:
$3,025,656 with Air Force for Food Services. Signed on 2005-10-01. Completion date: 2006-09-30.
$2,910,656, same as above.Signed on 2004-10-01. Completion date: 2004-10-31.
$2,512,051, same as above.Signed on 2003-10-01. Completion date: 2006-09-30.
$1,968,842, same as above.Signed on 2002-10-01. Completion date: 2003-04-30.
ALLIED SERVICES AND SPARES, IN (5000 W OAKEY BLVD; small business) : $1,141,344 in 17 contractsfrom 2000 to 2005
Contracts for Vehicular Brake, Steering, Axle, Wheel, and Track Components, Hose, Pipe, Tube, Lubrication, and Railing Fittings, Vehicular Power Transmission Components, Valves, Powered, and moreby Defense Logistics Agency, Army Signed by year:2000: $372,227; 2001: $226,926; 2002: $65,190; 2003: $0; 2004: $0; 2005: $477,001; 2006: $0.
Biggest contracts:
$299,185 with Defense Logistics Agency for Vehicular Brake, Steering, Axle, Wheel, and Track Components. Taking place in CA. Signed on 2005-04-29. Completion date: 2005-12-30.
$139,258, same as above.Signed on 2005-03-19. Completion date: 2006-02-15.
$99,356 with Army for Hose, Pipe, Tube, Lubrication, and Railing Fittings. Signed on 2000-08-01. Completion date: 2000-11-01.
$97,305 with Defense Logistics Agency for Hose, Pipe, Tube, Lubrication, and Railing Fittings. Signed on 2001-12-17. Completion date: 2002-01-16.
COMPUTER PROJECTION SYSTEMS LL (2870 S JONES BLVD SUITE 3; small business) : $101,753 in 7 contractsfrom 2001 to 2006
Contracts for ADP Input/Output and Storage Devices, Photographic Projection Equipment, Audio/Visual Services, Miscellaneous Electric Power and Distribution Equipment, and moreby Army, Federal Technology Service, Air Force Signed by year:2000: $0; 2001: $42,355; 2002: $14,815; 2003: $0; 2004: $0; 2005: $13,910; 2006: $30,673.
Biggest contracts:
$42,355 with Army for ADP Input/Output and Storage Devices. Signed on 2001-09-27. Completion date: 2001-10-26.
$14,815 with Federal Technology Service for ADP Input/Output and Storage Devices. Signed on 2002-10-15. Completion date: 2002-10-15.
$13,422 with Air Force for Photographic Projection Equipment. Signed on 2006-03-03. Completion date: 2006-04-14.
$10,335 with Air Force for Audio/Visual Services. Signed on 2006-03-21. Completion date: 2006-04-21.
FLOORFAX (5828 W SPRING MOUNTAIN RD; small business) : $67,658 in 3 contractsfrom 2000 to 2002
$30,762 with Air Force for Miscellaneous Engine Accessories, Nonaircraft. Signed on 2000-07-07. Completion date: 2000-08-31.
$26,900 with Air Force for Floor Coverings. Signed on 2001-09-27. Completion date: 2001-11-12.
$9,996 with Air Force for Construction of Structures and Facilities -- Office Buildings. Signed on 2002-09-28. Completion date: 2002-10-31.
CHARTER AIRLINES, INC. (3240 WESTWIND RD.; small business) : $36,500 in 2 contractsin 2005
$22,000 with Bureau of Prisoners/Federal Prison System for . Taking place in CA. Signed on 2005-07-26. Completion date: 2005-07-26.
$14,500 with Bureau of Prisoners/Federal Prison System for Passenger Air Charter Service. Taking place in CA. Signed on 2005-02-28. Completion date: 2005-02-28.
T J A , INC (5808 SPRING MOUNTAIN RD #1; small business) : $27,861 in 2 contractsin 2003
$18,174 with Army for Installation of Equipment -- Miscellaneous. Signed on 2003-05-12. Completion date: 2004-05-31.
$9,687 with Army for Underwater Sound Equipment. Signed on 2003-05-07. Completion date: 2003-06-01.
LIBERTY LOCK AND SAFE (5470 W SAHARA AVE; small business)
$4,532 with Air Force for Video Recording and Reproducing Equipment. Signed on 2005-04-20. Completion date: 2005-05-30.
THE LEARNING CENTER INC (2975 S RAINBOW STE D1; small business) : -$5,959 in 2 contractsin 2006
$0 with Air Force for Vocational/Technical. Signed on 2006-05-31. Completion date: 2004-10-31.
-$5,959, same as above.Signed on 2006-05-31. Completion date: 2004-10-31.
Top industries in this zip code by the number of employees in 2005:
Administrative and Support and Waste Management and Remediation Services: Temporary Help Services (250-499 employees: 1 establishment, 100-249 employees: 3 establishments, 50-99 employees: 1 establishment, 20-49 employees: 2 establishments, 10-19 employees: 1 establishment, 5-9 employees: 1 establishment, 1-4 employees: 4 establishments)
2002 - 2018 National Fire Incident Reporting System (NFIRS) incidents
Based on the data from the years 2002 - 2018 the average number of fire incidents per year is 76. The highest number of fires - 121 took place in 2006, and the least - 0 in 2003. The data has a growing trend.
When looking into fire subcategories, the most incidents belonged to: Outside Fires (45.0%), and Structure Fires (32.7%).
Fire incident types reported to NFIRS in Zip Code 89146


 Nearest zip codes: 89107, 89103, 89102, 89117, 89145, 89109.
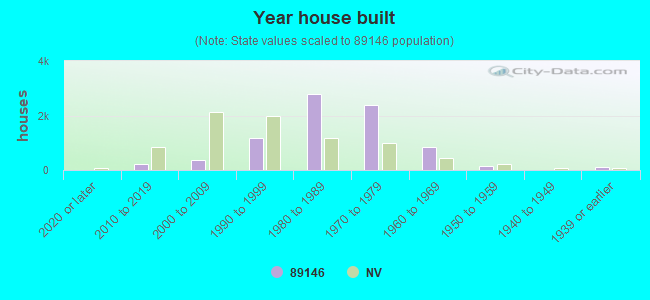


 Based on the data from the years 2002 - 2018 the average number of fire incidents per year is 76. The highest number of fires - 121 took place in 2006, and the least - 0 in 2003. The data has a growing trend.
 When looking into fire subcategories, the most incidents belonged to: Outside Fires (45.0%), and Structure Fires (32.7%).