Estimated zip code population in 2022: 37,972 Zip code population in 2010: 36,282 Zip code population in 2000: 36,180
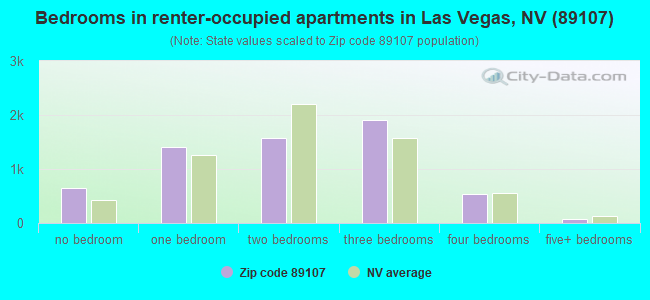
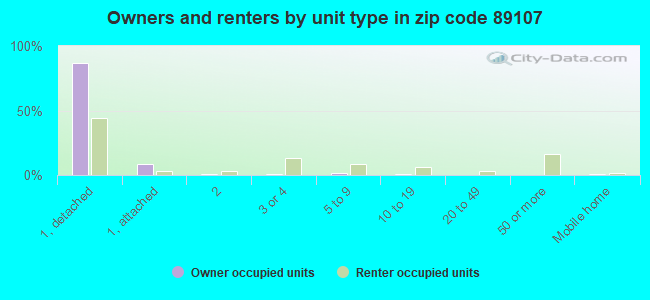
Houses and condos: 14,490 Renter-occupied apartments: 6,108
% of renters here:
46%
State:
40%
March 2022 cost of living index in zip code 89107: 99.0 (near average, U.S. average is 100)
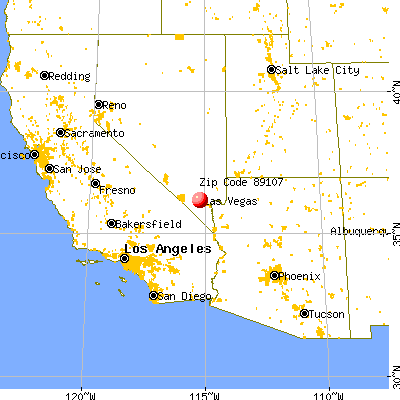
Land area: 5.5 sq. mi. Water area: 0.0 sq. mi.
Population density: 6,946 people per square mile
(high).
OSM Map
General Map
Google Map
MSN Map
OSM Map
General Map
Google Map
MSN Map
OSM Map
General Map
Google Map
MSN Map
OSM Map
General Map
Google Map
MSN Map
Please wait while loading the map...
Real estate property taxes paid for housing units in 2022:
This zip code:
0.3% ($997)
Nevada:
0.4% ($1,889)
Median real estate property taxes paid for housing units with mortgages in 2022: $1,037 (0.3%) Median real estate property taxes paid for housing units with no mortgage in 2022: $958 (0.3%)
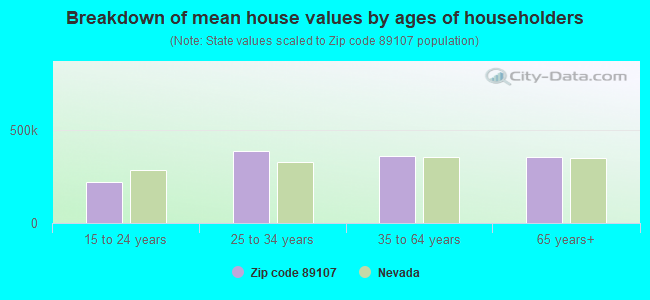
Estimated median house/condo value in 2022: $317,826
89107:
$317,826
Nevada:
$434,700
According to our research of Nevada and other state lists, there were 138 registered sex offenders living in 89107 zip code as of April 27, 2024. The ratio of all residents to sex offenders in zip code 89107 is 279 to 1. The ratio of registered sex offenders to all residents in this zip code is near the state average.
Median resident age:
This zip code:
36.8 years
Nevada median age:
39.0 years
Average household size:
This zip code:
2.9 people
Nevada:
2.6 people
Averages for the 2020 tax year for zip code 89107, filed in 2021:
Average Adjusted Gross Income (AGI) in 2020: $61,198 (Individual Income Tax Returns)
Here:
$61,198
State:
$78,964
Salary/wage: $37,910 (reported on 81.9% of returns)
Here:
$37,910
State:
$54,472
(% of AGI for various income ranges: 1239.5% for AGIs below $25k, 3414.1% for AGIs $25k-50k, 6378.4% for AGIs $50k-75k, 9370.0% for AGIs $75k-100k, 16240.9% for AGIs $100k-200k, 113850.0% for AGIs over 200k)
Taxable interest for individuals: $4,424 (reported on 15.0% of returns)
This zip code:
$4,424
Nevada:
$3,521
(% of AGI for various income ranges: 9.2% for AGIs below $25k, 9.7% for AGIs $25k-50k, 35.1% for AGIs $50k-75k, 75.1% for AGIs $75k-100k, 250.0% for AGIs $100k-200k, 10768.9% for AGIs over 200k)
Ordinary dividends: $18,977 (reported on 7.6% of returns)
Here:
$18,977
State:
$13,390
(% of AGI for various income ranges: 8.1% for AGIs below $25k, 15.1% for AGIs $25k-50k, 53.4% for AGIs $50k-75k, 127.6% for AGIs $75k-100k, 601.7% for AGIs $100k-200k, 24871.1% for AGIs over 200k)
Net capital gain/loss in AGI: +$69,305 (reported on 8.6% of returns)
Here:
+$69,305
State:
+$63,025
(% of AGI for various income ranges: 6.9% for AGIs below $25k, 15.6% for AGIs $25k-50k, 83.1% for AGIs $50k-75k, 267.7% for AGIs $75k-100k, 1282.6% for AGIs $100k-200k, 118483.3% for AGIs over 200k)
Profit/loss from business: +$7,596 (reported on 18.3% of returns)
Here:
+$7,596
State:
+$11,500
(% of AGI for various income ranges: 107.4% for AGIs below $25k, 114.4% for AGIs $25k-50k, 248.6% for AGIs $50k-75k, 293.1% for AGIs $75k-100k, 1119.6% for AGIs $100k-200k, 3534.4% for AGIs over 200k)
Taxable individual retirement arrangement distribution: $20,114 (reported on 3.7% of returns)
89107:
$20,114
Nevada:
$23,628
(% of AGI for various income ranges: 24.5% for AGIs below $25k, 34.1% for AGIs $25k-50k, 98.4% for AGIs $50k-75k, 299.6% for AGIs $75k-100k, 712.6% for AGIs $100k-200k, 4535.6% for AGIs over 200k)
Self-employed (Keogh) retirement plans: $23,460 (reported on 0.3% of returns)
89107:
$23,460
Nevada:
$26,634
(% of AGI for various income ranges: 7.5% for AGIs $25k-50k, 865.6% for AGIs over 200k)
Total itemized deductions: $50,179 (reported on 4.3% of returns)
Here:
$50,179
State:
$44,173
(% of AGI for various income ranges: 34.5% for AGIs below $25k, 75.9% for AGIs $25k-50k, 229.0% for AGIs $50k-75k, 377.9% for AGIs $75k-100k, 1174.3% for AGIs $100k-200k, 26661.1% for AGIs over 200k)
Charity contributions: $21,451 (reported on 3.2% of returns)
Here:
$21,451
State:
$12,589
(% of AGI for various income ranges: 2.5% for AGIs below $25k, 10.6% for AGIs $25k-50k, 31.3% for AGIs $50k-75k, 60.1% for AGIs $75k-100k, 218.7% for AGIs $100k-200k, 12035.6% for AGIs over 200k)
Taxes paid: $5,321 (reported on 4.1% of returns)
89107:
$5,321
State:
$6,112
(% of AGI for various income ranges: 4.6% for AGIs below $25k, 12.8% for AGIs $25k-50k, 37.9% for AGIs $50k-75k, 54.4% for AGIs $75k-100k, 163.9% for AGIs $100k-200k, 1670.0% for AGIs over 200k)
Earned income credit: $2,356 (reported on 24.7% of returns)
Here:
$2,356
State:
$2,214
(% of AGI for various income ranges: 116.2% for AGIs below $25k, 83.0% for AGIs $25k-50k, 1.4% for AGIs $50k-75k)
Percentage of individuals using paid preparers for their 2020 taxes: 91.9%
Here:
92%
State:
93%
(% for various income ranges: 90.9% for AGIs below $25k, 93.8% for AGIs $25k-50k, 91.5% for AGIs $50k-75k, 91.8% for AGIs $75k-100k, 90.2% for AGIs $100k-200k, 87.8% for AGIs over 200k)
Averages for the 2012 tax year for zip code 89107, filed in 2013:
Average Adjusted Gross Income (AGI) in 2012: $48,972 (Individual Income Tax Returns)
Here:
$48,972
State:
$61,164
Salary/wage: $33,790 (reported on 83.4% of returns)
Here:
$33,790
State:
$45,924
(% of AGI for various income ranges: 78.6% for AGIs below $25k, 85.8% for AGIs $25k-50k, 77.8% for AGIs $50k-75k, 71.3% for AGIs $75k-100k, 63.9% for AGIs $100k-200k, 18.6% for AGIs over 200k)
Taxable interest for individuals: $4,788 (reported on 16.5% of returns)
This zip code:
$4,788
Nevada:
$3,137
(% of AGI for various income ranges: 0.5% for AGIs below $25k, 0.2% for AGIs $25k-50k, 0.6% for AGIs $50k-75k, 0.6% for AGIs $75k-100k, 1.1% for AGIs $100k-200k, 3.7% for AGIs over 200k)
Ordinary dividends: $11,871 (reported on 8.7% of returns)
Here:
$11,871
State:
$11,762
(% of AGI for various income ranges: 1.8% for AGIs below $25k, 0.8% for AGIs $25k-50k, 0.9% for AGIs $50k-75k, 1.1% for AGIs $75k-100k, 2.4% for AGIs $100k-200k, 3.6% for AGIs over 200k)
Net capital gain/loss in AGI: +$32,105 (reported on 7.7% of returns)
Here:
+$32,105
State:
+$33,127
(% of AGI for various income ranges: 0.2% for AGIs $25k-50k, 0.2% for AGIs $50k-75k, 0.7% for AGIs $75k-100k, 2.3% for AGIs $100k-200k, 13.6% for AGIs over 200k)
Profit/loss from business: +$9,165 (reported on 14.2% of returns)
Here:
+$9,165
State:
+$12,567
(% of AGI for various income ranges: 7.8% for AGIs below $25k, 2.1% for AGIs $25k-50k, 1.6% for AGIs $50k-75k, 2.4% for AGIs $75k-100k, 3.7% for AGIs $100k-200k, 1.1% for AGIs over 200k)
Taxable individual retirement arrangement distribution: $17,065 (reported on 4.9% of returns)
89107:
$17,065
Nevada:
$20,808
(% of AGI for various income ranges: 1.7% for AGIs below $25k, 0.8% for AGIs $25k-50k, 1.9% for AGIs $50k-75k, 2.5% for AGIs $75k-100k, 3.3% for AGIs $100k-200k, 1.7% for AGIs over 200k)
Self-employment retirement plans: $20,933 (reported on 0.2% of returns)
89107:
$20,933
Nevada:
$22,197
Total itemized deductions: $22,268 (16% of AGI, reported on 17.9% of returns)
Here:
$22,268
State:
$26,148
Here:
15.8% of AGI
State:
20.0% of AGI
(% of AGI for various income ranges: 4.8% for AGIs below $25k, 8.3% for AGIs $25k-50k, 11.0% for AGIs $50k-75k, 11.0% for AGIs $75k-100k, 13.3% for AGIs $100k-200k, 6.2% for AGIs over 200k)
Charity contributions: $4,067 (reported on 13.9% of returns)
Here:
$4,067
State:
$4,329
(% of AGI for various income ranges: 0.3% for AGIs below $25k, 0.8% for AGIs $25k-50k, 1.3% for AGIs $50k-75k, 1.5% for AGIs $75k-100k, 2.1% for AGIs $100k-200k, 1.3% for AGIs over 200k)
Taxes paid: $4,878 (reported on 17.3% of returns)
89107:
$4,878
State:
$5,116
(% of AGI for various income ranges: 0.7% for AGIs below $25k, 1.4% for AGIs $25k-50k, 1.6% for AGIs $50k-75k, 1.8% for AGIs $75k-100k, 2.6% for AGIs $100k-200k, 2.1% for AGIs over 200k)
Earned income credit: $2,479 (reported on 27.0% of returns)
Here:
$2,479
State:
$2,279
(% of AGI for various income ranges: 7.5% for AGIs below $25k, 1.5% for AGIs $25k-50k)
Percentage of individuals using paid preparers for their 2012 taxes: 60.5%
Here:
60%
State:
55%
(% for various income ranges: 59.5% for AGIs below $25k, 61.1% for AGIs $25k-50k, 59.3% for AGIs $50k-75k, 58.2% for AGIs $75k-100k, 63.9% for AGIs $100k-200k, 84.6% for AGIs over 200k)
Averages for the 2004 tax year for zip code 89107, filed in 2005:
Average Adjusted Gross Income (AGI) in 2004: $57,295 (Individual Income Tax Returns)
Here:
$57,295
State:
$58,367
Salary/wage: $35,005 (reported on 86.3% of returns)
Here:
$35,005
State:
$42,695
(% of AGI for various income ranges: 165.9% for AGIs below $10k, 83.7% for AGIs $10k-25k, 87.2% for AGIs $25k-50k, 82.7% for AGIs $50k-75k, 79.0% for AGIs $75k-100k, 20.0% for AGIs over 100k)
Taxable interest for individuals: $6,479 (reported on 25.7% of returns)
This zip code:
$6,479
Nevada:
$3,867
(% of AGI for various income ranges: 7.6% for AGIs below $10k, 1.1% for AGIs $10k-25k, 0.8% for AGIs $25k-50k, 1.1% for AGIs $50k-75k, 1.1% for AGIs $75k-100k, 4.7% for AGIs over 100k)
Taxable dividends: $8,698 (reported on 11.9% of returns)
Here:
$8,698
State:
$5,770
(% of AGI for various income ranges: 3.9% for AGIs below $10k, 0.6% for AGIs $10k-25k, 0.5% for AGIs $25k-50k, 0.7% for AGIs $50k-75k, 0.8% for AGIs $75k-100k, 3.0% for AGIs over 100k)
Net capital gain/loss: +$137,384 (reported on 10.7% of returns)
Here:
+$137,384
State:
+$50,644
(% of AGI for various income ranges: -1.2% for AGIs below $10k, 0.2% for AGIs $10k-25k, 0.3% for AGIs $25k-50k, 0.9% for AGIs $50k-75k, 2.8% for AGIs $75k-100k, 50.5% for AGIs over 100k)
Profit/loss from business: +$13,000 (reported on 10.7% of returns)
Here:
+$13,000
State:
+$13,618
(% of AGI for various income ranges: 15.3% for AGIs below $10k, 4.0% for AGIs $10k-25k, 1.3% for AGIs $25k-50k, 1.1% for AGIs $50k-75k, 1.3% for AGIs $75k-100k, 2.9% for AGIs over 100k)
IRA payment deduction: $2,895 (reported on 1.4% of returns)
89107:
$2,895
Nevada:
$3,054
(% of AGI for various income ranges: 0.7% for AGIs below $10k, 0.1% for AGIs $10k-25k, 0.1% for AGIs $25k-50k, 0.1% for AGIs $50k-75k, 0.1% for AGIs $75k-100k, 0.0% for AGIs over 100k)
Self-employed pension: $13,765 (reported on 0.2% of returns)
Here:
$13,765
Nevada:
$16,706
Total itemized deductions: $20,603 (17% of AGI, reported on 32.5% of returns)
Here:
$20,603
State:
$22,990
Here:
17.4% of AGI
State:
21.8% of AGI
(% of AGI for various income ranges: 25.9% for AGIs below $10k, 10.9% for AGIs $10k-25k, 15.2% for AGIs $25k-50k, 16.1% for AGIs $50k-75k, 16.2% for AGIs $75k-100k, 8.4% for AGIs over 100k)
Charity contributions deductions: $3,691 (3% of AGI, reported on 27.9% of returns)
Here:
$3,691
State:
$3,443
Here:
3.2% of AGI
State:
3.1% of AGI
(% of AGI for various income ranges: 1.1% for AGIs below $10k, 0.9% for AGIs $10k-25k, 1.5% for AGIs $25k-50k, 1.8% for AGIs $50k-75k, 2.3% for AGIs $75k-100k, 2.0% for AGIs over 100k)
Total tax: $10,108 (reported on 69.0% of returns)
89107:
$10,108
State:
$10,585
(% of AGI for various income ranges: 4.9% for AGIs below $10k, 3.5% for AGIs $10k-25k, 5.8% for AGIs $25k-50k, 8.2% for AGIs $50k-75k, 10.3% for AGIs $75k-100k, 17.7% for AGIs over 100k)
Earned income credit: $1,720 (reported on 20.0% of returns)
Here:
$1,720
State:
$1,676
Percentage of individuals using paid preparers for their 2004 taxes: 62.6%
Here:
63%
State:
60%
(% for various income ranges: 56.3% for AGIs below $10k, 63.7% for AGIs $10k-25k, 63.3% for AGIs $25k-50k, 61.2% for AGIs $50k-75k, 63.2% for AGIs $75k-100k, 76.3% for AGIs over 100k)
Likely homosexual households (counted as self-reported same-sex unmarried-partner households)
Lesbian couples: 0.1% of all households
Gay men: 0.1% of all households
Household received Food Stamps/SNAP in the past 12 months: 2,899 Household did not receive Food Stamps/SNAP in the past 12 months: 10,499
Women who had a birth in the past 12 months: 646 (562 now married, 116 unmarried) Women who did not have a birth in the past 12 months: 8,152 (2,589 now married, 5,589 unmarried)
Housing units in zip code 89107 with a mortgage: 4,400 (239 second mortgage, 8 home equity loan, 186 both second mortgage and home equity loan) Houses without a mortgage: 33
Median monthly owner costs for units with a mortgage: $1,358 Median monthly owner costs for units without a mortgage: $447
Residents with income below the poverty level in 2022:
This zip code:
15.5%
Whole state:
12.5%
Residents with income below 50% of the poverty level in 2022:
This zip code:
7.6%
Whole state:
5.9%
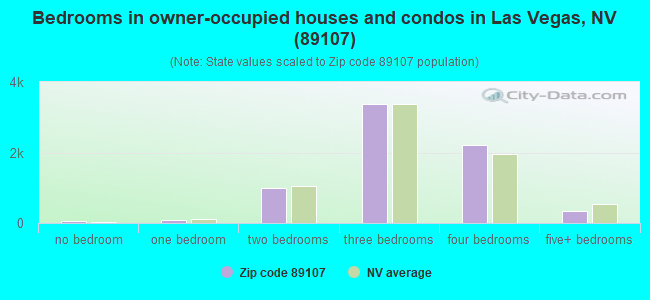
Median number of rooms in houses and condos:
Here:
5.9
State:
6.0
Median number of rooms in apartments:
Here:
4.3
State:
4.2
Notable locations in this zip code not listed on our city pages
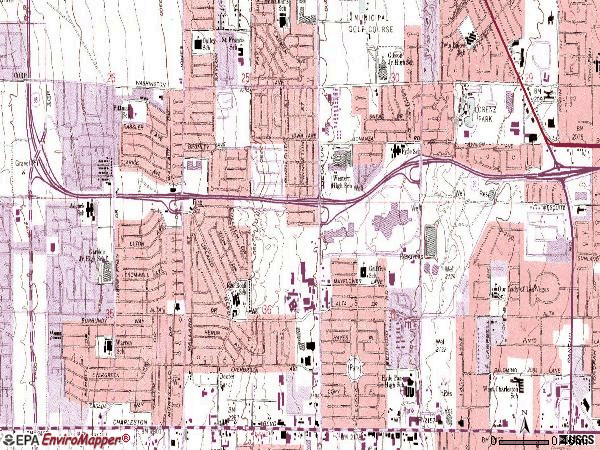
Notable locations in zip code 89107: Fremont Plaza (A), Eagle Plaza (B), Nevada State Museum Historical Society (C), Las Vegas Fire and Rescue Station 6 (D), Las Vegas Fire and Rescue Station 5 (E), Charleston Neighborhood Preservation Society (F), Lorenzi Adaptive Recreation Center (G), Derfelt Senior Center (H), Mirabelli Community Center (I). Display/hide their locations on the map
Shopping Centers: The Meadows Shopping Center (1), Loma Vista Shopping Center (2), Decatur Crossing Shopping Center (3), Torrey Pines Shopping Center (4), Charleston Heights Shopping Center (5). Display/hide their locations on the map
Churches in zip code 89107 include: Upland Bible Church (A), The Church of Jesus Christ of Latter Day Saints (B), Grace Evangelical Free Church (C), City of Refuge Church of God in Christ (D), Christ Lutheran Church (E), All Saints Episcopal Church (F), Redrock Baptist Church (G). Display/hide their locations on the map
Parks in zip code 89107 include: Adcock Playground (1), Cragin Park (2), Cragin Pool (3), Essex Park (4), Fyfe Playground (5), Garside Community School Park (6), Garside Pool (7), Griffith Park (8), Mirabelli Park (9). Display/hide their locations on the map
Tourist attractions (not listed on the city page) : Cowboy Catering Services (Tours & Charters; 800 North Rainbow Boulevard # B), Latter Day Tours (Tours & Charters; 5404 Alpine Place).
4,002 married couples with children.
3,020 single-parent households (1,182 men, 1,838 women).
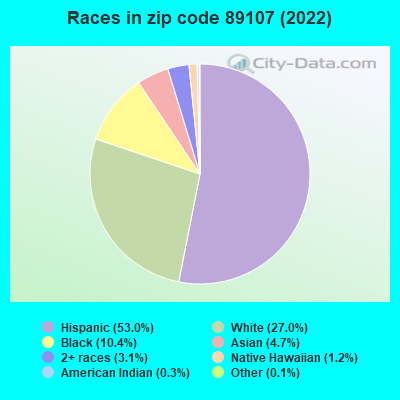
51.7% of residents of 89107 zip code speak English at home.
42.7% of residents speak Spanish at home (62% very well, 18% well, 15% not well, 5% not at all).
2.0% of residents speak other Indo-European language at home (50% very well, 26% well, 23% not well, 1% not at all).
3.5% of residents speak Asian or Pacific Island language at home (56% very well, 31% well, 11% not well, 2% not at all).
0.3% of residents speak other language at home (94% very well, 6% well).
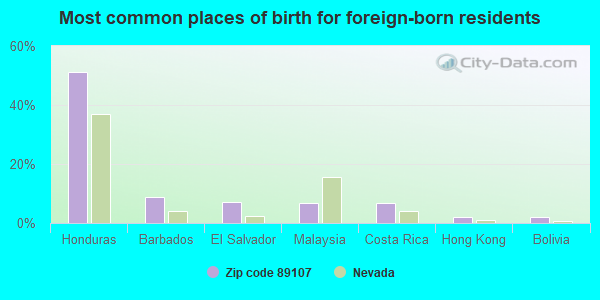
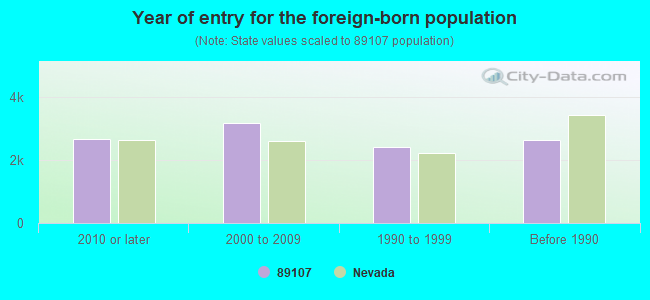
Foreign born population: 10,150 (26.7%) (39.5% of them are naturalized citizens)
Major facilities with environmental interests located in this zip code:
FRIENDLY FORD (660 NORTH DECATUR BOULEVARD in LAS VEGAS, NV)
(Resource Conservation and Recovery Act (tracking hazardous waste)) Small Quantity Generators, between 100 kg and 1000 kg of hazardous waste/month (Resource Conservation and Recovery Act (tracking hazardous waste)) Business NAICS classification: GENERAL AUTOMOTIVE REPAIR. Organizations: DOS CORP (CONTACT/OWNER)
Alternative names: FRIENDLY FORD BODY SHOP, FRIENDLY FORD SERVICE, FRIENDLY FORD USED CAR DEPT
ROBERT O GIBSON JUNIOR HIGH SCHOOL (3900 W. WASHINGTON in LAS VEGAS, NV)
(Geographic Names Information System) COMPLIANCE ACTIVITY (Tracking inspections of insecticide, fungicide, and rodenticide, and toxic substances) (National Center for Education Statistics) - STATE ID-02-310 Organizations: CLARK CO SCH DIST (SCHOOL DISTRICT)
Alternative names: GIBSON, ROBERT MIDSCH, ROBERT O GIBSON JR HIGH SCHOOL
HYDE PARK JUNIOR HIGH SCHOOL (900 HINSON ST. in LAS VEGAS, NV)
(Geographic Names Information System) COMPLIANCE ACTIVITY (Tracking inspections of insecticide, fungicide, and rodenticide, and toxic substances) (National Center for Education Statistics) - STATE ID-02-303 Organizations: CLARK CO SCH DIST (SCHOOL DISTRICT)
Alternative names: HYDE PARK JR HIGH SCHOOL, HYDE PARK MIDSCH
FRANK F GARSIDE JUNIOR HIGH SCHOOL (300 S. TORREY PINES in LAS VEGAS, NV)
(Geographic Names Information System) COMPLIANCE ACTIVITY (Tracking inspections of insecticide, fungicide, and rodenticide, and toxic substances) (National Center for Education Statistics) - STATE ID-02-302 Organizations: CLARK CO SCH DIST (SCHOOL DISTRICT)
Alternative names: FRANK F GARSIDE JR HIGH SCHOOL, GARSIDE, FRANK MIDSCH
RED ROCK ELEMENTARY SCHOOL (408 UPLAND BLVD. in LAS VEGAS, NV)
(Geographic Names Information System) (National Center for Education Statistics) - STATE ID-02-235 Organizations: CLARK CO SCH DIST (SCHOOL DISTRICT)
VAIL PITTMAN ELEMENTARY SCHOOL (6333 FARGO AVE. in LAS VEGAS, NV)
(Geographic Names Information System) (National Center for Education Statistics) - STATE ID-02-244 Organizations: CLARK CO SCH DIST (SCHOOL DISTRICT)
Alternative names: PITTMAN, VAIL ELEM
E W GRIFFITH ELEMENTARY SCHOOL (324 ESSEX DRIVE in LAS VEGAS, NV)
(Geographic Names Information System) (National Center for Education Statistics) - STATE ID-02-208 Organizations: CLARK CO SCH DIST (SCHOOL DISTRICT)
Alternative names: GRIFFITH, E W ELEM
RUTH FYFE ELEMENTARY SCHOOL (4101 WEST BONANZA in LAS VEGAS, NV)
(Geographic Names Information System) (National Center for Education Statistics) - STATE ID-02-240 Organizations: CLARK CO SCH DIST (SCHOOL DISTRICT)
Alternative names: FYFE, RUTH ELEM
ROSE WARREN ELEMENTARY SCHOOL (6451 BRANDYWINE WAY in LAS VEGAS, NV)
(Geographic Names Information System) (National Center for Education Statistics) - STATE ID-02-238 Organizations: CLARK CO SCH DIST (SCHOOL DISTRICT)
Alternative names: WARREN, ROSE ELEM
HOWARD WASDEN ELEMENTARY SCHOOL (2831 PALOMINO LANE in LAS VEGAS, NV)
(Geographic Names Information System) (National Center for Education Statistics) - STATE ID-02-247 Organizations: CLARK CO SCH DIST (SCHOOL DISTRICT)
Alternative names: WASDEN, HOWARD ELEM
ECONO LUBE N TUNE 109 (4701 MEADOWS LN in LAS VEGAS, NV)
(Integrated Compliance Information System) - ICIS-09-1997-0050, FORMAL ENFORCEMENT ACTION Conditionally Exempt Small Quantity Generators, less than 100 kg/month of hazardous waste (Resource Conservation and Recovery Act (tracking hazardous waste)) Business NAICS classification: GENERAL AUTOMOTIVE REPAIR. Alternative names: ECONO LUBE NTUNE
ADCOCK, O. K. ELEM (100 NEWCOMER STREET in LAS VEGAS, NV)
(National Center for Education Statistics) - STATE ID-02-231 Organizations: CLARK CO SCH DIST (SCHOOL DISTRICT)
5 STAR AUTO SALE (1801 E FREMONT in LAS VEGAS, NV)
(Integrated Compliance Information System) - ICIS-09-1997-0102, FORMAL ENFORCEMENT ACTION Business SIC classification: GENERAL AUTOMOTIVE REPAIR SHOPS
Housing units lacking complete plumbing facilities: 0.9% Housing units lacking complete kitchen facilities: 1.4%
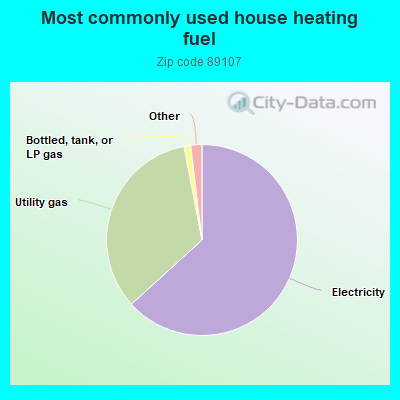
63.2%Electricity
33.7%Utility gas
1.1%Bottled, tank, or LP gas
0.8%No fuel used
0.6%Solar energy
Population in 1990: 32,628. Population change in the 1990s: +3,552 (+10.9%).
Place of birth for U.S.-born residents:
This state: 11,455
Northeast: 2,109
Midwest: 2,517
South: 1,999
West: 9,114
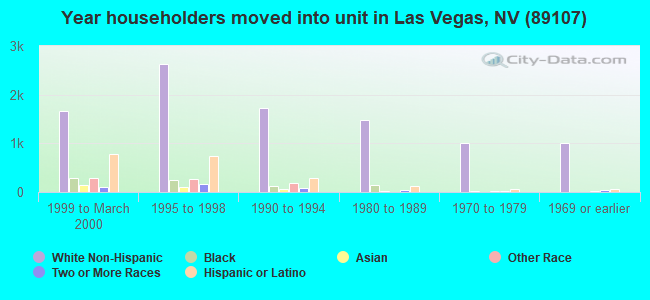
49% of the 89107 zip code residents lived in the same house 5 years ago. Out of people who lived in different houses, 62% lived in this county. Out of people who lived in different counties, 50% lived in Nevada.
91% of the 89107 zip code residents lived in the same house 1 year ago. Out of people who lived in different houses, 70% moved from this county. Out of people who lived in different houses, 6% moved from different county within same state. Out of people who lived in different houses, 22% moved from different state. Out of people who lived in different houses, 6% moved from abroad.
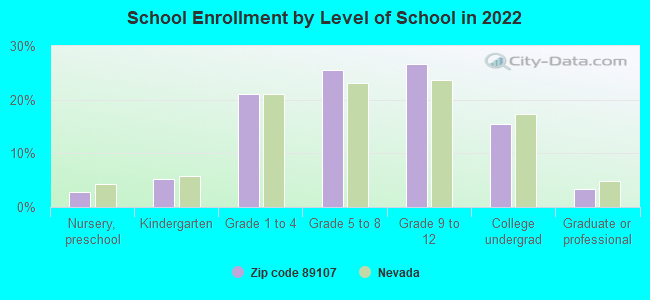
Private vs. public school enrollment:
Students in private schools in grades 1 to 8 (elementary and middle school): 506
Here:
13.0%
Nevada:
12.9%
Students in private schools in grades 9 to 12 (high school): 181
Here:
8.2%
Nevada:
6.9%
Students in private undergraduate colleges: 257
Here:
20.5%
Nevada:
16.0%
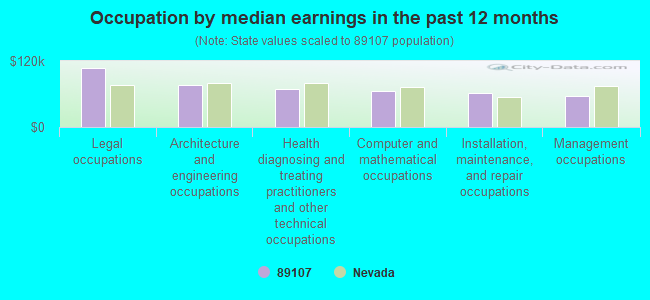
Occupation by median earnings in the past 12 months ($)
106,925Legal occupations
76,795Architecture and engineering occupations
69,015Health diagnosing and treating practitioners and other technical occupations
65,765Computer and mathematical occupations
62,613Installation, maintenance, and repair occupations
57,073Management occupations
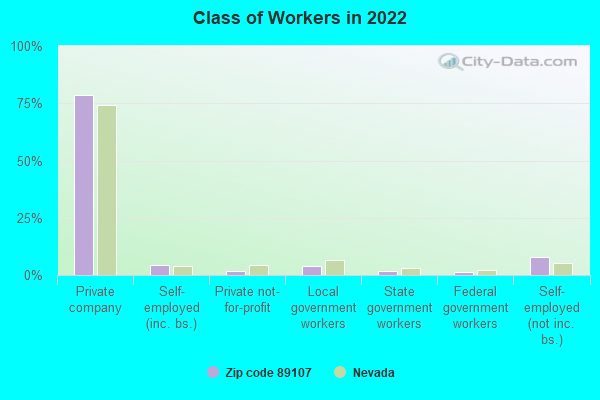
Companies with federal contracts located in this zip code:
LINE GROUP INC (800 N RAINBOW BLVD STE 208 in LAS VEGAS, NV; small business) : $167,216 in 12 contractsfrom 2004 to 2006
Contracts for Textile Fabrics, Office Supplies, Signs, Advertising Displays, and Identification Plates, Miscellaneous Furniture and Fixtures, and moreby Army, Air Force Signed by year:2000: $0; 2001: $0; 2002: $0; 2003: $0; 2004: $5,739; 2005: $37,257; 2006: $124,220.
Biggest contracts:
$95,204 with Army for Textile Fabrics. Signed on 2006-03-09. Completion date: 2006-03-01.
$23,670 with Army for Office Supplies. Signed on 2005-08-12. Completion date: 2005-08-31.
$12,575 with Air Force for Signs, Advertising Displays, and Identification Plates. Signed on 2006-04-20. Completion date: 2006-06-01.
$6,371 with Air Force for Miscellaneous Furniture and Fixtures. Signed on 2006-05-23. Completion date: 2006-06-09.
D & M ONE STOP CYCLE SCHOOL (848 N RAINBOW BLVD #423 in LAS VEGAS, NV; small business) : $84,982 in 4 contractsfrom 2004 to 2005
$40,000 with Air Force for Other Education and Training Services. Signed on 2005-11-02. Completion date: 2006-09-30.
$24,982, same as above.Signed on 2004-10-01. Completion date: 2006-09-30.
$15,000, same as above.Signed on 2005-07-08. Completion date: 2005-09-30.
$5,000, same as above.Signed on 2005-08-02. Completion date: 2005-09-30.
SEACLIFF SALES, LLC (505 STANFORD ST in LAS VEGAS, NV; small business) : $36,053 in 5 contractsfrom 2004 to 2005
Contracts for Engine Fuel System Components, Nonaircraft, Hose and Flexible Tubing, Nuts and Washers, Hose, Pipe, Tube, Lubrication, and Railing Fittings, and moreby Defense Logistics Agency Signed by year:2000: $0; 2001: $0; 2002: $0; 2003: $0; 2004: $32,048; 2005: $4,005; 2006: $0.
Biggest contracts:
$21,115 with Defense Logistics Agency for Engine Fuel System Components, Nonaircraft. Taking place in NJ. Signed on 2004-10-15. Completion date: 2004-12-12.
$4,841 with Defense Logistics Agency for Hose and Flexible Tubing. Taking place in TX. Signed on 2004-12-03. Completion date: 2005-03-03.
$4,005 with Defense Logistics Agency for Nuts and Washers. Taking place in CA. Signed on 2005-01-06. Completion date: 2005-03-08.
$3,416 with Defense Logistics Agency for Hose, Pipe, Tube, Lubrication, and Railing Fittings. Taking place in MI. Signed on 2004-11-24. Completion date: 2005-01-29.
Top industries in this zip code by the number of employees in 2005:
Accommodation and Food Services: Casino Hotels (500-999 employees: 1 establishment)
2002 - 2018 National Fire Incident Reporting System (NFIRS) incidents
According to the data from the years 2002 - 2018 the average number of fires per year is 119. The highest number of fires - 225 took place in 2017, and the least - 0 in 2003. The data has a rising trend.
When looking into fire subcategories, the most incidents belonged to: Outside Fires (48.9%), and Structure Fires (29.4%).
Fire incident types reported to NFIRS in Zip Code 89107


 Nearest zip codes: 89146, 89102, 89108, 89106, 89109, 89103.


 According to the data from the years 2002 - 2018 the average number of fires per year is 119. The highest number of fires - 225 took place in 2017, and the least - 0 in 2003. The data has a rising trend.
 When looking into fire subcategories, the most incidents belonged to: Outside Fires (48.9%), and Structure Fires (29.4%).