Estimated zip code population in 2022: 77,272
Zip code population in 2010: 70,123
Zip code population in 2000: 66,558
Houses and condos: 29,072
Renter-occupied apartments: 13,782
% of renters here:
51%State:
40%
March 2022 cost of living index in zip code 89108: 98.6
(near average, U.S. average is 100)
Land area: 9.0
sq. mi.
Water area: 0.0
sq. mi.
Population density: 8,599 people per square mile (high).
OSM Map
General Map
Google Map
MSN Map
OSM Map
General Map
Google Map
MSN Map
OSM Map
General Map
Google Map
MSN Map
OSM Map
General Map
Google Map
MSN Map
Please wait while loading the map...
Real estate property taxes paid for housing units in 2022:
This zip code:
0.4% ($1,137)Nevada:
0.4% ($1,889)
Median real estate property taxes paid for housing units with mortgages in 2022: $1,145 (0.3%)
Median real estate property taxes paid for housing units with no mortgage in 2022: $1,113 (0.4%)
Profiles of local businesses
Business Search - 14 Million verified businesses
Males: 38,961 Females: 38,310
For population 25 years and over in 89108:
High school or higher: 79.3%Bachelor's degree or higher: 14.2%Graduate or professional degree: 3.7%Unemployed: 7.7%Mean travel time to work (commute): 26.5 minutes
For population 15 years and over in 89108:
Never married: 40.7%Now married: 39.0%Separated: 1.9%Widowed: 4.9%Divorced: 13.5%
Zip code 89108 compared to state average:
Length of stay since moving in significantly above state average. Percentage of population with a bachelor's degree or higher below state average. 38,595 49.9% Hispanic or Latino 21,913 28.4% White 10,084 13.1% Black 2,954 3.8% Asian 2,416 3.1% Two or more races 688 0.9% Native Hawaiian and Other 513 0.7% Some other race 105 0.1% American Indian
Data:
Median household income ($)
Median household income (% change since 2000)
Household income diversity
Ratio of average income to average house value (%)
Ratio of average income to average rent
Median household income ($) - White
Median household income ($) - Black or African American
Median household income ($) - Asian
Median household income ($) - Hispanic or Latino
Median household income ($) - American Indian and Alaska Native
Median household income ($) - Multirace
Median household income ($) - Other Race
Median household income for houses/condos with a mortgage ($)
Median household income for apartments without a mortgage ($)
Races - White alone (%)
Races - White alone (% change since 2000)
Races - Black alone (%)
Races - Black alone (% change since 2000)
Races - American Indian alone (%)
Races - American Indian alone (% change since 2000)
Races - Asian alone (%)
Races - Asian alone (% change since 2000)
Races - Hispanic (%)
Races - Hispanic (% change since 2000)
Races - Native Hawaiian and Other Pacific Islander alone (%)
Races - Native Hawaiian and Other Pacific Islander alone (% change since 2000)
Races - Two or more races (%)
Races - Two or more races (% change since 2000)
Races - Other race alone (%)
Races - Other race alone (% change since 2000)
Racial diversity
Unemployment (%)
Unemployment (% change since 2000)
Unemployment (%) - White
Unemployment (%) - Black or African American
Unemployment (%) - Asian
Unemployment (%) - Hispanic or Latino
Unemployment (%) - American Indian and Alaska Native
Unemployment (%) - Multirace
Unemployment (%) - Other Race
Population density (people per square mile)
Population - Males (%)
Population - Females (%)
Population - Males (%) - White
Population - Males (%) - Black or African American
Population - Males (%) - Asian
Population - Males (%) - Hispanic or Latino
Population - Males (%) - American Indian and Alaska Native
Population - Males (%) - Multirace
Population - Males (%) - Other Race
Population - Females (%) - White
Population - Females (%) - Black or African American
Population - Females (%) - Asian
Population - Females (%) - Hispanic or Latino
Population - Females (%) - American Indian and Alaska Native
Population - Females (%) - Multirace
Population - Females (%) - Other Race
Coronavirus confirmed cases (Apr 27, 2024)
Deaths caused by coronavirus (Apr 27, 2024)
Coronavirus confirmed cases (per 100k population) (Apr 27, 2024)
Deaths caused by coronavirus (per 100k population) (Apr 27, 2024)
Daily increase in number of cases (Apr 27, 2024)
Weekly increase in number of cases (Apr 27, 2024)
Cases doubled (in days) (Apr 27, 2024)
Hospitalized patients (Apr 18, 2022)
Negative test results (Apr 18, 2022)
Total test results (Apr 18, 2022)
COVID Vaccine doses distributed (per 100k population) (Sep 19, 2023)
COVID Vaccine doses administered (per 100k population) (Sep 19, 2023)
COVID Vaccine doses distributed (Sep 19, 2023)
COVID Vaccine doses administered (Sep 19, 2023)
Likely homosexual households (%)
Likely homosexual households (% change since 2000)
Likely homosexual households - Lesbian couples (%)
Likely homosexual households - Lesbian couples (% change since 2000)
Likely homosexual households - Gay men (%)
Likely homosexual households - Gay men (% change since 2000)
Cost of living index
Median gross rent ($)
Median contract rent ($)
Median monthly housing costs ($)
Median house or condo value ($)
Median house or condo value ($ change since 2000)
Mean house or condo value by units in structure - 1, detached ($)
Mean house or condo value by units in structure - 1, attached ($)
Mean house or condo value by units in structure - 2 ($)
Mean house or condo value by units in structure by units in structure - 3 or 4 ($)
Mean house or condo value by units in structure - 5 or more ($)
Mean house or condo value by units in structure - Boat, RV, van, etc. ($)
Mean house or condo value by units in structure - Mobile home ($)
Median house or condo value ($) - White
Median house or condo value ($) - Black or African American
Median house or condo value ($) - Asian
Median house or condo value ($) - Hispanic or Latino
Median house or condo value ($) - American Indian and Alaska Native
Median house or condo value ($) - Multirace
Median house or condo value ($) - Other Race
Median resident age
Resident age diversity
Median resident age - Males
Median resident age - Females
Median resident age - White
Median resident age - Black or African American
Median resident age - Asian
Median resident age - Hispanic or Latino
Median resident age - American Indian and Alaska Native
Median resident age - Multirace
Median resident age - Other Race
Median resident age - Males - White
Median resident age - Males - Black or African American
Median resident age - Males - Asian
Median resident age - Males - Hispanic or Latino
Median resident age - Males - American Indian and Alaska Native
Median resident age - Males - Multirace
Median resident age - Males - Other Race
Median resident age - Females - White
Median resident age - Females - Black or African American
Median resident age - Females - Asian
Median resident age - Females - Hispanic or Latino
Median resident age - Females - American Indian and Alaska Native
Median resident age - Females - Multirace
Median resident age - Females - Other Race
Commute - mean travel time to work (minutes)
Travel time to work - Less than 5 minutes (%)
Travel time to work - Less than 5 minutes (% change since 2000)
Travel time to work - 5 to 9 minutes (%)
Travel time to work - 5 to 9 minutes (% change since 2000)
Travel time to work - 10 to 19 minutes (%)
Travel time to work - 10 to 19 minutes (% change since 2000)
Travel time to work - 20 to 29 minutes (%)
Travel time to work - 20 to 29 minutes (% change since 2000)
Travel time to work - 30 to 39 minutes (%)
Travel time to work - 30 to 39 minutes (% change since 2000)
Travel time to work - 40 to 59 minutes (%)
Travel time to work - 40 to 59 minutes (% change since 2000)
Travel time to work - 60 to 89 minutes (%)
Travel time to work - 60 to 89 minutes (% change since 2000)
Travel time to work - 90 or more minutes (%)
Travel time to work - 90 or more minutes (% change since 2000)
Marital status - Never married (%)
Marital status - Now married (%)
Marital status - Separated (%)
Marital status - Widowed (%)
Marital status - Divorced (%)
Median family income ($)
Median family income (% change since 2000)
Median non-family income ($)
Median non-family income (% change since 2000)
Median per capita income ($)
Median per capita income (% change since 2000)
Median family income ($) - White
Median family income ($) - Black or African American
Median family income ($) - Asian
Median family income ($) - Hispanic or Latino
Median family income ($) - American Indian and Alaska Native
Median family income ($) - Multirace
Median family income ($) - Other Race
Median year house/condo built
Median year apartment built
Year house built - Built 2005 or later (%)
Year house built - Built 2000 to 2004 (%)
Year house built - Built 1990 to 1999 (%)
Year house built - Built 1980 to 1989 (%)
Year house built - Built 1970 to 1979 (%)
Year house built - Built 1960 to 1969 (%)
Year house built - Built 1950 to 1959 (%)
Year house built - Built 1940 to 1949 (%)
Year house built - Built 1939 or earlier (%)
Average household size
Household density (households per square mile)
Average household size - White
Average household size - Black or African American
Average household size - Asian
Average household size - Hispanic or Latino
Average household size - American Indian and Alaska Native
Average household size - Multirace
Average household size - Other Race
Occupied housing units (%)
Vacant housing units (%)
Owner occupied housing units (%)
Renter occupied housing units (%)
Vacancy status - For rent (%)
Vacancy status - For sale only (%)
Vacancy status - Rented or sold, not occupied (%)
Vacancy status - For seasonal, recreational, or occasional use (%)
Vacancy status - For migrant workers (%)
Vacancy status - Other vacant (%)
Residents with income below the poverty level (%)
Residents with income below 50% of the poverty level (%)
Children below poverty level (%)
Poor families by family type - Married-couple family (%)
Poor families by family type - Male, no wife present (%)
Poor families by family type - Female, no husband present (%)
Poverty status for native-born residents (%)
Poverty status for foreign-born residents (%)
Poverty among high school graduates not in families (%)
Poverty among people who did not graduate high school not in families (%)
Residents with income below the poverty level (%) - White
Residents with income below the poverty level (%) - Black or African American
Residents with income below the poverty level (%) - Asian
Residents with income below the poverty level (%) - Hispanic or Latino
Residents with income below the poverty level (%) - American Indian and Alaska Native
Residents with income below the poverty level (%) - Multirace
Residents with income below the poverty level (%) - Other Race
Air pollution - Air Quality Index (AQI)
Air pollution - CO
Air pollution - NO2
Air pollution - SO2
Air pollution - Ozone
Air pollution - PM10
Air pollution - PM25
Air pollution - Pb
Crime - Murders per 100,000 population
Crime - Rapes per 100,000 population
Crime - Robberies per 100,000 population
Crime - Assaults per 100,000 population
Crime - Burglaries per 100,000 population
Crime - Thefts per 100,000 population
Crime - Auto thefts per 100,000 population
Crime - Arson per 100,000 population
Crime - City-data.com crime index
Crime - Violent crime index
Crime - Property crime index
Crime - Murders per 100,000 population (5 year average)
Crime - Rapes per 100,000 population (5 year average)
Crime - Robberies per 100,000 population (5 year average)
Crime - Assaults per 100,000 population (5 year average)
Crime - Burglaries per 100,000 population (5 year average)
Crime - Thefts per 100,000 population (5 year average)
Crime - Auto thefts per 100,000 population (5 year average)
Crime - Arson per 100,000 population (5 year average)
Crime - City-data.com crime index (5 year average)
Crime - Violent crime index (5 year average)
Crime - Property crime index (5 year average)
1996 Presidential Elections Results (%) - Democratic Party (Clinton)
1996 Presidential Elections Results (%) - Republican Party (Dole)
1996 Presidential Elections Results (%) - Other
2000 Presidential Elections Results (%) - Democratic Party (Gore)
2000 Presidential Elections Results (%) - Republican Party (Bush)
2000 Presidential Elections Results (%) - Other
2004 Presidential Elections Results (%) - Democratic Party (Kerry)
2004 Presidential Elections Results (%) - Republican Party (Bush)
2004 Presidential Elections Results (%) - Other
2008 Presidential Elections Results (%) - Democratic Party (Obama)
2008 Presidential Elections Results (%) - Republican Party (McCain)
2008 Presidential Elections Results (%) - Other
2012 Presidential Elections Results (%) - Democratic Party (Obama)
2012 Presidential Elections Results (%) - Republican Party (Romney)
2012 Presidential Elections Results (%) - Other
2016 Presidential Elections Results (%) - Democratic Party (Clinton)
2016 Presidential Elections Results (%) - Republican Party (Trump)
2016 Presidential Elections Results (%) - Other
2020 Presidential Elections Results (%) - Democratic Party (Biden)
2020 Presidential Elections Results (%) - Republican Party (Trump)
2020 Presidential Elections Results (%) - Other
Ancestries Reported - Arab (%)
Ancestries Reported - Czech (%)
Ancestries Reported - Danish (%)
Ancestries Reported - Dutch (%)
Ancestries Reported - English (%)
Ancestries Reported - French (%)
Ancestries Reported - French Canadian (%)
Ancestries Reported - German (%)
Ancestries Reported - Greek (%)
Ancestries Reported - Hungarian (%)
Ancestries Reported - Irish (%)
Ancestries Reported - Italian (%)
Ancestries Reported - Lithuanian (%)
Ancestries Reported - Norwegian (%)
Ancestries Reported - Polish (%)
Ancestries Reported - Portuguese (%)
Ancestries Reported - Russian (%)
Ancestries Reported - Scotch-Irish (%)
Ancestries Reported - Scottish (%)
Ancestries Reported - Slovak (%)
Ancestries Reported - Subsaharan African (%)
Ancestries Reported - Swedish (%)
Ancestries Reported - Swiss (%)
Ancestries Reported - Ukrainian (%)
Ancestries Reported - United States (%)
Ancestries Reported - Welsh (%)
Ancestries Reported - West Indian (%)
Ancestries Reported - Other (%)
Educational Attainment - No schooling completed (%)
Educational Attainment - Less than high school (%)
Educational Attainment - High school or equivalent (%)
Educational Attainment - Less than 1 year of college (%)
Educational Attainment - 1 or more years of college (%)
Educational Attainment - Associate degree (%)
Educational Attainment - Bachelor's degree (%)
Educational Attainment - Master's degree (%)
Educational Attainment - Professional school degree (%)
Educational Attainment - Doctorate degree (%)
School Enrollment - Nursery, preschool (%)
School Enrollment - Kindergarten (%)
School Enrollment - Grade 1 to 4 (%)
School Enrollment - Grade 5 to 8 (%)
School Enrollment - Grade 9 to 12 (%)
School Enrollment - College undergrad (%)
School Enrollment - Graduate or professional (%)
School Enrollment - Not enrolled in school (%)
School enrollment - Public schools (%)
School enrollment - Private schools (%)
School enrollment - Not enrolled (%)
Median number of rooms in houses and condos
Median number of rooms in apartments
Housing units lacking complete plumbing facilities (%)
Housing units lacking complete kitchen facilities (%)
Density of houses
Urban houses (%)
Rural houses (%)
Households with people 60 years and over (%)
Households with people 65 years and over (%)
Households with people 75 years and over (%)
Households with one or more nonrelatives (%)
Households with no nonrelatives (%)
Population in households (%)
Family households (%)
Nonfamily households (%)
Population in families (%)
Family households with own children (%)
Median number of bedrooms in owner occupied houses
Mean number of bedrooms in owner occupied houses
Median number of bedrooms in renter occupied houses
Mean number of bedrooms in renter occupied houses
Median number of vehichles in owner occupied houses
Mean number of vehichles in owner occupied houses
Median number of vehichles in renter occupied houses
Mean number of vehichles in renter occupied houses
Mortgage status - with mortgage (%)
Mortgage status - with second mortgage (%)
Mortgage status - with home equity loan (%)
Mortgage status - with both second mortgage and home equity loan (%)
Mortgage status - without a mortgage (%)
Average family size
Average family size - White
Average family size - Black or African American
Average family size - Asian
Average family size - Hispanic or Latino
Average family size - American Indian and Alaska Native
Average family size - Multirace
Average family size - Other Race
Geographical mobility - Same house 1 year ago (%)
Geographical mobility - Moved within same county (%)
Geographical mobility - Moved from different county within same state (%)
Geographical mobility - Moved from different state (%)
Geographical mobility - Moved from abroad (%)
Place of birth - Born in state of residence (%)
Place of birth - Born in other state (%)
Place of birth - Native, outside of US (%)
Place of birth - Foreign born (%)
Housing units in structures - 1, detached (%)
Housing units in structures - 1, attached (%)
Housing units in structures - 2 (%)
Housing units in structures - 3 or 4 (%)
Housing units in structures - 5 to 9 (%)
Housing units in structures - 10 to 19 (%)
Housing units in structures - 20 to 49 (%)
Housing units in structures - 50 or more (%)
Housing units in structures - Mobile home (%)
Housing units in structures - Boat, RV, van, etc. (%)
House/condo owner moved in on average (years ago)
Renter moved in on average (years ago)
Year householder moved into unit - Moved in 1999 to March 2000 (%)
Year householder moved into unit - Moved in 1995 to 1998 (%)
Year householder moved into unit - Moved in 1990 to 1994 (%)
Year householder moved into unit - Moved in 1980 to 1989 (%)
Year householder moved into unit - Moved in 1970 to 1979 (%)
Year householder moved into unit - Moved in 1969 or earlier (%)
Means of transportation to work - Drove car alone (%)
Means of transportation to work - Carpooled (%)
Means of transportation to work - Public transportation (%)
Means of transportation to work - Bus or trolley bus (%)
Means of transportation to work - Streetcar or trolley car (%)
Means of transportation to work - Subway or elevated (%)
Means of transportation to work - Railroad (%)
Means of transportation to work - Ferryboat (%)
Means of transportation to work - Taxicab (%)
Means of transportation to work - Motorcycle (%)
Means of transportation to work - Bicycle (%)
Means of transportation to work - Walked (%)
Means of transportation to work - Other means (%)
Working at home (%)
Industry diversity
Most Common Industries - Agriculture, forestry, fishing and hunting, and mining (%)
Most Common Industries - Agriculture, forestry, fishing and hunting (%)
Most Common Industries - Mining, quarrying, and oil and gas extraction (%)
Most Common Industries - Construction (%)
Most Common Industries - Manufacturing (%)
Most Common Industries - Wholesale trade (%)
Most Common Industries - Retail trade (%)
Most Common Industries - Transportation and warehousing, and utilities (%)
Most Common Industries - Transportation and warehousing (%)
Most Common Industries - Utilities (%)
Most Common Industries - Information (%)
Most Common Industries - Finance and insurance, and real estate and rental and leasing (%)
Most Common Industries - Finance and insurance (%)
Most Common Industries - Real estate and rental and leasing (%)
Most Common Industries - Professional, scientific, and management, and administrative and waste management services (%)
Most Common Industries - Professional, scientific, and technical services (%)
Most Common Industries - Management of companies and enterprises (%)
Most Common Industries - Administrative and support and waste management services (%)
Most Common Industries - Educational services, and health care and social assistance (%)
Most Common Industries - Educational services (%)
Most Common Industries - Health care and social assistance (%)
Most Common Industries - Arts, entertainment, and recreation, and accommodation and food services (%)
Most Common Industries - Arts, entertainment, and recreation (%)
Most Common Industries - Accommodation and food services (%)
Most Common Industries - Other services, except public administration (%)
Most Common Industries - Public administration (%)
Occupation diversity
Most Common Occupations - Management, business, science, and arts occupations (%)
Most Common Occupations - Management, business, and financial occupations (%)
Most Common Occupations - Management occupations (%)
Most Common Occupations - Business and financial operations occupations (%)
Most Common Occupations - Computer, engineering, and science occupations (%)
Most Common Occupations - Computer and mathematical occupations (%)
Most Common Occupations - Architecture and engineering occupations (%)
Most Common Occupations - Life, physical, and social science occupations (%)
Most Common Occupations - Education, legal, community service, arts, and media occupations (%)
Most Common Occupations - Community and social service occupations (%)
Most Common Occupations - Legal occupations (%)
Most Common Occupations - Education, training, and library occupations (%)
Most Common Occupations - Arts, design, entertainment, sports, and media occupations (%)
Most Common Occupations - Healthcare practitioners and technical occupations (%)
Most Common Occupations - Health diagnosing and treating practitioners and other technical occupations (%)
Most Common Occupations - Health technologists and technicians (%)
Most Common Occupations - Service occupations (%)
Most Common Occupations - Healthcare support occupations (%)
Most Common Occupations - Protective service occupations (%)
Most Common Occupations - Fire fighting and prevention, and other protective service workers including supervisors (%)
Most Common Occupations - Law enforcement workers including supervisors (%)
Most Common Occupations - Food preparation and serving related occupations (%)
Most Common Occupations - Building and grounds cleaning and maintenance occupations (%)
Most Common Occupations - Personal care and service occupations (%)
Most Common Occupations - Sales and office occupations (%)
Most Common Occupations - Sales and related occupations (%)
Most Common Occupations - Office and administrative support occupations (%)
Most Common Occupations - Natural resources, construction, and maintenance occupations (%)
Most Common Occupations - Farming, fishing, and forestry occupations (%)
Most Common Occupations - Construction and extraction occupations (%)
Most Common Occupations - Installation, maintenance, and repair occupations (%)
Most Common Occupations - Production, transportation, and material moving occupations (%)
Most Common Occupations - Production occupations (%)
Most Common Occupations - Transportation occupations (%)
Most Common Occupations - Material moving occupations (%)
People in Group quarters - Institutionalized population (%)
People in Group quarters - Correctional institutions (%)
People in Group quarters - Federal prisons and detention centers (%)
People in Group quarters - Halfway houses (%)
People in Group quarters - Local jails and other confinement facilities (including police lockups) (%)
People in Group quarters - Military disciplinary barracks (%)
People in Group quarters - State prisons (%)
People in Group quarters - Other types of correctional institutions (%)
People in Group quarters - Nursing homes (%)
People in Group quarters - Hospitals/wards, hospices, and schools for the handicapped (%)
People in Group quarters - Hospitals/wards and hospices for chronically ill (%)
People in Group quarters - Hospices or homes for chronically ill (%)
People in Group quarters - Military hospitals or wards for chronically ill (%)
People in Group quarters - Other hospitals or wards for chronically ill (%)
People in Group quarters - Hospitals or wards for drug/alcohol abuse (%)
People in Group quarters - Mental (Psychiatric) hospitals or wards (%)
People in Group quarters - Schools, hospitals, or wards for the mentally retarded (%)
People in Group quarters - Schools, hospitals, or wards for the physically handicapped (%)
People in Group quarters - Institutions for the deaf (%)
People in Group quarters - Institutions for the blind (%)
People in Group quarters - Orthopedic wards and institutions for the physically handicapped (%)
People in Group quarters - Wards in general hospitals for patients who have no usual home elsewhere (%)
People in Group quarters - Wards in military hospitals for patients who have no usual home elsewhere (%)
People in Group quarters - Juvenile institutions (%)
People in Group quarters - Long-term care (%)
People in Group quarters - Homes for abused, dependent, and neglected children (%)
People in Group quarters - Residential treatment centers for emotionally disturbed children (%)
People in Group quarters - Training schools for juvenile delinquents (%)
People in Group quarters - Short-term care, detention or diagnostic centers for delinquent children (%)
People in Group quarters - Type of juvenile institution unknown (%)
People in Group quarters - Noninstitutionalized population (%)
People in Group quarters - College dormitories (includes college quarters off campus) (%)
People in Group quarters - Military quarters (%)
People in Group quarters - On base (%)
People in Group quarters - Barracks, unaccompanied personnel housing (UPH), (Enlisted/Officer), ;and similar group living quarters for military personnel (%)
People in Group quarters - Transient quarters for temporary residents (%)
People in Group quarters - Military ships (%)
People in Group quarters - Group homes (%)
People in Group quarters - Homes or halfway houses for drug/alcohol abuse (%)
People in Group quarters - Homes for the mentally ill (%)
People in Group quarters - Homes for the mentally retarded (%)
People in Group quarters - Homes for the physically handicapped (%)
People in Group quarters - Other group homes (%)
People in Group quarters - Religious group quarters (%)
People in Group quarters - Dormitories (%)
People in Group quarters - Agriculture workers' dormitories on farms (%)
People in Group quarters - Job Corps and vocational training facilities (%)
People in Group quarters - Other workers' dormitories (%)
People in Group quarters - Crews of maritime vessels (%)
People in Group quarters - Other nonhousehold living situations (%)
People in Group quarters - Other noninstitutional group quarters (%)
Residents speaking English at home (%)
Residents speaking English at home - Born in the United States (%)
Residents speaking English at home - Native, born elsewhere (%)
Residents speaking English at home - Foreign born (%)
Residents speaking Spanish at home (%)
Residents speaking Spanish at home - Born in the United States (%)
Residents speaking Spanish at home - Native, born elsewhere (%)
Residents speaking Spanish at home - Foreign born (%)
Residents speaking other language at home (%)
Residents speaking other language at home - Born in the United States (%)
Residents speaking other language at home - Native, born elsewhere (%)
Residents speaking other language at home - Foreign born (%)
Class of Workers - Employee of private company (%)
Class of Workers - Self-employed in own incorporated business (%)
Class of Workers - Private not-for-profit wage and salary workers (%)
Class of Workers - Local government workers (%)
Class of Workers - State government workers (%)
Class of Workers - Federal government workers (%)
Class of Workers - Self-employed workers in own not incorporated business and Unpaid family workers (%)
House heating fuel used in houses and condos - Utility gas (%)
House heating fuel used in houses and condos - Bottled, tank, or LP gas (%)
House heating fuel used in houses and condos - Electricity (%)
House heating fuel used in houses and condos - Fuel oil, kerosene, etc. (%)
House heating fuel used in houses and condos - Coal or coke (%)
House heating fuel used in houses and condos - Wood (%)
House heating fuel used in houses and condos - Solar energy (%)
House heating fuel used in houses and condos - Other fuel (%)
House heating fuel used in houses and condos - No fuel used (%)
House heating fuel used in apartments - Utility gas (%)
House heating fuel used in apartments - Bottled, tank, or LP gas (%)
House heating fuel used in apartments - Electricity (%)
House heating fuel used in apartments - Fuel oil, kerosene, etc. (%)
House heating fuel used in apartments - Coal or coke (%)
House heating fuel used in apartments - Wood (%)
House heating fuel used in apartments - Solar energy (%)
House heating fuel used in apartments - Other fuel (%)
House heating fuel used in apartments - No fuel used (%)
Armed forces status - In Armed Forces (%)
Armed forces status - Civilian (%)
Armed forces status - Civilian - Veteran (%)
Armed forces status - Civilian - Nonveteran (%)
Fatal accidents locations in years 2005-2021
Fatal accidents locations in 2005
Fatal accidents locations in 2006
Fatal accidents locations in 2007
Fatal accidents locations in 2008
Fatal accidents locations in 2009
Fatal accidents locations in 2010
Fatal accidents locations in 2011
Fatal accidents locations in 2012
Fatal accidents locations in 2013
Fatal accidents locations in 2014
Fatal accidents locations in 2015
Fatal accidents locations in 2016
Fatal accidents locations in 2017
Fatal accidents locations in 2018
Fatal accidents locations in 2019
Fatal accidents locations in 2020
Fatal accidents locations in 2021
Alcohol use - People drinking some alcohol every month (%)
Alcohol use - People not drinking at all (%)
Alcohol use - Average days/month drinking alcohol
Alcohol use - Average drinks/week
Alcohol use - Average days/year people drink much
Audiometry - Average condition of hearing (%)
Audiometry - People that can hear a whisper from across a quiet room (%)
Audiometry - People that can hear normal voice from across a quiet room (%)
Audiometry - Ears ringing, roaring, buzzing (%)
Audiometry - Had a job exposure to loud noise (%)
Audiometry - Had off-work exposure to loud noise (%)
Blood Pressure & Cholesterol - Has high blood pressure (%)
Blood Pressure & Cholesterol - Checking blood pressure at home (%)
Blood Pressure & Cholesterol - Frequently checking blood cholesterol (%)
Blood Pressure & Cholesterol - Has high cholesterol level (%)
Consumer Behavior - Money monthly spent on food at supermarket/grocery store
Consumer Behavior - Money monthly spent on food at other stores
Consumer Behavior - Money monthly spent on eating out
Consumer Behavior - Money monthly spent on carryout/delivered foods
Consumer Behavior - Income spent on food at supermarket/grocery store (%)
Consumer Behavior - Income spent on food at other stores (%)
Consumer Behavior - Income spent on eating out (%)
Consumer Behavior - Income spent on carryout/delivered foods (%)
Current Health Status - General health condition (%)
Current Health Status - Blood donors (%)
Current Health Status - Has blood ever tested for HIV virus (%)
Current Health Status - Left-handed people (%)
Dermatology - People using sunscreen (%)
Diabetes - Diabetics (%)
Diabetes - Had a blood test for high blood sugar (%)
Diabetes - People taking insulin (%)
Diet Behavior & Nutrition - Diet health (%)
Diet Behavior & Nutrition - Milk product consumption (# of products/month)
Diet Behavior & Nutrition - Meals not home prepared (#/week)
Diet Behavior & Nutrition - Meals from fast food or pizza place (#/week)
Diet Behavior & Nutrition - Ready-to-eat foods (#/month)
Diet Behavior & Nutrition - Frozen meals/pizza (#/month)
Drug Use - People that ever used marijuana or hashish (%)
Drug Use - Ever used hard drugs (%)
Drug Use - Ever used any form of cocaine (%)
Drug Use - Ever used heroin (%)
Drug Use - Ever used methamphetamine (%)
Health Insurance - People covered by health insurance (%)
Kidney Conditions-Urology - Avg. # of times urinating at night
Medical Conditions - People with asthma (%)
Medical Conditions - People with anemia (%)
Medical Conditions - People with psoriasis (%)
Medical Conditions - People with overweight (%)
Medical Conditions - Elderly people having difficulties in thinking or remembering (%)
Medical Conditions - People who ever received blood transfusion (%)
Medical Conditions - People having trouble seeing even with glass/contacts (%)
Medical Conditions - People with arthritis (%)
Medical Conditions - People with gout (%)
Medical Conditions - People with congestive heart failure (%)
Medical Conditions - People with coronary heart disease (%)
Medical Conditions - People with angina pectoris (%)
Medical Conditions - People who ever had heart attack (%)
Medical Conditions - People who ever had stroke (%)
Medical Conditions - People with emphysema (%)
Medical Conditions - People with thyroid problem (%)
Medical Conditions - People with chronic bronchitis (%)
Medical Conditions - People with any liver condition (%)
Medical Conditions - People who ever had cancer or malignancy (%)
Mental Health - People who have little interest in doing things (%)
Mental Health - People feeling down, depressed, or hopeless (%)
Mental Health - People who have trouble sleeping or sleeping too much (%)
Mental Health - People feeling tired or having little energy (%)
Mental Health - People with poor appetite or overeating (%)
Mental Health - People feeling bad about themself (%)
Mental Health - People who have trouble concentrating on things (%)
Mental Health - People moving or speaking slowly or too fast (%)
Mental Health - People having thoughts they would be better off dead (%)
Oral Health - Average years since last visit a dentist
Oral Health - People embarrassed because of mouth (%)
Oral Health - People with gum disease (%)
Oral Health - General health of teeth and gums (%)
Oral Health - Average days a week using dental floss/device
Oral Health - Average days a week using mouthwash for dental problem
Oral Health - Average number of teeth
Pesticide Use - Households using pesticides to control insects (%)
Pesticide Use - Households using pesticides to kill weeds (%)
Physical Activity - People doing vigorous-intensity work activities (%)
Physical Activity - People doing moderate-intensity work activities (%)
Physical Activity - People walking or bicycling (%)
Physical Activity - People doing vigorous-intensity recreational activities (%)
Physical Activity - People doing moderate-intensity recreational activities (%)
Physical Activity - Average hours a day doing sedentary activities
Physical Activity - Average hours a day watching TV or videos
Physical Activity - Average hours a day using computer
Physical Functioning - People having limitations keeping them from working (%)
Physical Functioning - People limited in amount of work they can do (%)
Physical Functioning - People that need special equipment to walk (%)
Physical Functioning - People experiencing confusion/memory problems (%)
Physical Functioning - People requiring special healthcare equipment (%)
Prescription Medications - Average number of prescription medicines taking
Preventive Aspirin Use - Adults 40+ taking low-dose aspirin (%)
Reproductive Health - Vaginal deliveries (%)
Reproductive Health - Cesarean deliveries (%)
Reproductive Health - Deliveries resulted in a live birth (%)
Reproductive Health - Pregnancies resulted in a delivery (%)
Reproductive Health - Women breastfeeding newborns (%)
Reproductive Health - Women that had a hysterectomy (%)
Reproductive Health - Women that had both ovaries removed (%)
Reproductive Health - Women that have ever taken birth control pills (%)
Reproductive Health - Women taking birth control pills (%)
Reproductive Health - Women that have ever used Depo-Provera or injectables (%)
Reproductive Health - Women that have ever used female hormones (%)
Sexual Behavior - People 18+ that ever had sex (vaginal, anal, or oral) (%)
Sexual Behavior - Males 18+ that ever had vaginal sex with a woman (%)
Sexual Behavior - Males 18+ that ever performed oral sex on a woman (%)
Sexual Behavior - Males 18+ that ever had anal sex with a woman (%)
Sexual Behavior - Males 18+ that ever had any sex with a man (%)
Sexual Behavior - Females 18+ that ever had vaginal sex with a man (%)
Sexual Behavior - Females 18+ that ever performed oral sex on a man (%)
Sexual Behavior - Females 18+ that ever had anal sex with a man (%)
Sexual Behavior - Females 18+ that ever had any kind of sex with a woman (%)
Sexual Behavior - Average age people first had sex
Sexual Behavior - Average number of female sex partners in lifetime (males 18+)
Sexual Behavior - Average number of female vaginal sex partners in lifetime (males 18+)
Sexual Behavior - Average age people first performed oral sex on a woman (18+)
Sexual Behavior - Average number of woman performed oral sex on in lifetime (18+)
Sexual Behavior - Average number of male sex partners in lifetime (males 18+)
Sexual Behavior - Average number of male anal sex partners in lifetime (males 18+)
Sexual Behavior - Average age people first performed oral sex on a man (18+)
Sexual Behavior - Average number of male oral sex partners in lifetime (18+)
Sexual Behavior - People using protection when performing oral sex (%)
Sexual Behavior - Average number of times people have vaginal or anal sex a year
Sexual Behavior - People having sex without condom (%)
Sexual Behavior - Average number of male sex partners in lifetime (females 18+)
Sexual Behavior - Average number of male vaginal sex partners in lifetime (females 18+)
Sexual Behavior - Average number of female sex partners in lifetime (females 18+)
Sexual Behavior - Circumcised males 18+ (%)
Sleep Disorders - Average hours sleeping at night
Sleep Disorders - People that has trouble sleeping (%)
Smoking-Cigarette Use - People smoking cigarettes (%)
Taste & Smell - People 40+ having problems with smell (%)
Taste & Smell - People 40+ having problems with taste (%)
Taste & Smell - People 40+ that ever had wisdom teeth removed (%)
Taste & Smell - People 40+ that ever had tonsils teeth removed (%)
Taste & Smell - People 40+ that ever had a loss of consciousness because of a head injury (%)
Taste & Smell - People 40+ that ever had a broken nose or other serious injury to face or skull (%)
Taste & Smell - People 40+ that ever had two or more sinus infections (%)
Weight - Average height (inches)
Weight - Average weight (pounds)
Weight - Average BMI
Weight - People that are obese (%)
Weight - People that ever were obese (%)
Weight - People trying to lose weight (%)
100%
urban population.
Estimated median house/condo value in 2022: $318,757
89108:
$318,757Nevada:
$434,700
According to our research of Nevada and other state lists, there were 217 registered sex offenders living in 89108 zip code as of April 27, 2024 . The ratio of all residents to sex offenders in zip code 89108 is 351 to 1.The ratio of registered sex offenders to all residents in this zip code is near the state average.
Median resident age: This zip code:
36.5 yearsNevada median age:
39.0 years
Average household size: This zip code:
2.8 peopleNevada:
2.6 people
Averages for the 2020 tax year for zip code 89108, filed in 2021:
Average Adjusted Gross Income (AGI) in 2020: $39,143 (Individual Income Tax Returns) Here:
$39,143State:
$78,964
Salary/wage: $33,499 (reported on 84.9% of returns )Here:
$33,499State:
$54,472
(% of AGI for various income ranges: 1224.2% for AGIs below $25k , 3502.8% for AGIs $25k-50k , 6580.9% for AGIs $50k-75k , 9463.1% for AGIs $75k-100k , 16333.9% for AGIs $100k-200k , 53118.0% for AGIs over 200k ) Taxable interest for individuals: $769 (reported on 12.4% of returns )This zip code:
$769Nevada:
$3,521
(% of AGI for various income ranges: 4.4% for AGIs below $25k , 4.7% for AGIs $25k-50k , 17.0% for AGIs $50k-75k , 28.8% for AGIs $75k-100k , 95.1% for AGIs $100k-200k , 1254.0% for AGIs over 200k ) Ordinary dividends: $2,802 (reported on 5.2% of returns )(% of AGI for various income ranges: 4.9% for AGIs below $25k , 6.0% for AGIs $25k-50k , 19.9% for AGIs $50k-75k , 43.5% for AGIs $75k-100k , 152.0% for AGIs $100k-200k , 2840.0% for AGIs over 200k ) Net capital gain/loss in AGI: +$13,733 (reported on 6.0% of returns )Here:
+$13,733State:
+$63,025
(% of AGI for various income ranges: 1.5% for AGIs below $25k , 10.3% for AGIs $25k-50k , 51.5% for AGIs $50k-75k , 62.4% for AGIs $75k-100k , 577.4% for AGIs $100k-200k , 39822.0% for AGIs over 200k ) Profit/loss from business: +$5,979 (reported on 16.7% of returns )Here:
+$5,979State:
+$11,500
(% of AGI for various income ranges: 112.0% for AGIs below $25k , 82.9% for AGIs $25k-50k , 154.1% for AGIs $50k-75k , 288.6% for AGIs $75k-100k , 449.8% for AGIs $100k-200k , 2756.0% for AGIs over 200k ) Taxable individual retirement arrangement distribution: $15,000 (reported on 2.9% of returns )89108:
$15,000Nevada:
$23,628
(% of AGI for various income ranges: 16.7% for AGIs below $25k , 21.3% for AGIs $25k-50k , 65.1% for AGIs $50k-75k , 187.2% for AGIs $75k-100k , 462.1% for AGIs $100k-200k , 5110.0% for AGIs over 200k ) Total itemized deductions: $29,016 (reported on 3.4% of returns )Here:
$29,016State:
$44,173
(% of AGI for various income ranges: 20.1% for AGIs below $25k , 73.5% for AGIs $25k-50k , 214.8% for AGIs $50k-75k , 330.6% for AGIs $75k-100k , 921.5% for AGIs $100k-200k , 11756.0% for AGIs over 200k ) Charity contributions: $7,085 (reported on 2.6% of returns )(% of AGI for various income ranges: 1.3% for AGIs below $25k , 11.1% for AGIs $25k-50k , 36.9% for AGIs $50k-75k , 68.0% for AGIs $75k-100k , 169.5% for AGIs $100k-200k , 3212.0% for AGIs over 200k ) Taxes paid: $4,809 (reported on 3.3% of returns )(% of AGI for various income ranges: 3.0% for AGIs below $25k , 13.7% for AGIs $25k-50k , 38.9% for AGIs $50k-75k , 62.4% for AGIs $75k-100k , 144.8% for AGIs $100k-200k , 1046.0% for AGIs over 200k ) Earned income credit: $2,399 (reported on 25.4% of returns )(% of AGI for various income ranges: 120.8% for AGIs below $25k , 79.6% for AGIs $25k-50k , 1.6% for AGIs $50k-75k ) Percentage of individuals using paid preparers for their 2020 taxes: 93.0%(% for various income ranges: 92.1% for AGIs below $25k , 94.3% for AGIs $25k-50k , 93.3% for AGIs $50k-75k , 92.5% for AGIs $75k-100k , 91.7% for AGIs $100k-200k , 85.7% for AGIs over 200k )
Averages for the 2012 tax year for zip code 89108, filed in 2013:
Average Adjusted Gross Income (AGI) in 2012: $34,328 (Individual Income Tax Returns) Here:
$34,328State:
$61,164
Salary/wage: $31,529 (reported on 86.0% of returns )Here:
$31,529State:
$45,924
(% of AGI for various income ranges: 78.5% for AGIs below $25k , 87.7% for AGIs $25k-50k , 79.6% for AGIs $50k-75k , 77.0% for AGIs $75k-100k , 72.1% for AGIs $100k-200k , 32.5% for AGIs over 200k ) Taxable interest for individuals: $827 (reported on 13.5% of returns )This zip code:
$827Nevada:
$3,137
(% of AGI for various income ranges: 0.3% for AGIs below $25k , 0.2% for AGIs $25k-50k , 0.3% for AGIs $50k-75k , 0.3% for AGIs $75k-100k , 0.4% for AGIs $100k-200k , 1.0% for AGIs over 200k ) Ordinary dividends: $4,481 (reported on 6.7% of returns )(% of AGI for various income ranges: 1.9% for AGIs below $25k , 0.5% for AGIs $25k-50k , 0.5% for AGIs $50k-75k , 0.4% for AGIs $75k-100k , 0.7% for AGIs $100k-200k , 2.8% for AGIs over 200k ) Net capital gain/loss in AGI: +$6,460 (reported on 5.0% of returns )Here:
+$6,460State:
+$33,127
(% of AGI for various income ranges: 0.1% for AGIs $50k-75k , 0.3% for AGIs $75k-100k , 1.1% for AGIs $100k-200k , 18.6% for AGIs over 200k ) Profit/loss from business: +$7,203 (reported on 13.0% of returns )Here:
+$7,203State:
+$12,567
(% of AGI for various income ranges: 8.4% for AGIs below $25k , 1.3% for AGIs $25k-50k , 1.0% for AGIs $50k-75k , 1.5% for AGIs $75k-100k , 1.5% for AGIs $100k-200k , 2.7% for AGIs over 200k ) Taxable individual retirement arrangement distribution: $12,087 (reported on 4.2% of returns )89108:
$12,087Nevada:
$20,808
(% of AGI for various income ranges: 1.1% for AGIs below $25k , 1.0% for AGIs $25k-50k , 1.3% for AGIs $50k-75k , 2.3% for AGIs $75k-100k , 2.8% for AGIs $100k-200k , 2.2% for AGIs over 200k ) Total itemized deductions: $18,040 (29% of AGI, reported on 18.1% of returns )Here:
$18,040State:
$26,148
Here:
28.7% of AGIState:
20.0% of AGI
(% of AGI for various income ranges: 4.8% for AGIs below $25k , 8.1% for AGIs $25k-50k , 11.3% for AGIs $50k-75k , 11.3% for AGIs $75k-100k , 13.3% for AGIs $100k-200k , 18.4% for AGIs over 200k ) Charity contributions: $2,715 (reported on 14.3% of returns )(% of AGI for various income ranges: 0.4% for AGIs below $25k , 0.8% for AGIs $25k-50k , 1.3% for AGIs $50k-75k , 1.7% for AGIs $75k-100k , 2.0% for AGIs $100k-200k , 2.3% for AGIs over 200k ) Taxes paid: $2,854 (reported on 17.6% of returns )(% of AGI for various income ranges: 0.7% for AGIs below $25k , 1.3% for AGIs $25k-50k , 1.7% for AGIs $50k-75k , 1.8% for AGIs $75k-100k , 2.2% for AGIs $100k-200k , 2.0% for AGIs over 200k ) Earned income credit: $2,491 (reported on 27.1% of returns )(% of AGI for various income ranges: 7.8% for AGIs below $25k , 1.4% for AGIs $25k-50k ) Percentage of individuals using paid preparers for their 2012 taxes: 56.9%(% for various income ranges: 56.3% for AGIs below $25k , 57.5% for AGIs $25k-50k , 56.3% for AGIs $50k-75k , 56.3% for AGIs $75k-100k , 60.4% for AGIs $100k-200k , 72.7% for AGIs over 200k )
Averages for the 2004 tax year for zip code 89108, filed in 2005:
Average Adjusted Gross Income (AGI) in 2004: $37,968 (Individual Income Tax Returns) Here:
$37,968State:
$58,367
Salary/wage: $34,058 (reported on 89.7% of returns )Here:
$34,058State:
$42,695
(% of AGI for various income ranges: 105.9% for AGIs below $10k , 86.1% for AGIs $10k-25k , 89.5% for AGIs $25k-50k , 86.5% for AGIs $50k-75k , 82.9% for AGIs $75k-100k , 51.8% for AGIs over 100k ) Taxable interest for individuals: $1,410 (reported on 23.7% of returns )This zip code:
$1,410Nevada:
$3,867
(% of AGI for various income ranges: 2.4% for AGIs below $10k , 0.8% for AGIs $10k-25k , 0.5% for AGIs $25k-50k , 0.6% for AGIs $50k-75k , 0.9% for AGIs $75k-100k , 1.7% for AGIs over 100k ) Taxable dividends: $1,783 (reported on 9.9% of returns )(% of AGI for various income ranges: 1.4% for AGIs below $10k , 0.5% for AGIs $10k-25k , 0.3% for AGIs $25k-50k , 0.3% for AGIs $50k-75k , 0.4% for AGIs $75k-100k , 1.0% for AGIs over 100k ) Net capital gain/loss: +$20,559 (reported on 8.6% of returns )Here:
+$20,559State:
+$50,644
(% of AGI for various income ranges: -0.8% for AGIs below $10k , -0.0% for AGIs $10k-25k , 0.2% for AGIs $25k-50k , 0.8% for AGIs $50k-75k , 1.6% for AGIs $75k-100k , 21.6% for AGIs over 100k ) Profit/loss from business: +$7,373 (reported on 10.6% of returns )Here:
+$7,373State:
+$13,618
(% of AGI for various income ranges: 2.7% for AGIs below $10k , 3.3% for AGIs $10k-25k , 1.4% for AGIs $25k-50k , 1.4% for AGIs $50k-75k , 1.4% for AGIs $75k-100k , 3.3% for AGIs over 100k ) IRA payment deduction: $2,837 (reported on 1.5% of returns )89108:
$2,837Nevada:
$3,054
(% of AGI for various income ranges: 0.1% for AGIs below $10k , 0.1% for AGIs $10k-25k , 0.1% for AGIs $25k-50k , 0.1% for AGIs $50k-75k , 0.1% for AGIs $75k-100k , 0.1% for AGIs over 100k ) Self-employed pension: $10,808 (reported on 0.2% of returns )Here:
$10,808Nevada:
$16,706
Total itemized deductions: $17,127 (29% of AGI, reported on 33.7% of returns )Here:
$17,127State:
$22,990
Here:
28.6% of AGIState:
21.8% of AGI
(% of AGI for various income ranges: 13.1% for AGIs below $10k , 10.4% for AGIs $10k-25k , 14.8% for AGIs $25k-50k , 17.6% for AGIs $50k-75k , 17.6% for AGIs $75k-100k , 15.1% for AGIs over 100k ) Charity contributions deductions: $2,309 (4% of AGI, reported on 28.5% of returns )Here:
3.7% of AGIState:
3.1% of AGI
(% of AGI for various income ranges: 0.6% for AGIs below $10k , 0.8% for AGIs $10k-25k , 1.3% for AGIs $25k-50k , 1.9% for AGIs $50k-75k , 2.3% for AGIs $75k-100k , 2.6% for AGIs over 100k ) Total tax: $4,669 (reported on 70.9% of returns )89108:
$4,669State:
$10,585
(% of AGI for various income ranges: 2.5% for AGIs below $10k , 3.6% for AGIs $10k-25k , 6.0% for AGIs $25k-50k , 8.5% for AGIs $50k-75k , 10.5% for AGIs $75k-100k , 16.2% for AGIs over 100k ) Earned income credit: $1,744 (reported on 19.8% of returns )Percentage of individuals using paid preparers for their 2004 taxes: 60.2%(% for various income ranges: 53.1% for AGIs below $10k , 62.5% for AGIs $10k-25k , 59.7% for AGIs $25k-50k , 62.2% for AGIs $50k-75k , 60.9% for AGIs $75k-100k , 66.6% for AGIs over 100k )
Estimated median household income in 2022: This zip code:
$56,471Nevada:
$72,333
Nearest zip codes: 89107 ,
89128 ,
89130 ,
89032 ,
89146 ,
89106 .
Las Vegas Zip Code Map
Percentage of family households: This zip code:
47.8%Nevada:
45.2%
Percentage of households with unmarried partners: This zip code:
10.0%Nevada:
44.2%
Likely homosexual households (counted as self-reported same-sex unmarried-partner households)
Lesbian couples: 0.3% of all households Gay men: 0.3% of all households
Household received Food Stamps/SNAP in the past 12 months: 5,479Household did not receive Food Stamps/SNAP in the past 12 months: 22,202
Women who had a birth in the past 12 months: 1,150 (701 now married , 416 unmarried) Women who did not have a birth in the past 12 months: 17,968 (6,532 now married , 11,464 unmarried)
Housing units in zip code 89108 with a mortgage: 8,889 (417
second mortgage , 37
home equity loan , 228
both second mortgage and home equity loan )
Houses without a mortgage: 17
Median monthly owner costs for units with a mortgage: $1,407
Median monthly owner costs for units without a mortgage: $407
Residents with income below the poverty level in 2022:
This zip code:
18.6%Whole state:
12.5%
Residents with income below 50% of the poverty level in 2022:
This zip code:
8.6%Whole state:
5.9%
Median number of rooms in houses and condos: Median number of rooms in apartments: Notable locations in this zip code not listed on our city pages
Click to draw/clear zip code borders Notable locations in zip code 89108: (A) , Las Vegas Fire and Rescue Station 9 (B) , Las Vegas Fire and Rescue Station 43 (C) , Northwest Track Break Center (D) . Display/hide their locations on the map
Shopping Centers: (1) , Shadow Hills Shopping Center (2) , Decatur Shopping Center (3) , Rainbow Promenade Shopping Center (4) , Best in the West Shopping Center (5) , Cheyenne Commons Shopping Center (6) . Display/hide their locations on the map
Churches in zip code 89108 include: (A) , Trinity Missionary Baptist Church (B) , The Church of Jesus Christ of Latter Day Saints (C) , Iglesia Evangelica Amigos (D) , Holy Spirit Lutheran Church (E) , Gospel Outreach Center Ministries (F) , Foothills Southern Baptist Church (G) , First Nevada Christian Methodist Episcopal Church (H) , Desert Harvest Mission Church (I) . Display/hide their locations on the map
Parks in zip code 89108 include: (1) , Charleston Heights Park (2) , Childrens Memorial Park (3) , Coleman Park (4) , Culley Playground (5) , Heers Park (6) , McWilliams Playground (7) , Ronzone Playground (8) , Wildwood Park (9) . Display/hide their locations on the map
Tourist attractions (not listed on the city page) :
Year house built (houses)
11 2020 or later861 2010 to 20192,694 2000 to 20096,637 1990 to 19998,849 1980 to 19894,768 1970 to 19792,190 1960 to 19691,158 1950 to 195967 1940 to 1949248 1939 or earlier
Zip code 89108 household income distribution in 2022 2,341 Less than $10,0001,014 $10,000 to $14,999806 $15,000 to $19,9991,361 $20,000 to $24,999977 $25,000 to $29,9991,254 $30,000 to $34,9991,224 $35,000 to $39,9991,503 $40,000 to $44,9991,372 $45,000 to $49,9993,224 $50,000 to $59,9992,752 $60,000 to $74,9994,299 $75,000 to $99,9992,005 $100,000 to $124,9991,423 $125,000 to $149,9991,215 $150,000 to $199,999674 $200,000 or moreEstimate of home value of owner-occupied houses/condos in 2022 in zip code 89108 152 Less than $10,00031 $10,000 to $14,99912 $15,000 to $19,999129 $20,000 to $24,99930 $25,000 to $29,99962 $30,000 to $34,99931 $35,000 to $39,99910 $50,000 to $59,99914 $70,000 to $79,99967 $80,000 to $89,99969 $90,000 to $99,999221 $100,000 to $124,999145 $125,000 to $149,999290 $150,000 to $174,999332 $175,000 to $199,9991,800 $200,000 to $249,9991,609 $250,000 to $299,9992,611 $300,000 to $399,9991,380 $400,000 to $499,9991,023 $500,000 to $749,999396 $750,000 to $999,99995 $1,000,000 to $1,499,99924 $1,500,000 to $1,999,9999 $2,000,000 or moreRent paid by renters in 2022 in zip code 89108 44 Less than $10036 $100 to $14946 $150 to $19935 $200 to $24953 $250 to $29914 $300 to $34912 $350 to $39994 $400 to $44925 $450 to $49911 $500 to $54949 $550 to $59974 $600 to $649280 $650 to $699249 $700 to $749224 $750 to $7991,086 $800 to $8991,297 $900 to $9994,189 $1,000 to $1,2492,944 $1,250 to $1,4991,325 $1,500 to $1,999115 $2,000 to $2,499137 $2,500 to $2,99956 $3,000 to $3,49917 $3,500 or more380 No cash rent
Median gross rent in 2022: $1,387.
Median price asked for vacant for-sale houses and condos in 2022: $241,202.
Estimated median house (or condo) value in 2022 for: White Non-Hispanic householders: $324,542Black or African American householders: $339,143American Indian or Alaska Native householders: $327,848Asian householders: $350,990Native Hawaiian and other Pacific Islander householders: $246,299Some other race householders: $303,328Two or more races householders: $327,848Hispanic or Latino householders: $306,634Estimated median house or condo value in 2022: $318,757
89108:
$318,757Nevada:
$434,700
Lower value quartile - upper value quartile: $254,050 - $440,411
Mean price in 2022: Detached houses: $284,822Here:
$284,822State:
$549,327
Townhouses or other attached units: $177,499Here:
$177,499State:
$328,893
In 2-unit structures: $2,371,824Here:
$2,371,824State:
$326,466
In 3-to-4-unit structures: $95,605Here:
$95,605State:
$295,216
In 5-or-more-unit structures: $116,219Here:
$116,219State:
$297,847
Mobile homes: $320,323Here:
$320,323State:
$159,995
Housing units in structures:
One, detached: 16,583One, attached: 1,257Two: 3953 or 4: 3,0825 to 9: 2,38610 to 19: 1,87320 to 49: 71750 or more: 2,146Mobile homes: 301Unemployment : 7.7%
Means of transportation to work in zip code 89108 71.5% 25,088 Drove a car alone12.1% 4,248 Carpooled3.2% 1,138 Bus or trolley bus0.9% 305 Taxi0.1% 41 Motorcycle0.3% 120 Bicycle1.0% 346 Walked3.0% 1,040 Other means6.3% 2,209 Worked at homeTravel time to work (commute) in zip code 89108 391 Less than 5 minutes1,802 5 to 9 minutes2,534 10 to 14 minutes4,180 15 to 19 minutes7,292 20 to 24 minutes3,688 25 to 29 minutes6,452 30 to 34 minutes1,007 35 to 39 minutes1,796 40 to 44 minutes1,624 45 to 59 minutes701 60 to 89 minutes814 90 or more minutes
Neighborhoods in zip code 89108: Percentage of zip code residents living and working in this county: 99.2%
Household type by relationship:
Households: 77,272
Male householders: 12,995 (3,943 living alone ), Female householders: 14,502 (3,969 living alone )9,974 spouses (9,892 opposite-sex spouses ), 2,719 unmarried partners , (2,598 opposite-sex unmarried partners ), 24,304 children (22,591 natural , 508 adopted , 1,200 stepchildren ), 1,517 grandchildren , 2,012 brothers or sisters , 2,259 parents , 49 foster children , 2,652 other relatives , 3,823 non-relatives In group quarters: 432 (-1 institutionalized population )
Size of family households: 6,383 2-persons , 3,732 3-persons , 3,463 4-persons , 1,884 5-persons , 1,473 6-persons , 500 7-or-more-persons
Size of nonfamily households: 7,910 1-person , 1,738 2-persons , 297 3-persons , 33 4-persons , 15 5-persons , 26 6-persons , 21 7-or-more-persons
8,891 married couples with children. single-parent households (1,208 men , 5,387 women ).
55.8% of residents of 89108 zip code speak English at home. of residents speak Spanish at home (53% very well, 23% well, 17% not well, 6% not at all ).of residents speak other Indo-European language at home (73% very well, 13% well, 11% not well, 3% not at all ).of residents speak Asian or Pacific Island language at home (61% very well, 34% well, 4% not well ).of residents speak other language at home (79% very well, 15% well, 6% not well ).
Foreign born population: 19,480 (25.2%)
(46.3%
of them are naturalized citizens )
This zip code:
25.2%Whole state:
18.9%
58% Honduras 9% Malaysia 5% Barbados 4% Guatemala 3% Costa Rica 2% El Salvador 2% Mexico 3% American 2% Irish 2% German 2% English 2% Italian 1% European 1% African
Year of entry for the foreign-born population
4,153 2010 or later 5,619 2000 to 2009 5,171 1990 to 1999 5,916 Before 1990
There are
117 Medical Specialists in Zip Code 89108 .
Major facilities with environmental interests located in this zip code:
BERTHA RONZONE ELEMENTARY SCHOOL (5701 STACEY AVE. in LAS VEGAS, NV)
(Geographic Names Information System) (National Center for Education Statistics) - STATE ID-02-201 Organizations: CLARK CO SCH DIST (SCHOOL DISTRICT)
Alternative names: RONZONE, BERTHA ELEM
J HAROLD BRINLEY JUNIOR HIGH SCHOOL (2480 MAVERICK ST in LAS VEGAS, NV)
(Geographic Names Information System) (National Center for Education Statistics) - STATE ID-02-306 Organizations: CLARK CO SCH DIST (SCHOOL DISTRICT)
Alternative names: BRINLEY MIDSCH
R E TOBLER ELEMENTARY SCHOOL (6510 W. BUCKSKIN in LAS VEGAS, NV)
(Geographic Names Information System) (National Center for Education Statistics) - STATE ID-02-290 Organizations: CLARK CO SCH DIST (SCHOOL DISTRICT)
Alternative names: TOBLER, R.E. ELEM
J T MCWILLIAMS ELEMENTARY SCHOOL (1315 HIAWATHA ROAD in LAS VEGAS, NV)
(Geographic Names Information System) (National Center for Education Statistics) - STATE ID-02-218 Organizations: CLARK CO SCH DIST (SCHOOL DISTRICT)
Alternative names: MCWILLIAMS, J T ELEM
PAUL E CULLEY ELEMENTARY SCHOOL (1200 NORTH MALLARD in LAS VEGAS, NV)
(Geographic Names Information System) (National Center for Education Statistics) - STATE ID-02-233 Organizations: CLARK CO SCH DIST (SCHOOL DISTRICT)
Alternative names: CULLEY, PAUL ELEM
DORIS M REED ELEMENTARY SCHOOL (2501 WINWOOD in LAS VEGAS, NV)
(Geographic Names Information System) (National Center for Education Statistics) - STATE ID-02-295 Organizations: CLARK CO SCH DIST (SCHOOL DISTRICT)
Alternative names: REED, DORIS ELEM
LILLY AND WING FONG ELEMENTARY SCHOOL (2200 JAMES BILBRAY in LAS VEGAS, NV)
(Geographic Names Information System) (National Center for Education Statistics) - STATE ID-02-119 Organizations: CLARK CO SCH DIST (SCHOOL DISTRICT)
Alternative names: FONG, WING & LILLY ELEM
TWIN LAKES ELEMENTARY SCHOOL (3300 RIVERSIDE DRIVE in LAS VEGAS, NV)
(Geographic Names Information System) (National Center for Education Statistics) - STATE ID-02-243 Organizations: CLARK CO SCH DIST (SCHOOL DISTRICT)
MILFORD AUTOMOTIVE (1615 N DECATUR in LAS VEGAS, NV)
(Integrated Compliance Information System) - ICIS-09-1996-0018, FORMAL ENFORCEMENT ACTION
USDOI BLM LAS VEGAS (1496 N DECATUR BLVD in LAS VEGAS, NV)
HAZARDOUS WASTE BIENNIAL REPORTER (Resource Conservation and Recovery Act (tracking hazardous waste)) (Resource Conservation and Recovery Act (tracking hazardous waste)) Organizations: UNITED STATES GOVERNMENT (CONTACT/OWNER)
Alternative names: USDOI BUREAU OF LAND MANAGEMENT
REYNOLDS AUTOMOTIVE (4910 VEGAS DR in LAS VEGAS, NV)
(Resource Conservation and Recovery Act (tracking hazardous waste)) Organizations: DARRYL P TIEMAN (CONTACT/OWNER)
BORG-WARNER YORK DIVISION (5800 CARMEN BOULEVARD in LAS VEGAS, NV)
(Resource Conservation and Recovery Act (tracking hazardous waste)) Organizations: LEASED FACILITY (CONTACT/OWNER)
FRED HALL (5901 GOWAN RD in LAS VEGAS, NV)
(Resource Conservation and Recovery Act (tracking hazardous waste))
Housing units lacking complete plumbing facilities: 1.1%
Housing units lacking complete kitchen facilities: 1.5%
50.5% Utility gas 44.9% Electricity 2.0% Bottled, tank, or LP gas 1.2% No fuel used 0.9% Solar energy
Population in 1990: 46,924. Population change in the 1990s: +19,634 (+41.8%).
Place of birth for U.S.-born residents:
This state: 21,875Northeast: 3,878Midwest: 5,617South: 4,664West: 20,331
38% of the 89108 zip code residents lived in the same house 5 years ago.
Out of people who lived in different houses, 58% lived in this county.
Out of people who lived in different counties, 50% lived in Nevada.
86% of the 89108 zip code residents lived in the same house 1 year ago.
Out of people who lived in different houses, 73% moved from this county.
Out of people who lived in different houses, 2% moved from different county within same state.
Out of people who lived in different houses, 21% moved from different state.
Out of people who lived in different houses, 3% moved from abroad.
Private vs. public school enrollment:
Students in private schools in grades 1 to 8 (elementary and middle school): 702
Students in private schools in grades 9 to 12 (high school): 131
Students in private undergraduate colleges: 361
Occupation by median earnings in the past 12 months ($)
78,671 Computer and mathematical occupations 74,854 Law enforcement workers including supervisors 73,728 Life, physical, and social science occupations 73,018 Architecture and engineering occupations 60,289 Management occupations 54,663 Business and financial operations occupations
Companies with federal contracts located in this zip code:
REDSTONE DATA SYSTEM INC (5348 VEGAS DR STE 36 in LAS VEGAS, NV; small business)
$12,640 with Navy for ADP Components. Signed on 2006-05-31. Completion date: 2006-06-09.
Top industries in this zip code by the number of employees in 2005:
Construction: Site Preparation Contractors (over 1000 employees: 1 establishment, 20-49 employees: 1 establishment, 1-4 employees: 2 establishments)Accommodation and Food Services: Full-Service Restaurants (100-249: 3, 50-99: 7, 20-49: 2, 10-19: 3, 5-9: 2, 1-4: 9)Accommodation and Food Services: Limited-Service Restaurants (20-49: 9, 10-19: 7, 5-9: 3, 1-4: 7)Health Care and Social Assistance: Nursing Care Facilities (250-499: 1, 50-99: 1)Construction: Electrical Contractors (100-249: 1, 5-9: 1, 1-4: 4)
People in group quarters in 2010:
505 people in nursing facilities/skilled-nursing facilities
46 people in group homes intended for adults
8 people in residential treatment centers for adults
6 people in other noninstitutional facilities
2 people in workers' group living quarters and job corps centers
People in group quarters in 2000:
437 people in nursing homes
17 people in other noninstitutional group quarters
10 people in homes or halfway houses for drug/alcohol abuse
7 people in residential treatment centers for emotionally disturbed children
7 people in other group homes
Fatal accident statistics in 2014:
Fatal accident count: 1Vehicles involved in fatal accidents: 2Fatal accidents caused by drunken drivers: 0Fatalities: 1Persons involved in fatal accidents: 2Pedestrians involved in fatal accidents: 0
Fatal accident statistics in 2013:
Fatal accident count: 4Vehicles involved in fatal accidents: 7Fatal accidents caused by drunken drivers: 1Fatalities: 4Persons involved in fatal accidents: 7Pedestrians involved in fatal accidents: 1
Home Mortgage Disclosure Act Aggregated Statistics For Year 2009(Based on 15 full and 10 partial tracts) A) FHA, FSA/RHS & VA B) Conventional C) Refinancings D) Home Improvement Loans E) Loans on Dwellings For 5+ Families F) Non-occupant Loans on G) Loans On Manufactured Number Average Value Number Average Value Number Average Value Number Average Value Number Average Value Number Average Value Number Average Value
LOANS ORIGINATED 861 $102,154 337 $76,306 521 $151,863 30 $51,925 0 $0 220 $74,178 18 $121,757 APPLICATIONS APPROVED, NOT ACCEPTED 82 $103,605 34 $74,690 68 $150,795 13 $14,745 2 $139,970 31 $75,029 6 $162,138 APPLICATIONS DENIED 298 $109,739 166 $89,707 388 $140,470 89 $42,657 0 $0 141 $95,511 14 $90,568 APPLICATIONS WITHDRAWN 100 $119,442 74 $76,867 209 $145,764 18 $147,254 0 $0 59 $72,811 6 $105,955 FILES CLOSED FOR INCOMPLETENESS 43 $114,955 11 $69,176 46 $182,096 6 $52,027 0 $0 11 $89,535 0 $0
Aggregated Statistics For Year 2008(Based on 15 full and 10 partial tracts) A) FHA, FSA/RHS & VA B) Conventional C) Refinancings D) Home Improvement Loans E) Loans on Dwellings For 5+ Families F) Non-occupant Loans on G) Loans On Manufactured Number Average Value Number Average Value Number Average Value Number Average Value Number Average Value Number Average Value Number Average Value
LOANS ORIGINATED 615 $153,742 357 $132,215 713 $165,200 77 $54,877 6 $4,812,733 261 $124,868 34 $144,840 APPLICATIONS APPROVED, NOT ACCEPTED 54 $147,215 52 $144,130 170 $184,810 19 $41,982 0 $0 50 $153,206 10 $119,257 APPLICATIONS DENIED 196 $162,083 201 $162,026 1,076 $192,097 180 $71,860 0 $0 195 $134,736 18 $142,273 APPLICATIONS WITHDRAWN 63 $158,670 79 $157,741 330 $185,098 22 $114,882 0 $0 60 $136,332 8 $121,604 FILES CLOSED FOR INCOMPLETENESS 13 $166,043 26 $208,274 84 $203,893 9 $99,777 0 $0 20 $213,096 4 $161,305
Aggregated Statistics For Year 2007(Based on 15 full and 10 partial tracts) A) FHA, FSA/RHS & VA B) Conventional C) Refinancings D) Home Improvement Loans E) Loans on Dwellings For 5+ Families F) Non-occupant Loans on G) Loans On Manufactured Number Average Value Number Average Value Number Average Value Number Average Value Number Average Value Number Average Value Number Average Value
LOANS ORIGINATED 100 $194,053 1,284 $181,587 2,607 $181,756 254 $96,897 5 $14,159,418 607 $173,969 42 $164,896 APPLICATIONS APPROVED, NOT ACCEPTED 4 $193,428 270 $184,202 679 $191,872 80 $99,350 0 $0 130 $188,988 10 $221,598 APPLICATIONS DENIED 31 $216,773 810 $184,309 2,691 $199,257 289 $80,385 2 $1,299,740 539 $194,399 33 $118,330 APPLICATIONS WITHDRAWN 6 $190,167 252 $189,715 1,057 $195,734 52 $168,129 1 $33,962,880 182 $191,320 14 $163,866 FILES CLOSED FOR INCOMPLETENESS 8 $153,339 69 $185,828 366 $207,351 13 $66,438 0 $0 43 $221,713 8 $124,101
Aggregated Statistics For Year 2006(Based on 15 full and 10 partial tracts) A) FHA, FSA/RHS & VA B) Conventional C) Refinancings D) Home Improvement Loans E) Loans on Dwellings For 5+ Families F) Non-occupant Loans on G) Loans On Manufactured Number Average Value Number Average Value Number Average Value Number Average Value Number Average Value Number Average Value Number Average Value
LOANS ORIGINATED 89 $212,070 3,876 $145,625 4,325 $177,651 423 $115,066 6 $6,691,068 1,250 $163,004 81 $147,765 APPLICATIONS APPROVED, NOT ACCEPTED 9 $162,776 700 $158,044 881 $180,574 132 $109,476 0 $0 257 $178,160 12 $109,640 APPLICATIONS DENIED 26 $197,892 1,588 $163,781 2,697 $191,679 376 $79,702 0 $0 457 $182,654 49 $92,457 APPLICATIONS WITHDRAWN 10 $243,472 693 $159,811 2,127 $189,753 128 $141,528 8 $3,037,624 300 $157,336 12 $162,824 FILES CLOSED FOR INCOMPLETENESS 5 $181,750 174 $147,402 458 $188,995 15 $127,597 0 $0 76 $172,589 4 $130,342
Aggregated Statistics For Year 2005(Based on 15 full and 10 partial tracts) A) FHA, FSA/RHS & VA B) Conventional C) Refinancings D) Home Improvement Loans E) Loans on Dwellings For 5+ Families F) Non-occupant Loans on G) Loans On Manufactured Number Average Value Number Average Value Number Average Value Number Average Value Number Average Value Number Average Value Number Average Value
LOANS ORIGINATED 116 $186,252 6,580 $134,399 5,453 $166,977 498 $103,054 14 $12,374,036 2,265 $140,173 66 $118,325 APPLICATIONS APPROVED, NOT ACCEPTED 5 $191,732 1,126 $137,492 945 $168,986 110 $93,689 0 $0 362 $154,095 18 $142,234 APPLICATIONS DENIED 46 $198,320 1,819 $150,827 2,502 $173,822 522 $81,905 0 $0 620 $170,210 70 $102,657 APPLICATIONS WITHDRAWN 21 $179,662 1,337 $152,669 2,436 $169,544 309 $165,561 1 $1,290,100 436 $169,171 29 $105,912 FILES CLOSED FOR INCOMPLETENESS 3 $133,480 279 $148,295 420 $179,880 14 $115,121 0 $0 84 $192,520 4 $77,908
Aggregated Statistics For Year 2004(Based on 15 full and 10 partial tracts) A) FHA, FSA/RHS & VA B) Conventional C) Refinancings D) Home Improvement Loans E) Loans on Dwellings For 5+ Families F) Non-occupant Loans on G) Loans On Manufactured Number Average Value Number Average Value Number Average Value Number Average Value Number Average Value Number Average Value Number Average Value
LOANS ORIGINATED 275 $151,739 4,543 $134,428 4,922 $145,338 484 $97,190 10 $6,733,226 1,548 $137,752 71 $90,325 APPLICATIONS APPROVED, NOT ACCEPTED 31 $130,355 831 $132,975 1,073 $140,423 78 $71,392 4 $529,895 211 $142,931 15 $84,485 APPLICATIONS DENIED 87 $141,879 1,365 $135,377 2,309 $136,255 516 $47,358 1 $731,500 413 $136,656 55 $83,784 APPLICATIONS WITHDRAWN 55 $152,372 691 $137,722 1,625 $140,708 133 $70,345 0 $0 247 $147,144 17 $99,252 FILES CLOSED FOR INCOMPLETENESS 10 $131,761 199 $139,125 335 $151,100 30 $53,167 0 $0 65 $124,499 4 $127,848
Aggregated Statistics For Year 2003(Based on 15 full and 10 partial tracts) A) FHA, FSA/RHS & VA B) Conventional C) Refinancings D) Home Improvement Loans E) Loans on Dwellings For 5+ Families F) Non-occupant Loans on Number Average Value Number Average Value Number Average Value Number Average Value Number Average Value Number Average Value
LOANS ORIGINATED 839 $134,438 2,355 $118,940 5,879 $111,383 204 $22,087 3 $4,939,377 1,078 $108,163 APPLICATIONS APPROVED, NOT ACCEPTED 57 $129,878 492 $113,228 1,101 $113,301 56 $51,698 0 $0 219 $121,705 APPLICATIONS DENIED 208 $128,936 783 $117,402 2,860 $115,405 309 $28,222 1 $399,000 264 $121,128 APPLICATIONS WITHDRAWN 122 $134,267 348 $119,829 1,884 $117,527 71 $38,888 0 $0 175 $105,645 FILES CLOSED FOR INCOMPLETENESS 25 $130,723 105 $103,872 575 $137,714 11 $44,850 2 $2,998,800 36 $129,507
Aggregated Statistics For Year 2002(Based on 4 partial tracts) A) FHA, FSA/RHS & VA B) Conventional C) Refinancings D) Home Improvement Loans E) Loans on Dwellings For 5+ Families F) Non-occupant Loans on Number Average Value Number Average Value Number Average Value Number Average Value Number Average Value Number Average Value
LOANS ORIGINATED 86 $115,707 136 $98,831 323 $96,517 14 $29,059 2 $483,790 57 $88,368 APPLICATIONS APPROVED, NOT ACCEPTED 5 $76,892 22 $90,630 61 $93,625 4 $25,220 0 $0 4 $80,002 APPLICATIONS DENIED 22 $117,947 44 $98,005 192 $95,397 30 $23,290 0 $0 7 $83,397 APPLICATIONS WITHDRAWN 13 $112,951 14 $111,118 108 $105,975 6 $26,118 0 $0 3 $60,960 FILES CLOSED FOR INCOMPLETENESS 1 $85,120 9 $102,636 36 $122,687 3 $40,943 0 $0 4 $74,378
Aggregated Statistics For Year 2001(Based on 4 partial tracts) A) FHA, FSA/RHS & VA B) Conventional C) Refinancings D) Home Improvement Loans F) Non-occupant Loans on Number Average Value Number Average Value Number Average Value Number Average Value Number Average Value
LOANS ORIGINATED 80 $111,849 143 $109,183 305 $90,404 17 $21,360 49 $99,954 APPLICATIONS APPROVED, NOT ACCEPTED 9 $99,951 27 $95,939 55 $75,640 5 $18,388 6 $119,442 APPLICATIONS DENIED 20 $110,183 39 $89,214 223 $67,928 43 $17,933 11 $68,867 APPLICATIONS WITHDRAWN 13 $111,458 19 $121,193 89 $83,428 3 $19,730 10 $79,970 FILES CLOSED FOR INCOMPLETENESS 5 $121,740 9 $112,178 34 $107,375 1 $32,230 3 $68,747
Aggregated Statistics For Year 2000(Based on 4 partial tracts) A) FHA, FSA/RHS & VA B) Conventional C) Refinancings D) Home Improvement Loans F) Non-occupant Loans on Number Average Value Number Average Value Number Average Value Number Average Value Number Average Value
LOANS ORIGINATED 107 $107,604 161 $118,887 112 $75,725 27 $22,902 29 $90,088 APPLICATIONS APPROVED, NOT ACCEPTED 10 $105,164 48 $83,997 29 $80,003 17 $29,082 4 $72,030 APPLICATIONS DENIED 14 $111,648 152 $68,784 141 $65,150 56 $22,217 8 $81,219 APPLICATIONS WITHDRAWN 9 $106,140 40 $104,230 40 $64,628 8 $20,969 7 $125,427 FILES CLOSED FOR INCOMPLETENESS 5 $99,912 8 $91,815 18 $92,254 1 $32,230 1 $62,630
Aggregated Statistics For Year 1999(Based on 1 full and 8 partial tracts) A) FHA, FSA/RHS & VA B) Conventional C) Refinancings D) Home Improvement Loans E) Loans on Dwellings For 5+ Families F) Non-occupant Loans on Number Average Value Number Average Value Number Average Value Number Average Value Number Average Value Number Average Value
LOANS ORIGINATED 588 $107,832 684 $112,058 958 $89,346 195 $21,432 5 $1,923,112 193 $92,833 APPLICATIONS APPROVED, NOT ACCEPTED 17 $109,693 118 $88,746 210 $89,991 87 $25,113 0 $0 25 $104,399 APPLICATIONS DENIED 86 $106,989 335 $78,093 531 $86,827 240 $21,012 1 $878,210 63 $98,833 APPLICATIONS WITHDRAWN 68 $109,127 144 $108,463 394 $92,072 22 $50,921 0 $0 34 $97,590 FILES CLOSED FOR INCOMPLETENESS 17 $101,953 30 $92,945 102 $91,874 6 $25,183 0 $0 13 $87,066
Private Mortgage Insurance Companies Aggregated Statistics For Year 2009(Based on 13 full and 10 partial tracts) A) Conventional B) Refinancings C) Non-occupant Loans on Number Average Value Number Average Value Number Average Value
LOANS ORIGINATED 33 $92,467 5 $252,216 10 $80,465 APPLICATIONS APPROVED, NOT ACCEPTED 15 $97,131 2 $128,565 4 $63,412 APPLICATIONS DENIED 16 $116,661 8 $128,558 1 $29,930 APPLICATIONS WITHDRAWN 0 $0 0 $0 0 $0 FILES CLOSED FOR INCOMPLETENESS 4 $124,292 2 $220,735 2 $143,605
Aggregated Statistics For Year 2008(Based on 15 full and 10 partial tracts) A) Conventional B) Refinancings C) Non-occupant Loans on Number Average Value Number Average Value Number Average Value
LOANS ORIGINATED 150 $191,751 124 $202,797 36 $179,778 APPLICATIONS APPROVED, NOT ACCEPTED 125 $228,138 127 $231,776 25 $200,180 APPLICATIONS DENIED 14 $116,958 16 $215,974 7 $143,550 APPLICATIONS WITHDRAWN 10 $244,242 5 $132,618 4 $249,125 FILES CLOSED FOR INCOMPLETENESS 5 $192,678 5 $218,360 2 $255,665
Aggregated Statistics For Year 2007(Based on 15 full and 10 partial tracts) A) Conventional B) Refinancings C) Non-occupant Loans on Number Average Value Number Average Value Number Average Value
LOANS ORIGINATED 473 $215,905 338 $222,878 81 $196,559 APPLICATIONS APPROVED, NOT ACCEPTED 78 $217,002 91 $228,543 23 $206,424 APPLICATIONS DENIED 30 $211,100 23 $221,020 20 $207,446 APPLICATIONS WITHDRAWN 30 $214,675 32 $236,251 12 $173,242 FILES CLOSED FOR INCOMPLETENESS 2 $223,205 0 $0 0 $0
Aggregated Statistics For Year 2006(Based on 15 full and 10 partial tracts) A) Conventional B) Refinancings C) Non-occupant Loans on D) Loans On Manufactured Number Average Value Number Average Value Number Average Value Number Average Value
LOANS ORIGINATED 236 $211,336 188 $226,052 59 $182,014 0 $0 APPLICATIONS APPROVED, NOT ACCEPTED 64 $250,808 54 $238,110 21 $197,344 2 $159,810 APPLICATIONS DENIED 5 $200,864 0 $0 0 $0 0 $0 APPLICATIONS WITHDRAWN 10 $197,455 19 $211,987 3 $118,983 0 $0 FILES CLOSED FOR INCOMPLETENESS 5 $154,468 3 $182,957 3 $99,480 0 $0
Aggregated Statistics For Year 2005(Based on 15 full and 10 partial tracts) A) Conventional B) Refinancings C) Non-occupant Loans on D) Loans On Manufactured Number Average Value Number Average Value Number Average Value Number Average Value
LOANS ORIGINATED 531 $178,131 202 $197,513 148 $152,978 4 $141,830 APPLICATIONS APPROVED, NOT ACCEPTED 80 $180,745 33 $189,209 31 $165,801 0 $0 APPLICATIONS DENIED 12 $210,848 10 $276,402 8 $213,160 0 $0 APPLICATIONS WITHDRAWN 34 $191,055 8 $175,572 15 $167,793 0 $0 FILES CLOSED FOR INCOMPLETENESS 2 $174,930 3 $194,287 0 $0 0 $0
Aggregated Statistics For Year 2004(Based on 15 full and 10 partial tracts) A) Conventional B) Refinancings C) Non-occupant Loans on D) Loans On Manufactured Number Average Value Number Average Value Number Average Value Number Average Value
LOANS ORIGINATED 781 $163,076 308 $155,365 246 $142,122 8 $99,630 APPLICATIONS APPROVED, NOT ACCEPTED 137 $157,664 94 $138,962 49 $151,626 3 $67,280 APPLICATIONS DENIED 19 $167,224 12 $141,074 6 $140,448 0 $0 APPLICATIONS WITHDRAWN 40 $217,540 21 $140,446 10 $132,137 0 $0 FILES CLOSED FOR INCOMPLETENESS 13 $164,878 8 $157,826 4 $184,240 0 $0
Aggregated Statistics For Year 2003(Based on 15 full and 10 partial tracts) A) Conventional B) Refinancings C) Non-occupant Loans on Number Average Value Number Average Value Number Average Value
LOANS ORIGINATED 803 $134,915 731 $130,150 238 $124,906 APPLICATIONS APPROVED, NOT ACCEPTED 118 $144,135 173 $130,703 45 $130,437 APPLICATIONS DENIED 30 $143,675 24 $146,164 14 $160,737 APPLICATIONS WITHDRAWN 47 $132,581 32 $121,146 19 $107,591 FILES CLOSED FOR INCOMPLETENESS 6 $129,623 3 $127,277 4 $122,935
Aggregated Statistics For Year 2002(Based on 4 partial tracts) A) Conventional B) Refinancings C) Non-occupant Loans on Number Average Value Number Average Value Number Average Value
LOANS ORIGINATED 71 $131,674 47 $120,650 23 $105,892 APPLICATIONS APPROVED, NOT ACCEPTED 8 $151,414 12 $151,092 3 $90,233 APPLICATIONS DENIED 3 $98,273 1 $75,810 2 $107,400 APPLICATIONS WITHDRAWN 4 $116,545 2 $114,655 1 $82,890 FILES CLOSED FOR INCOMPLETENESS 1 $202,620 0 $0 0 $0
Aggregated Statistics For Year 2001(Based on 4 partial tracts) A) Conventional B) Refinancings C) Non-occupant Loans on Number Average Value Number Average Value Number Average Value
LOANS ORIGINATED 53 $131,275 33 $118,611 12 $105,458 APPLICATIONS APPROVED, NOT ACCEPTED 7 $131,904 4 $109,768 2 $159,750 APPLICATIONS DENIED 2 $146,210 1 $83,130 1 $90,260 APPLICATIONS WITHDRAWN 0 $0 2 $126,245 0 $0 FILES CLOSED FOR INCOMPLETENESS 2 $75,565 0 $0 1 $93,940
Aggregated Statistics For Year 2000(Based on 4 partial tracts) A) Conventional B) Refinancings C) Non-occupant Loans on Number Average Value Number Average Value Number Average Value
LOANS ORIGINATED 46 $107,649 8 $103,588 6 $87,278 APPLICATIONS APPROVED, NOT ACCEPTED 7 $93,593 5 $115,120 3 $93,297 APPLICATIONS DENIED 2 $135,775 0 $0 0 $0 APPLICATIONS WITHDRAWN 3 $87,117 0 $0 1 $40,570 FILES CLOSED FOR INCOMPLETENESS 1 $82,890 0 $0 0 $0
Aggregated Statistics For Year 1999(Based on 1 full and 8 partial tracts) A) Conventional B) Refinancings C) Non-occupant Loans on Number Average Value Number Average Value Number Average Value
LOANS ORIGINATED 273 $118,066 154 $115,742 41 $101,634 APPLICATIONS APPROVED, NOT ACCEPTED 21 $120,651 34 $120,504 7 $100,984 APPLICATIONS DENIED 27 $117,118 14 $112,959 7 $102,447 APPLICATIONS WITHDRAWN 10 $122,644 8 $112,430 2 $88,230 FILES CLOSED FOR INCOMPLETENESS 3 $106,963 4 $134,720 1 $163,720
2002 - 2018 National Fire Incident Reporting System (NFIRS) incidents See full 2006 National Fire Incident Reporting System statistics for zip code 89108, Nevada
Most common first names in zip code 89108 among deceased individuals Name Count Lived (average)
John 165 72.7 years Mary 149 77.4 years Robert 149 69.9 years William 139 71.8 years James 133 69.3 years Charles 86 71.8 years Richard 83 66.5 years Joseph 82 72.6 years George 80 73.2 years Dorothy 76 76.3 years
Most common last names in zip code 89108 among deceased individuals Last name Count Lived (average)
Smith 73 73.9 years Johnson 47 74.3 years Brown 37 67.9 years Williams 36 74.9 years Wilson 35 71.8 years Davis 32 72.3 years Jones 27 74.5 years Miller 25 73.0 years Thompson 23 73.5 years Anderson 23 71.7 years
Businesses in zip code 89108
Name Count Name Count
24 Hour Fitness 1 McDonald's 1 7-Eleven 4 Men's Wearhouse 1 AT&T 1 Nike 3 Applebee's 1 Office Depot 1 AutoZone 2 OfficeMax 1 Avenue 1 Old Navy 1 Baja Fresh Mexican Grill 1 Olive Garden 1 Barnes & Noble 1 Outback 1 Bed Bath & Beyond 1 Outback Steakhouse 1 Blockbuster 1 Papa John's Pizza 1 CVS 1 Payless 1 Carl\s Jr. 2 PetSmart 1 Circle K 2 Pier 1 Imports 1 Cricket Wireless 3 Pizza Hut 1 Curves 1 Popeyes 1 Famous Footwear 1 RadioShack 1 Fashion Bug 1 SONIC Drive-In 1 FedEx 2 Sprint Nextel 1 GNC 1 Subway 3 GameStop 1 T-Mobile 2 H&R Block 2 Taco Bell 2 IHOP 1 Toys"R"Us 1 KFC 2 U-Haul 1 Kroger 3 UPS 3 Little Caesars Pizza 2 Walgreens 2 Marriott 1 Walmart 2 Marshalls 1 Wendy's 1

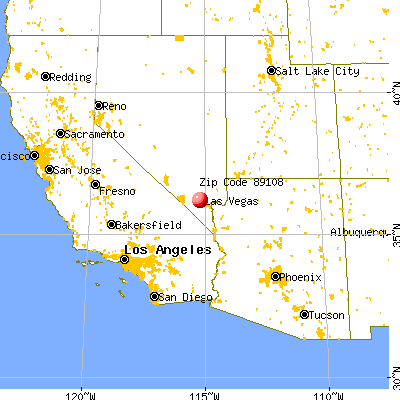


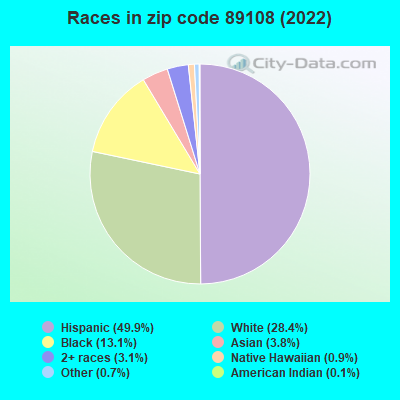


 Nearest zip codes: 89107, 89128, 89130, 89032, 89146, 89106.
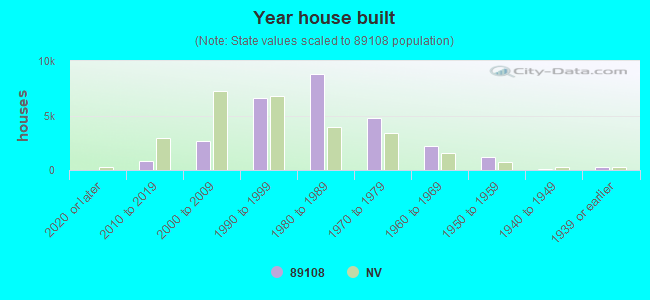

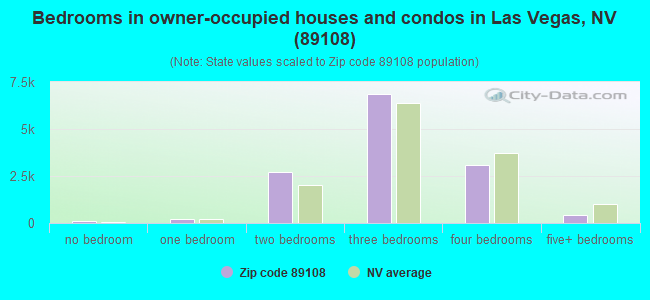
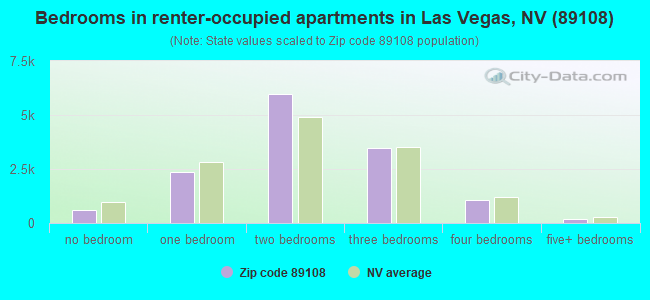
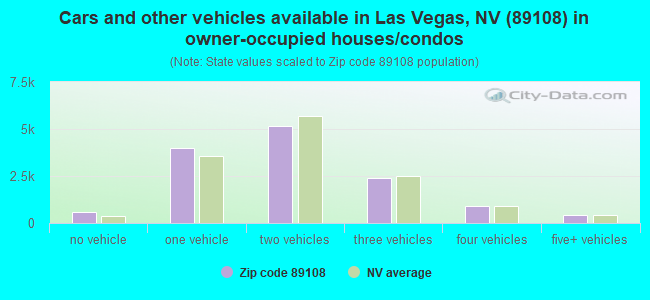
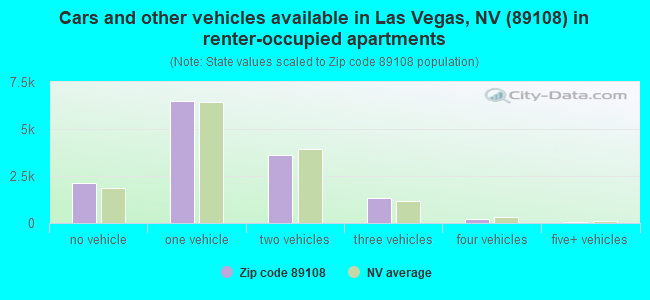


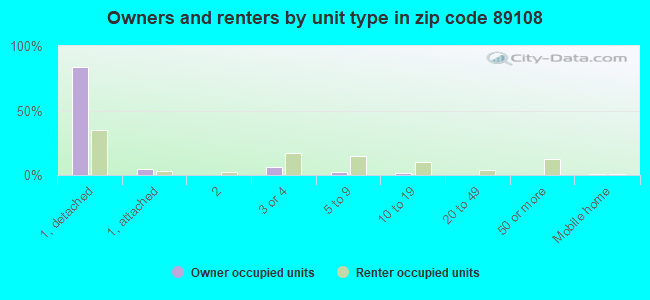
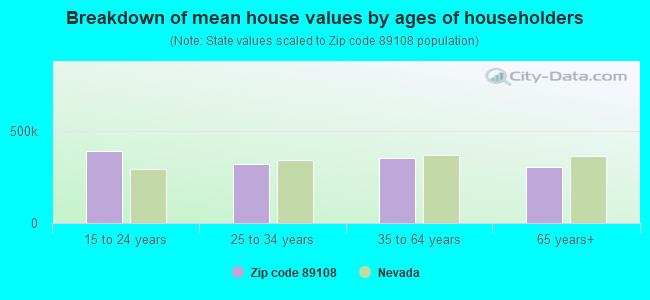


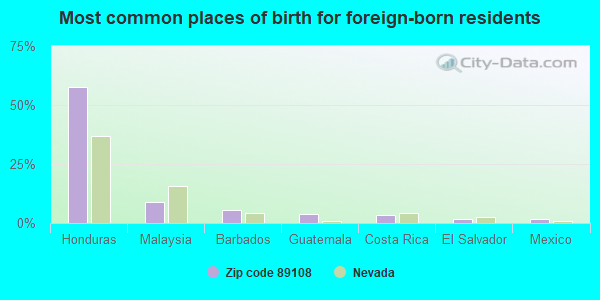
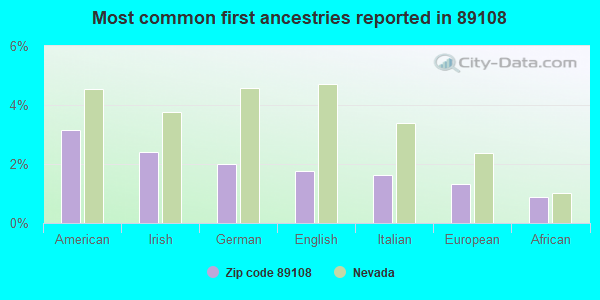
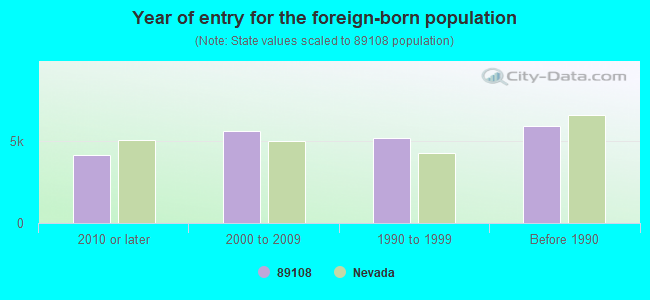


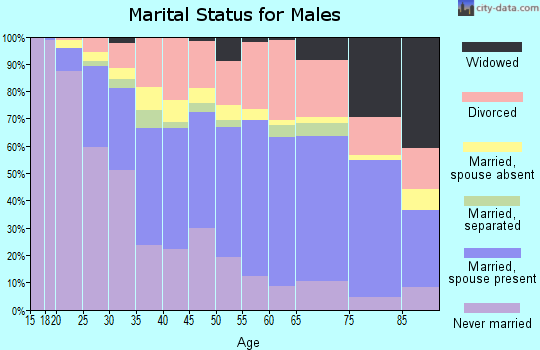
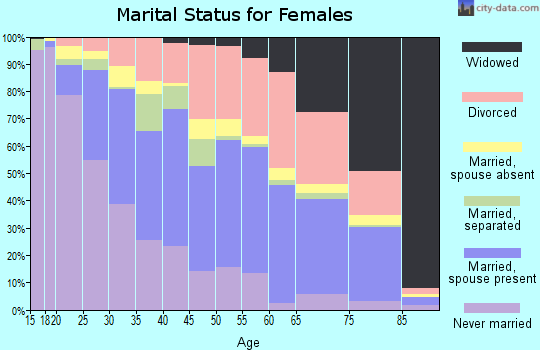
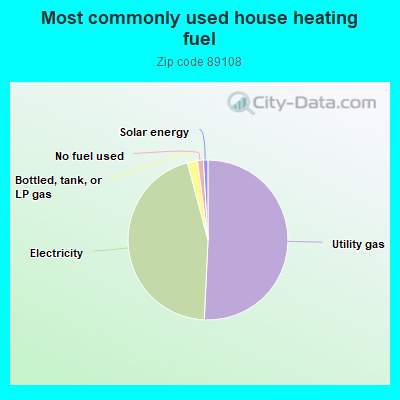
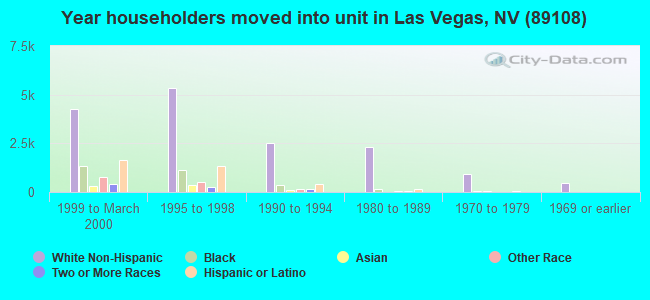
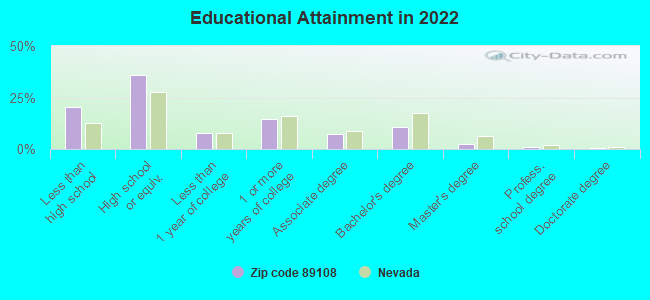

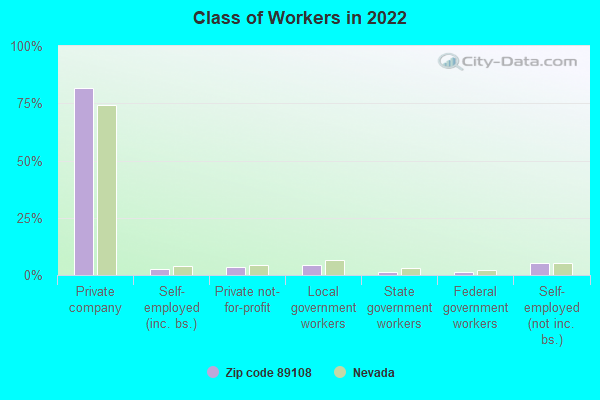
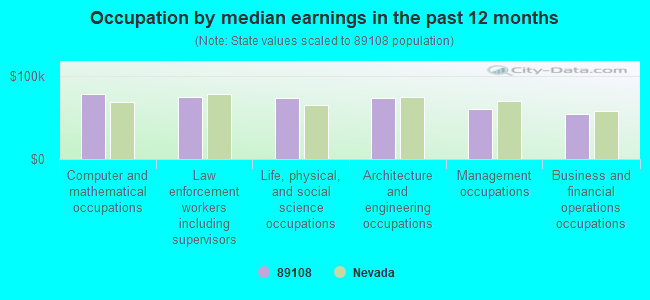
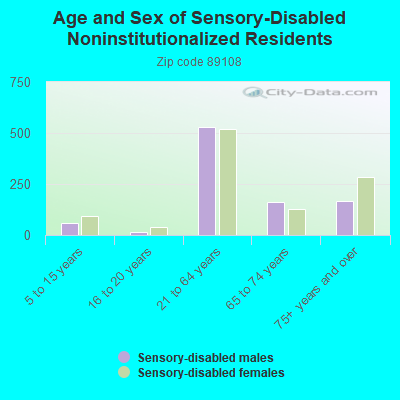
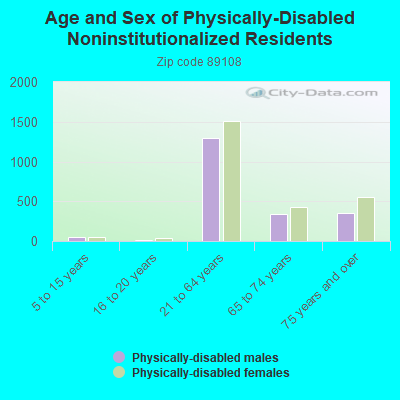
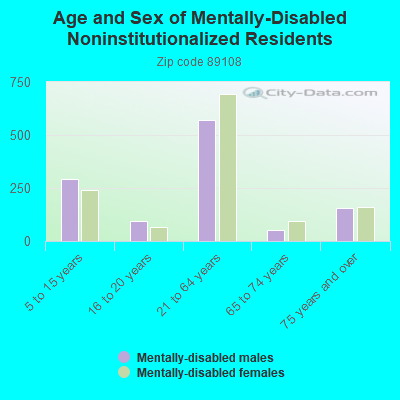

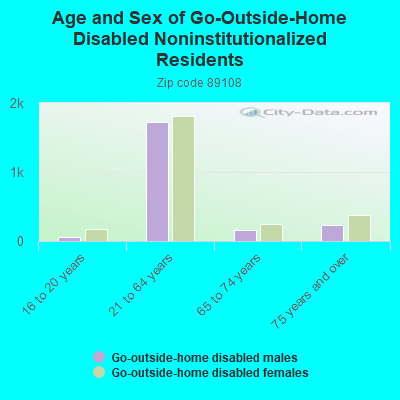
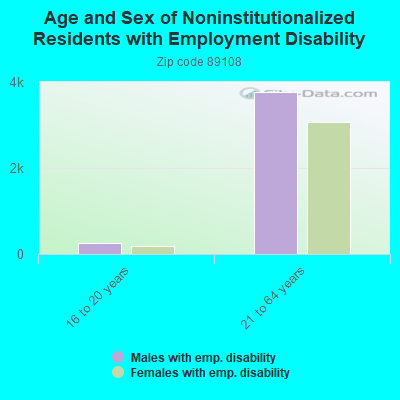
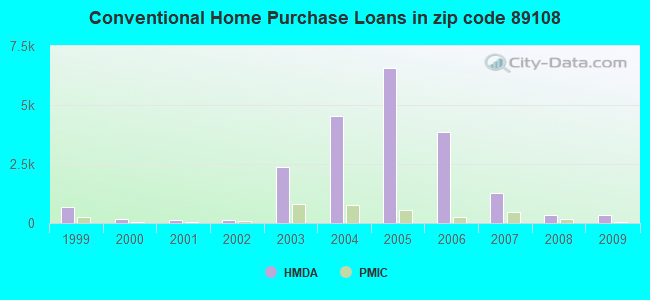
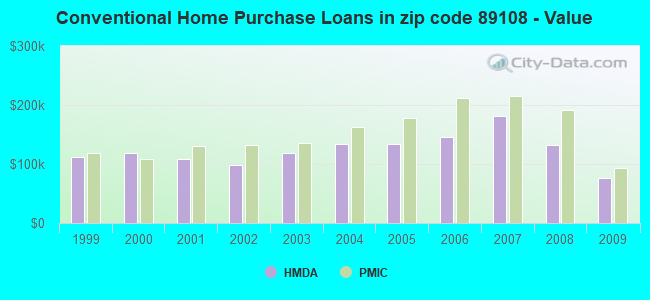
 According to the data from the years 2002 - 2018 the average number of fires per year is 193. The highest number of fires - 303 took place in 2017, and the least - 0 in 2003. The data has a rising trend.
 When looking into fire subcategories, the most incidents belonged to: Outside Fires (49.2%), and Structure Fires (31.2%).