Estimated zip code population in 2022: 39,404 Zip code population in 2010: 35,669 Zip code population in 2000: 40,538
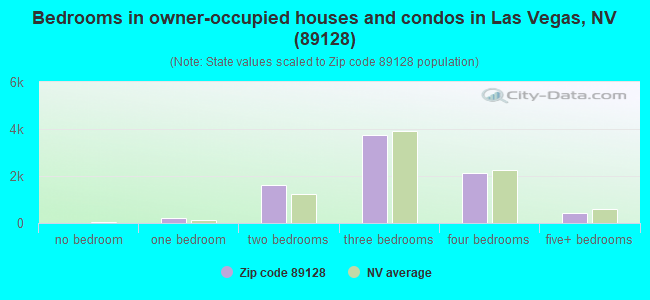
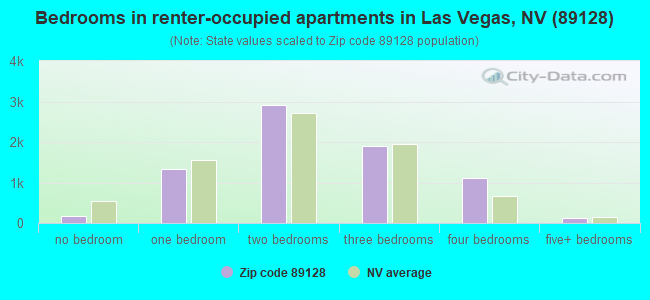
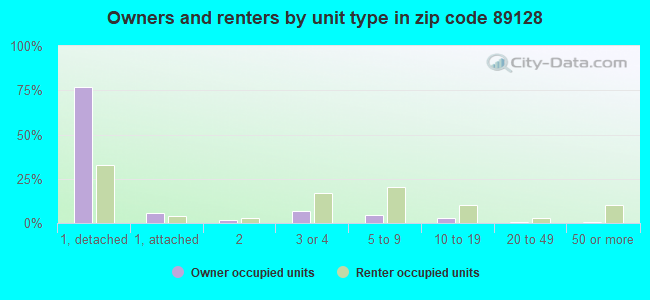
Houses and condos: 17,199 Renter-occupied apartments: 7,619
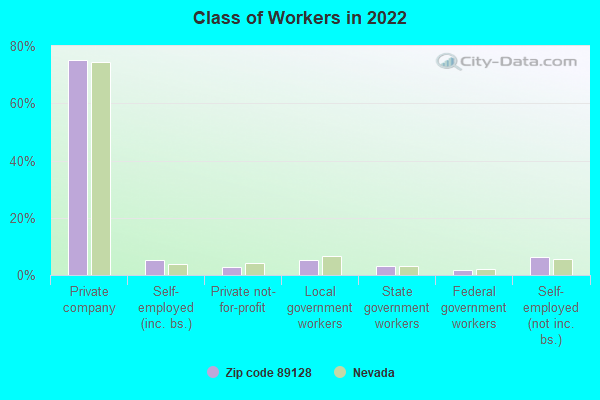
% of renters here:
48%
State:
40%
March 2022 cost of living index in zip code 89128: 99.3 (near average, U.S. average is 100)
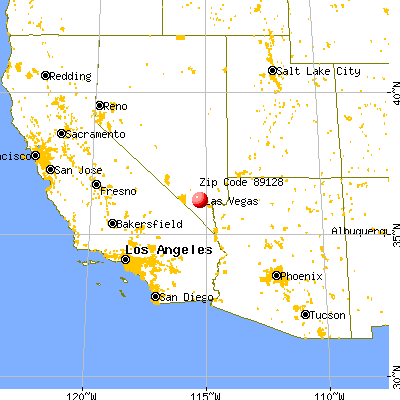
Land area: 6.0 sq. mi. Water area: 0.0 sq. mi.
Population density: 6,567 people per square mile
(high).
OSM Map
General Map
Google Map
MSN Map
OSM Map
General Map
Google Map
MSN Map
OSM Map
General Map
Google Map
MSN Map
OSM Map
General Map
Google Map
MSN Map
Please wait while loading the map...
Real estate property taxes paid for housing units in 2022:
This zip code:
0.5% ($1,807)
Nevada:
0.4% ($1,889)
Median real estate property taxes paid for housing units with mortgages in 2022: $1,801 (0.4%) Median real estate property taxes paid for housing units with no mortgage in 2022: $1,825 (0.5%)
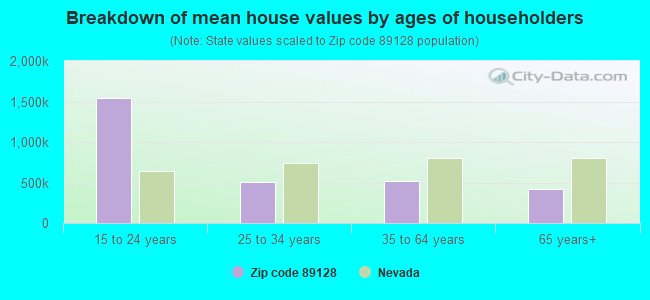
Estimated median house/condo value in 2022: $397,254
89128:
$397,254
Nevada:
$434,700
According to our research of Nevada and other state lists, there were 71 registered sex offenders living in 89128 zip code as of April 27, 2024. The ratio of all residents to sex offenders in zip code 89128 is 530 to 1. The ratio of registered sex offenders to all residents in this zip code is lower than the state average.
Median resident age:
This zip code:
39.2 years
Nevada median age:
39.0 years
Average household size:
This zip code:
2.5 people
Nevada:
2.6 people
Averages for the 2020 tax year for zip code 89128, filed in 2021:
Average Adjusted Gross Income (AGI) in 2020: $59,669 (Individual Income Tax Returns)
Here:
$59,669
State:
$78,964
Salary/wage: $46,917 (reported on 80.0% of returns)
Here:
$46,917
State:
$54,472
(% of AGI for various income ranges: 1132.4% for AGIs below $25k, 3438.8% for AGIs $25k-50k, 6487.3% for AGIs $50k-75k, 9306.1% for AGIs $75k-100k, 17390.1% for AGIs $100k-200k, 68741.8% for AGIs over 200k)
Taxable interest for individuals: $1,637 (reported on 21.4% of returns)
This zip code:
$1,637
Nevada:
$3,521
(% of AGI for various income ranges: 10.7% for AGIs below $25k, 16.8% for AGIs $25k-50k, 29.1% for AGIs $50k-75k, 70.1% for AGIs $75k-100k, 145.1% for AGIs $100k-200k, 1611.2% for AGIs over 200k)
Ordinary dividends: $5,425 (reported on 13.5% of returns)
Here:
$5,425
State:
$13,390
(% of AGI for various income ranges: 15.0% for AGIs below $25k, 24.8% for AGIs $25k-50k, 65.0% for AGIs $50k-75k, 125.5% for AGIs $75k-100k, 303.6% for AGIs $100k-200k, 3960.6% for AGIs over 200k)
Net capital gain/loss in AGI: +$31,434 (reported on 14.5% of returns)
Here:
+$31,434
State:
+$63,025
(% of AGI for various income ranges: 4.0% for AGIs below $25k, 20.7% for AGIs $25k-50k, 74.4% for AGIs $50k-75k, 214.6% for AGIs $75k-100k, 743.8% for AGIs $100k-200k, 44905.3% for AGIs over 200k)
Profit/loss from business: +$8,413 (reported on 18.2% of returns)
Here:
+$8,413
State:
+$11,500
(% of AGI for various income ranges: 108.9% for AGIs below $25k, 127.8% for AGIs $25k-50k, 215.3% for AGIs $50k-75k, 251.4% for AGIs $75k-100k, 563.5% for AGIs $100k-200k, 3612.4% for AGIs over 200k)
Taxable individual retirement arrangement distribution: $22,199 (reported on 6.4% of returns)
89128:
$22,199
Nevada:
$23,628
(% of AGI for various income ranges: 37.1% for AGIs below $25k, 58.1% for AGIs $25k-50k, 150.6% for AGIs $50k-75k, 400.3% for AGIs $75k-100k, 693.5% for AGIs $100k-200k, 5337.6% for AGIs over 200k)
Self-employed (Keogh) retirement plans: $21,660 (reported on 0.3% of returns)
89128:
$21,660
Nevada:
$26,634
(% of AGI for various income ranges: 50.4% for AGIs $75k-100k, 352.4% for AGIs over 200k)
Total itemized deductions: $34,113 (reported on 7.0% of returns)
Here:
$34,113
State:
$44,173
(% of AGI for various income ranges: 36.5% for AGIs below $25k, 122.7% for AGIs $25k-50k, 312.5% for AGIs $50k-75k, 636.0% for AGIs $75k-100k, 1103.0% for AGIs $100k-200k, 9006.5% for AGIs over 200k)
Charity contributions: $7,771 (reported on 5.6% of returns)
Here:
$7,771
State:
$12,589
(% of AGI for various income ranges: 2.3% for AGIs below $25k, 14.8% for AGIs $25k-50k, 49.5% for AGIs $50k-75k, 102.9% for AGIs $75k-100k, 204.1% for AGIs $100k-200k, 2125.3% for AGIs over 200k)
Taxes paid: $5,216 (reported on 6.9% of returns)
89128:
$5,216
State:
$6,112
(% of AGI for various income ranges: 4.1% for AGIs below $25k, 21.5% for AGIs $25k-50k, 53.2% for AGIs $50k-75k, 113.2% for AGIs $75k-100k, 188.9% for AGIs $100k-200k, 1004.7% for AGIs over 200k)
Earned income credit: $2,180 (reported on 17.6% of returns)
Here:
$2,180
State:
$2,214
(% of AGI for various income ranges: 95.7% for AGIs below $25k, 61.3% for AGIs $25k-50k, 0.8% for AGIs $50k-75k)
Percentage of individuals using paid preparers for their 2020 taxes: 92.9%
Here:
93%
State:
93%
(% for various income ranges: 92.5% for AGIs below $25k, 94.2% for AGIs $25k-50k, 91.9% for AGIs $50k-75k, 92.6% for AGIs $75k-100k, 92.2% for AGIs $100k-200k, 93.5% for AGIs over 200k)
Averages for the 2012 tax year for zip code 89128, filed in 2013:
Average Adjusted Gross Income (AGI) in 2012: $52,870 (Individual Income Tax Returns)
Here:
$52,870
State:
$61,164
Salary/wage: $43,986 (reported on 83.2% of returns)
Here:
$43,986
State:
$45,924
(% of AGI for various income ranges: 73.1% for AGIs below $25k, 83.2% for AGIs $25k-50k, 78.8% for AGIs $50k-75k, 75.7% for AGIs $75k-100k, 71.4% for AGIs $100k-200k, 40.7% for AGIs over 200k)
Taxable interest for individuals: $1,830 (reported on 23.7% of returns)
This zip code:
$1,830
Nevada:
$3,137
(% of AGI for various income ranges: 0.9% for AGIs below $25k, 0.6% for AGIs $25k-50k, 0.5% for AGIs $50k-75k, 0.4% for AGIs $75k-100k, 0.7% for AGIs $100k-200k, 1.6% for AGIs over 200k)
Ordinary dividends: $6,171 (reported on 14.1% of returns)
Here:
$6,171
State:
$11,762
(% of AGI for various income ranges: 2.0% for AGIs below $25k, 1.0% for AGIs $25k-50k, 0.8% for AGIs $50k-75k, 0.8% for AGIs $75k-100k, 1.5% for AGIs $100k-200k, 3.3% for AGIs over 200k)
Net capital gain/loss in AGI: +$17,761 (reported on 12.5% of returns)
Here:
+$17,761
State:
+$33,127
(% of AGI for various income ranges: 0.2% for AGIs $50k-75k, 0.7% for AGIs $75k-100k, 0.9% for AGIs $100k-200k, 18.7% for AGIs over 200k)
Profit/loss from business: +$11,954 (reported on 14.7% of returns)
Here:
+$11,954
State:
+$12,567
(% of AGI for various income ranges: 9.2% for AGIs below $25k, 2.3% for AGIs $25k-50k, 2.3% for AGIs $50k-75k, 2.6% for AGIs $75k-100k, 2.5% for AGIs $100k-200k, 3.7% for AGIs over 200k)
Taxable individual retirement arrangement distribution: $17,607 (reported on 7.8% of returns)
89128:
$17,607
Nevada:
$20,808
(% of AGI for various income ranges: 2.5% for AGIs below $25k, 1.5% for AGIs $25k-50k, 2.1% for AGIs $50k-75k, 2.8% for AGIs $75k-100k, 3.6% for AGIs $100k-200k, 2.8% for AGIs over 200k)
Self-employment retirement plans: $19,400 (reported on 0.3% of returns)
89128:
$19,400
Nevada:
$22,197
Total itemized deductions: $22,129 (22% of AGI, reported on 26.8% of returns)
Here:
$22,129
State:
$26,148
Here:
22.0% of AGI
State:
20.0% of AGI
(% of AGI for various income ranges: 8.2% for AGIs below $25k, 10.0% for AGIs $25k-50k, 11.5% for AGIs $50k-75k, 11.8% for AGIs $75k-100k, 13.3% for AGIs $100k-200k, 11.0% for AGIs over 200k)
Charity contributions: $3,333 (reported on 22.7% of returns)
Here:
$3,333
State:
$4,329
(% of AGI for various income ranges: 0.6% for AGIs below $25k, 1.1% for AGIs $25k-50k, 1.4% for AGIs $50k-75k, 1.5% for AGIs $75k-100k, 1.8% for AGIs $100k-200k, 1.7% for AGIs over 200k)
Taxes paid: $4,099 (reported on 26.6% of returns)
89128:
$4,099
State:
$5,116
(% of AGI for various income ranges: 1.5% for AGIs below $25k, 1.7% for AGIs $25k-50k, 2.0% for AGIs $50k-75k, 2.2% for AGIs $75k-100k, 2.5% for AGIs $100k-200k, 2.1% for AGIs over 200k)
Earned income credit: $2,210 (reported on 19.3% of returns)
Here:
$2,210
State:
$2,279
(% of AGI for various income ranges: 6.2% for AGIs below $25k, 1.1% for AGIs $25k-50k)
Percentage of individuals using paid preparers for their 2012 taxes: 53.4%
Here:
53%
State:
55%
(% for various income ranges: 50.5% for AGIs below $25k, 51.5% for AGIs $25k-50k, 54.4% for AGIs $50k-75k, 57.3% for AGIs $75k-100k, 61.2% for AGIs $100k-200k, 77.5% for AGIs over 200k)
Averages for the 2004 tax year for zip code 89128, filed in 2005:
Average Adjusted Gross Income (AGI) in 2004: $53,758 (Individual Income Tax Returns)
Here:
$53,758
State:
$58,367
Salary/wage: $43,847 (reported on 85.2% of returns)
Here:
$43,847
State:
$42,695
(% of AGI for various income ranges: 102.4% for AGIs below $10k, 79.6% for AGIs $10k-25k, 84.5% for AGIs $25k-50k, 80.6% for AGIs $50k-75k, 78.8% for AGIs $75k-100k, 52.7% for AGIs over 100k)
Taxable interest for individuals: $3,248 (reported on 35.6% of returns)
This zip code:
$3,248
Nevada:
$3,867
(% of AGI for various income ranges: 5.8% for AGIs below $10k, 1.7% for AGIs $10k-25k, 1.0% for AGIs $25k-50k, 1.2% for AGIs $50k-75k, 1.4% for AGIs $75k-100k, 3.2% for AGIs over 100k)
Taxable dividends: $3,919 (reported on 18.9% of returns)
Here:
$3,919
State:
$5,770
(% of AGI for various income ranges: 3.5% for AGIs below $10k, 1.2% for AGIs $10k-25k, 0.8% for AGIs $25k-50k, 0.7% for AGIs $50k-75k, 0.9% for AGIs $75k-100k, 2.1% for AGIs over 100k)
Net capital gain/loss: +$21,271 (reported on 17.6% of returns)
Here:
+$21,271
State:
+$50,644
(% of AGI for various income ranges: -1.7% for AGIs below $10k, 0.1% for AGIs $10k-25k, 0.6% for AGIs $25k-50k, 0.8% for AGIs $50k-75k, 1.8% for AGIs $75k-100k, 15.3% for AGIs over 100k)
Profit/loss from business: +$13,406 (reported on 14.3% of returns)
Here:
+$13,406
State:
+$13,618
(% of AGI for various income ranges: 3.7% for AGIs below $10k, 4.4% for AGIs $10k-25k, 1.9% for AGIs $25k-50k, 2.1% for AGIs $50k-75k, 3.4% for AGIs $75k-100k, 4.9% for AGIs over 100k)
IRA payment deduction: $3,018 (reported on 2.3% of returns)
89128:
$3,018
Nevada:
$3,054
(% of AGI for various income ranges: 0.3% for AGIs below $10k, 0.2% for AGIs $10k-25k, 0.2% for AGIs $25k-50k, 0.1% for AGIs $50k-75k, 0.2% for AGIs $75k-100k, 0.1% for AGIs over 100k)
Self-employed pension: $15,521 (reported on 0.7% of returns)
Here:
$15,521
Nevada:
$16,706
(% of AGI for various income ranges: 0.3% for AGIs below $10k, 0.0% for AGIs $25k-50k, 0.1% for AGIs $50k-75k, 0.2% for AGIs $75k-100k, 0.4% for AGIs over 100k)
Total itemized deductions: $20,423 (24% of AGI, reported on 42.0% of returns)
Here:
$20,423
State:
$22,990
Here:
23.8% of AGI
State:
21.8% of AGI
(% of AGI for various income ranges: 19.4% for AGIs below $10k, 14.5% for AGIs $10k-25k, 16.2% for AGIs $25k-50k, 18.4% for AGIs $50k-75k, 18.9% for AGIs $75k-100k, 14.1% for AGIs over 100k)
Charity contributions deductions: $2,946 (3% of AGI, reported on 36.9% of returns)
Here:
$2,946
State:
$3,443
Here:
3.3% of AGI
State:
3.1% of AGI
(% of AGI for various income ranges: 0.7% for AGIs below $10k, 1.1% for AGIs $10k-25k, 1.5% for AGIs $25k-50k, 2.0% for AGIs $50k-75k, 2.3% for AGIs $75k-100k, 2.4% for AGIs over 100k)
Total tax: $8,728 (reported on 79.0% of returns)
89128:
$8,728
State:
$10,585
(% of AGI for various income ranges: 3.2% for AGIs below $10k, 4.2% for AGIs $10k-25k, 7.0% for AGIs $25k-50k, 9.5% for AGIs $50k-75k, 11.0% for AGIs $75k-100k, 19.2% for AGIs over 100k)
Earned income credit: $1,650 (reported on 12.7% of returns)
Here:
$1,650
State:
$1,676
Percentage of individuals using paid preparers for their 2004 taxes: 56.8%
Here:
57%
State:
60%
(% for various income ranges: 50.3% for AGIs below $10k, 55.7% for AGIs $10k-25k, 54.6% for AGIs $25k-50k, 58.7% for AGIs $50k-75k, 61.3% for AGIs $75k-100k, 68.5% for AGIs over 100k)
Likely homosexual households (counted as self-reported same-sex unmarried-partner households)
Lesbian couples: 0.2% of all households
Gay men: 0.2% of all households
Household received Food Stamps/SNAP in the past 12 months: 1,635 Household did not receive Food Stamps/SNAP in the past 12 months: 14,187
Women who had a birth in the past 12 months: 477 (453 now married, 58 unmarried) Women who did not have a birth in the past 12 months: 8,506 (2,562 now married, 5,977 unmarried)
Housing units in zip code 89128 with a mortgage: 5,334 (600 second mortgage, 506 both second mortgage and home equity loan) Houses without a mortgage: 52
Median monthly owner costs for units with a mortgage: $1,600 Median monthly owner costs for units without a mortgage: $478
Residents with income below the poverty level in 2022:
This zip code:
8.3%
Whole state:
12.5%
Residents with income below 50% of the poverty level in 2022:
This zip code:
4.1%
Whole state:
5.9%
Median number of rooms in houses and condos:
Here:
5.9
State:
6.0
Median number of rooms in apartments:
Here:
4.4
State:
4.2
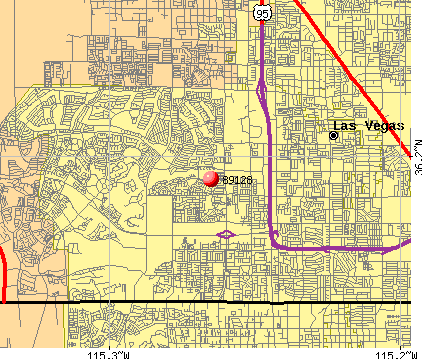
Notable locations in this zip code not listed on our city pages
Notable locations in zip code 89128: Angel Park Golf Club (A), Las Vegas Fire and Rescue Station 44 (B), Las Vegas Fire and Rescue Station 42 (C), Rainbow Library (D), Desert Shores Community Center (E). Display/hide their locations on the map
Churches in zip code 89128 include: Saint Elizabeth Ann Seton Catholic Church (A), Summerlin Evangelical Lutheran Church (B), Harvest Church of the Nazarene (C), Centennial Hills Baptist Church (D), Legacy Christian Fellowship Church (E). Display/hide their locations on the map
Tourist attractions (not listed on the city page) : African American Cultural Society (Cultural Attractions- Events- & Facilities; 7908 Rockbridge Circle), Paradise Found Grand Canyon Tours (1750 N. Buffalo Dr. Suite 104-183), Desert Storm Paintball Games (Arcades & Amusements; 1213 North Tenaya Way), Johnson Quarter Horses (Arcades & Amusements; 2113 Tosca Street).
3,898 married couples with children.
2,536 single-parent households (517 men, 2,019 women).
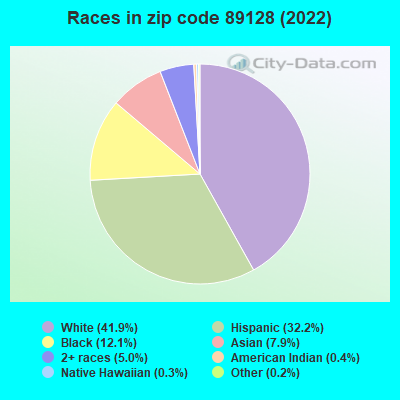
66.5% of residents of 89128 zip code speak English at home.
22.7% of residents speak Spanish at home (71% very well, 19% well, 9% not well, 1% not at all).
4.2% of residents speak other Indo-European language at home (60% very well, 31% well, 9% not well).
5.6% of residents speak Asian or Pacific Island language at home (68% very well, 23% well, 8% not well, 1% not at all).
1.2% of residents speak other language at home (76% very well, 24% well).
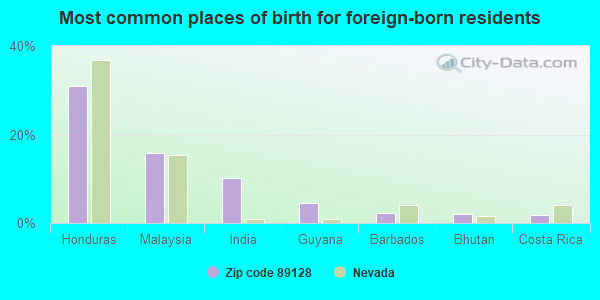
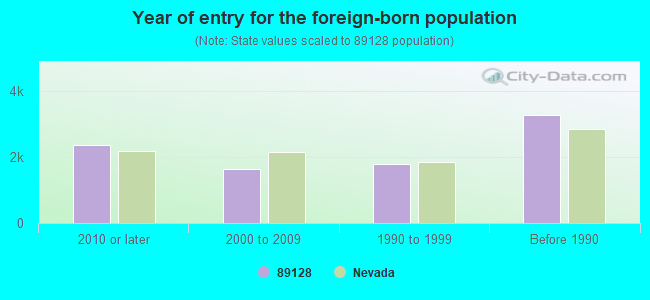
Foreign born population: 8,307 (21.1%) (57.0% of them are naturalized citizens)
Major facilities with environmental interests located in this zip code:
JAMES B MCMILLAN ELEMENTARY SCHOOL (7000 WALT LOTT DRIVE in LAS VEGAS, NV)
(Geographic Names Information System) (National Center for Education Statistics) - STATE ID-02-113 Organizations: CLARK CO SCH DIST (SCHOOL DISTRICT)
Alternative names: MCMILLAN, JAMES ELEM
CIMARRON-MEMORIAL HIGH SCHOOL (2301 N TENAYA WAY in LAS VEGAS, NV)
(Geographic Names Information System) (National Center for Education Statistics) - STATE ID-02-414 Organizations: CLARK CO SCH DIST (SCHOOL DISTRICT)
Alternative names: CIMARRON-MEMORIAL HS
EDYTHE AND LLOYD KATZ ELEMENTARY SCHOOL (1800 ROCK SPRINGS DR in LAS VEGAS, NV)
(Geographic Names Information System) (National Center for Education Statistics) - STATE ID-02-134 Organizations: CLARK CO SCH DIST (SCHOOL DISTRICT)
Alternative names: KATZ, EDYTHE & LLOYD ELEM
ALLEN ELEM (8680 W HAMMER LANE in LAS VEGAS, NV)
(National Center for Education Statistics) - STATE ID-02-151 Organizations: CLARK CO SCH DIST (SCHOOL DISTRICT)
BECKER, ERNEST MIDSCH (9151 PINEWOOD HILL DRIVE in LAS VEGAS, NV)
(National Center for Education Statistics) - STATE ID-02-327 Organizations: CLARK CO SCH DIST (SCHOOL DISTRICT)
JOHNSON MIDSCH (7701 DUCHARME AVENUE in LAS VEGAS, NV)
(National Center for Education Statistics) - STATE ID-02-323 Organizations: CLARK CO SCH DIST (SCHOOL DISTRICT)
BRYAN, RICHARD ELEM (8050 CIELO VISTA AVENUE in LAS VEGAS, NV)
(National Center for Education Statistics) - STATE ID-02-148 Organizations: CLARK CO SCH DIST (SCHOOL DISTRICT)
LUMMIS, WILLIAM ELEM (9000 HILLPOINTE ROAD in LAS VEGAS, NV)
(National Center for Education Statistics) - STATE ID-02-141 Organizations: CLARK CO SCH DIST (SCHOOL DISTRICT)
JACOBSON, WALTER ELEM (8400 BOSACK DRIVE in LAS VEGAS, NV)
(National Center for Education Statistics) - STATE ID-02-123 Organizations: CLARK CO SCH DIST (SCHOOL DISTRICT)
SPECIALIZED IMPORT AUTOMOTIVE SERVICE (2027 DECATUR BLVD. in LAS VEGAS, NV)
(Integrated Compliance Information System) - ICIS-09-1996-0016, FORMAL ENFORCEMENT ACTION
MAC PRINTING INC (7350 PRAIRIE FALCON RD in LAS VEGAS, NV)
(Resource Conservation and Recovery Act (tracking hazardous waste)) Business NAICS classification: COMMERCIAL LITHOGRAPHIC PRINTING. Organizations: THOMAS L WHEELER (CONTACT/OWNER)
BRAKE TEAM (500 S BUFFALO C in LAS VEGAS, NV)
(Resource Conservation and Recovery Act (tracking hazardous waste)) Organizations: BUFFALO ALTA ASSOCIATES (CONTACT/OWNER)
Alternative names: BRAKE DEPOT
FAST 1 HOUR FOTO (140 S RAINBOW BLVD in LAS VEGAS, NV)
(Resource Conservation and Recovery Act (tracking hazardous waste))
Housing units lacking complete plumbing facilities: 0.8% Housing units lacking complete kitchen facilities: 1.6%
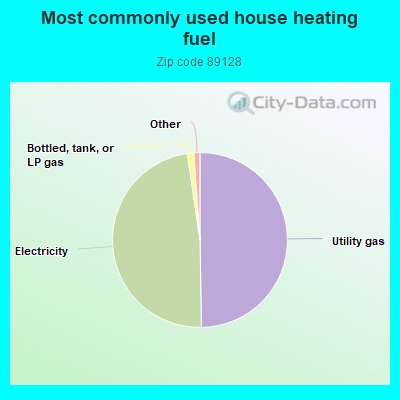
49.7%Utility gas
47.9%Electricity
1.2%Bottled, tank, or LP gas
Population in 1990: 18,956. Population change in the 1990s: +21,582 (+113.9%).
Place of birth for U.S.-born residents:
This state: 9,588
Northeast: 3,435
Midwest: 3,452
South: 2,973
West: 10,940
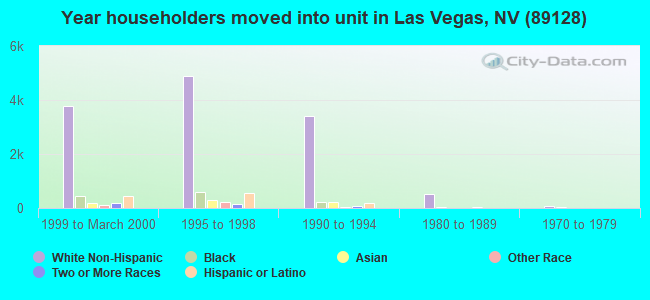
39% of the 89128 zip code residents lived in the same house 5 years ago. Out of people who lived in different houses, 47% lived in this county. Out of people who lived in different counties, 50% lived in Nevada.
88% of the 89128 zip code residents lived in the same house 1 year ago. Out of people who lived in different houses, 55% moved from this county. Out of people who lived in different houses, 36% moved from different state. Out of people who lived in different houses, 10% moved from abroad.
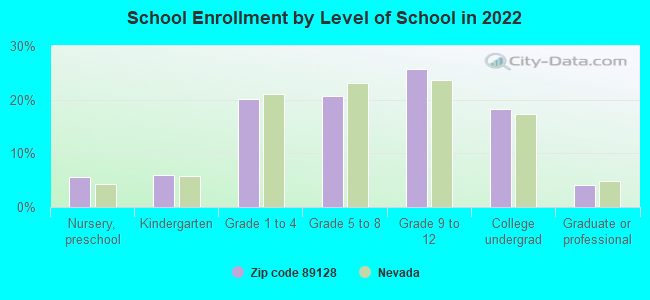
Private vs. public school enrollment:
Students in private schools in grades 1 to 8 (elementary and middle school): 232
Here:
6.5%
Nevada:
12.9%
Students in private schools in grades 9 to 12 (high school): 275
Here:
12.1%
Nevada:
6.9%
Students in private undergraduate colleges: 455
Here:
28.0%
Nevada:
16.0%
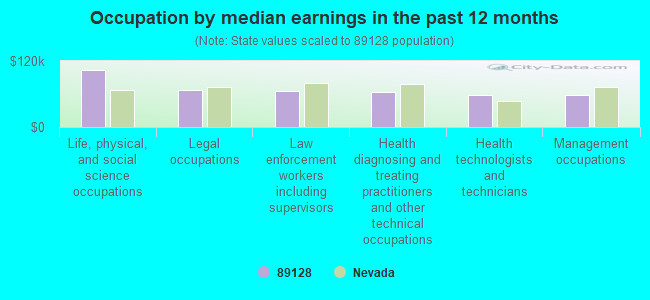
Occupation by median earnings in the past 12 months ($)
104,398Life, physical, and social science occupations
67,787Legal occupations
66,211Law enforcement workers including supervisors
62,772Health diagnosing and treating practitioners and other technical occupations
58,476Health technologists and technicians
57,700Management occupations
Companies with federal contracts located in this zip code (LAS VEGAS, NV):
SIERRA HEALTH SERVICES, INC (2724 N TENAYA WAY) : $1,396,758,477 in 284 contractsfrom 1999 to 2004
Contracts for General Health Care Services, Other Medical Services by Civilian Health and Medical Program of the Uniformed Services, Office of the, Department of Defense Signed by year:2000: $154,818,912; 2001: $233,586,152; 2002: $324,538,641; 2003: $561,759,510; 2004: $83,146,281; 2005: $0; 2006: $0.
Biggest contracts:
$266,307,408 with Civilian Health and Medical Program of the Uniformed Services, Office of the for General Health Care Services. Taking place in MD. Signed on 2003-11-04. Completion date: 2004-05-31.
$143,868,526 with Department of Defense for General Health Care Services. Taking place in MD. Signed on 2003-05-05. Completion date: 2004-05-05.
$117,629,876, same as above.Signed on 2002-05-15. Completion date: 2003-05-31.
$100,442,245, same as above.Signed on 2002-01-31. Completion date: 2002-05-31.
BLAINE WARREN ADVERTISING LLC (7120 SMOKE RANCH ROAD; small business) : $21,599,922 in 12 contractsfrom 2004 to 2006
Contracts for Advertising Services by Air Force Signed by year:2000: $0; 2001: $0; 2002: $0; 2003: $0; 2004: $7,000,000; 2005: $10,419,922; 2006: $4,180,000.
Biggest contracts:
$7,000,000 with Air Force for Advertising Services. Signed on 2004-11-22. Completion date: 2005-12-31.
$5,000,000, same as above.Signed on 2005-11-22. Completion date: 2006-12-31.
$3,980,000, same as above.Signed on 2006-02-23. Completion date: 2006-12-31.
$2,000,000, same as above.Signed on 2005-09-29. Completion date: 2005-12-31.
AVALANCHE SYSTEMS, INC (7251 W LAKE MEADE BLVD STE; small business) : $198,500 in 2 contractsin 2005
$99,500 with Navy for Radio and Television Communication Equipment, Except Airborne. Signed on 2005-08-02. Completion date: 2006-01-28.
$99,000 with Navy for Antennas, Waveguides, and Related Equipment. Signed on 2005-09-09. Completion date: 2006-03-14.
LARA CECCARINI (1830 NORTH BUFFALO DR #20; small business) : $73,996 in 4 contractsfrom 2003 to 2005
$35,400 with Air Force for Certifications and Accreditations for products and institutions other than educational institutions. Signed on 2004-11-09. Completion date: 2005-09-30.
$35,400, same as above.Signed on 2003-10-01. Completion date: 2005-09-30.
$3,196, same as above.Signed on 2005-02-10. Completion date: 2005-09-30.
$0, same as above.Signed on 2003-10-01. Completion date: 2005-09-30.
GFORCE AEROSPACE,LLC (7251 W LAKE MEAD BLVD; small business) 50 employees, $0 revenue. Small Disadvantaged Business, Black American Owned Business
$65,842 with Navy for Packing and Gasket Materials. Signed on 2003-03-13. Completion date: 2003-03-17.
INTERNATIONAL FOOD SERVICE EXE (2609 SURFWOOD DR) : $43,779 in 8 contractsfrom 2003 to 2006
Contracts for Other Education and Training Services, Special Dietary Foods and Food Specialty Preparations, Tuition, Registration, and Membership Fees, Training Aids, and moreby U.S. Coast Guard, Navy, Army Signed by year:2000: $0; 2001: $0; 2002: $0; 2003: $6,130; 2004: $3,600; 2005: $21,044; 2006: $13,005.
Biggest contracts:
$7,980 with U.S. Coast Guard for Other Education and Training Services. Taking place in DC. Signed on 2006-03-21. Completion date: 2006-04-20.
$7,560 with Navy for Special Dietary Foods and Food Specialty Preparations. Signed on 2005-03-09. Completion date: 2005-04-30.
$6,130 with Army for Tuition, Registration, and Membership Fees. Taking place in VA. Signed on 2003-03-11. Completion date: 2003-04-10.
$5,700 with Army for Tuition, Registration, and Membership Fees. Signed on 2005-05-18. Completion date: 2005-05-20.
YETS INC (7674 W LAKE MEAD BLVD #250; small business) : $41,482 in 3 contractsfrom 2004 to 2005
$23,685 with Air Force for Other Education and Training Services. Signed on 2005-09-17. Completion date: 2005-10-07.
$11,997 with Indian Health Service for . Taking place in SD. Signed on 2005-02-25. Effective on 2005-02-22. Completion date: 2005-03-15.
$5,800 with Air Force for Other Education and Training Services. Signed on 2004-10-18. Completion date: 2004-10-18.
UNICORN LTD (2211 N RAMPART BLVD , SUI; small business) : $32,625 in 2 contractsfrom 2002 to 2003
$25,500 with Army for Clothing, Special Purpose. Signed on 2002-09-18. Completion date: 2002-10-10.
$7,125 with Army for Clothing, Special Purpose. Taking place in GA. Signed on 2003-05-07. Completion date: 2003-05-30.
SOC-SMG, INC (7469 W LAKE MEAD BLVD # 20; small business)
$9,000 with Army for Training/Curriculum Development. Signed on 2005-03-29. Completion date: 2005-04-08.
Top industries in this zip code by the number of employees in 2005:
Health Care and Social Assistance: Offices of Physicians (except Mental Health Specialists) (100-249 employees: 2 establishments, 50-99 employees: 1 establishment, 20-49 employees: 9 establishments, 10-19 employees: 16 establishments, 5-9 employees: 22 establishments, 1-4 employees: 72 establishments)
2002 - 2018 National Fire Incident Reporting System (NFIRS) incidents
According to the data from the years 2002 - 2018 the average number of fires per year is 59. The highest number of fires - 109 took place in 2006, and the least - 0 in 2003. The data has a growing trend.
When looking into fire subcategories, the most reports belonged to: Outside Fires (51.2%), and Structure Fires (26.2%).
Fire incident types reported to NFIRS in Zip Code 89128


 Nearest zip codes: 89145, 89108, 89134, 89129, 89117, 89144.
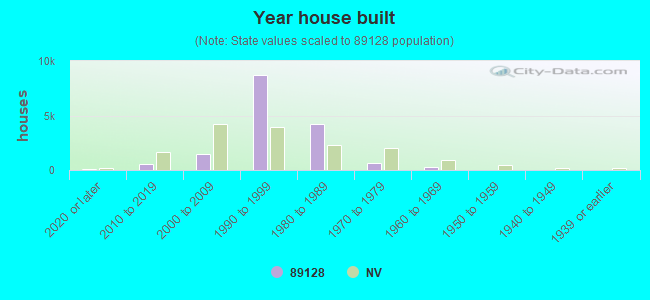


 According to the data from the years 2002 - 2018 the average number of fires per year is 59. The highest number of fires - 109 took place in 2006, and the least - 0 in 2003. The data has a growing trend.
 When looking into fire subcategories, the most reports belonged to: Outside Fires (51.2%), and Structure Fires (26.2%).