Estimated zip code population in 2022: 24,173 Zip code population in 2010: 24,040 Zip code population in 2000: 25,116
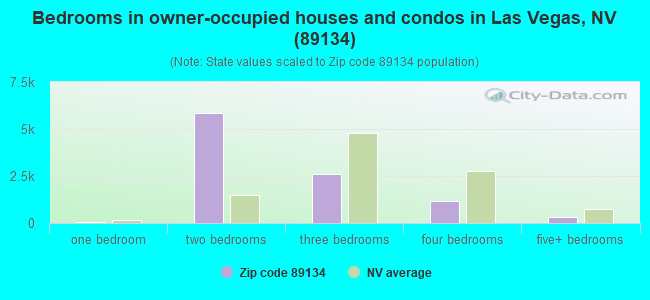
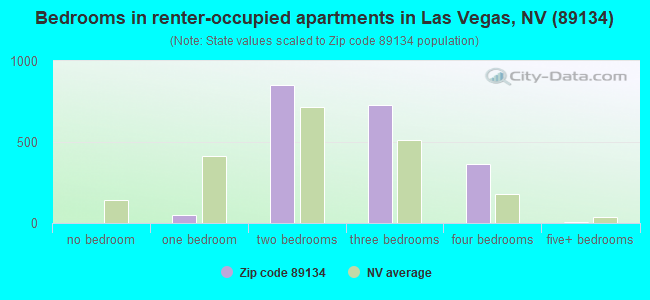
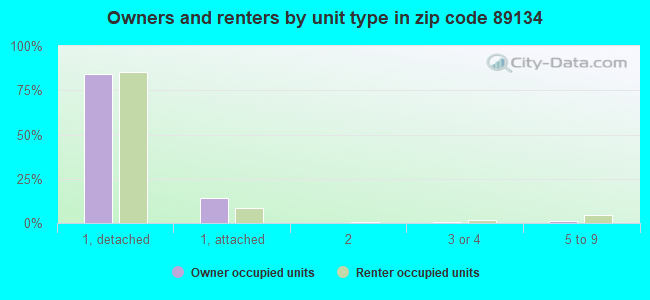
Houses and condos: 13,212 Renter-occupied apartments: 2,045
% of renters here:
17%
State:
40%
March 2022 cost of living index in zip code 89134: 100.6 (near average, U.S. average is 100)
Land area: 6.6 sq. mi. Water area: 0.0 sq. mi.
Population density: 3,648 people per square mile
(average).
OSM Map
General Map
Google Map
MSN Map
OSM Map
General Map
Google Map
MSN Map
OSM Map
General Map
Google Map
MSN Map
OSM Map
General Map
Google Map
MSN Map
Please wait while loading the map...
Real estate property taxes paid for housing units in 2022:
This zip code:
0.5% ($2,513)
Nevada:
0.4% ($1,889)
Median real estate property taxes paid for housing units with mortgages in 2022: $2,483 (0.5%) Median real estate property taxes paid for housing units with no mortgage in 2022: $2,541 (0.5%)
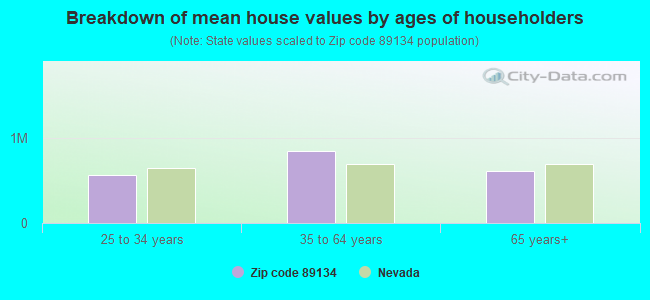
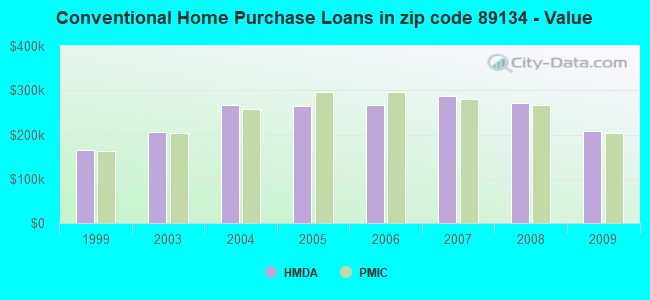
Estimated median house/condo value in 2022: $468,425
89134:
$468,425
Nevada:
$434,700
According to our research of Nevada and other state lists, there were 29 registered sex offenders living in 89134 zip code as of April 27, 2024. The ratio of all residents to sex offenders in zip code 89134 is 876 to 1. The ratio of registered sex offenders to all residents in this zip code is much lower than the state average.
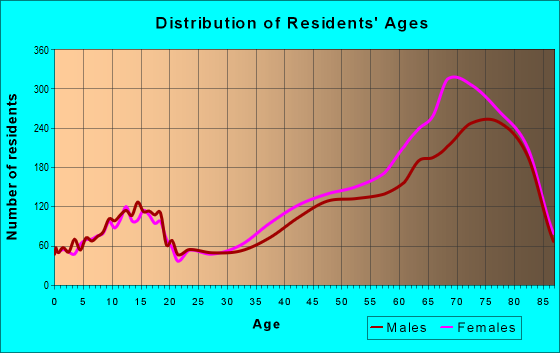
Median resident age:
This zip code:
65.3 years
Nevada median age:
39.0 years
Average household size:
This zip code:
2.0 people
Nevada:
2.6 people
Averages for the 2020 tax year for zip code 89134, filed in 2021:
Average Adjusted Gross Income (AGI) in 2020: $140,108 (Individual Income Tax Returns)
Here:
$140,108
State:
$78,964
Salary/wage: $95,849 (reported on 52.9% of returns)
Here:
$95,849
State:
$54,472
(% of AGI for various income ranges: 798.2% for AGIs below $25k, 2302.9% for AGIs $25k-50k, 4103.2% for AGIs $50k-75k, 5909.2% for AGIs $75k-100k, 13014.4% for AGIs $100k-200k, 98216.8% for AGIs over 200k)
Taxable interest for individuals: $5,792 (reported on 52.3% of returns)
This zip code:
$5,792
Nevada:
$3,521
(% of AGI for various income ranges: 73.8% for AGIs below $25k, 116.5% for AGIs $25k-50k, 154.5% for AGIs $50k-75k, 313.8% for AGIs $75k-100k, 419.2% for AGIs $100k-200k, 7307.4% for AGIs over 200k)
Ordinary dividends: $16,022 (reported on 40.8% of returns)
Here:
$16,022
State:
$13,390
(% of AGI for various income ranges: 132.6% for AGIs below $25k, 226.5% for AGIs $25k-50k, 368.5% for AGIs $50k-75k, 576.5% for AGIs $75k-100k, 1211.3% for AGIs $100k-200k, 15103.4% for AGIs over 200k)
Net capital gain/loss in AGI: +$75,647 (reported on 39.2% of returns)
Here:
+$75,647
State:
+$63,025
(% of AGI for various income ranges: 14.4% for AGIs below $25k, 135.6% for AGIs $25k-50k, 229.1% for AGIs $50k-75k, 571.5% for AGIs $75k-100k, 1565.2% for AGIs $100k-200k, 96450.0% for AGIs over 200k)
Profit/loss from business: +$14,818 (reported on 15.9% of returns)
Here:
+$14,818
State:
+$11,500
(% of AGI for various income ranges: 139.5% for AGIs below $25k, 185.6% for AGIs $25k-50k, 201.5% for AGIs $50k-75k, 242.8% for AGIs $75k-100k, 736.2% for AGIs $100k-200k, 3297.1% for AGIs over 200k)
Taxable individual retirement arrangement distribution: $24,117 (reported on 24.2% of returns)
89134:
$24,117
Nevada:
$23,628
(% of AGI for various income ranges: 238.2% for AGIs below $25k, 446.9% for AGIs $25k-50k, 688.5% for AGIs $50k-75k, 1347.0% for AGIs $75k-100k, 2100.5% for AGIs $100k-200k, 5908.9% for AGIs over 200k)
Self-employed (Keogh) retirement plans: $30,167 (reported on 0.7% of returns)
89134:
$30,167
Nevada:
$26,634
(% of AGI for various income ranges: 39.8% for AGIs $100k-200k, 586.6% for AGIs over 200k)
Total itemized deductions: $48,621 (reported on 15.2% of returns)
Here:
$48,621
State:
$44,173
(% of AGI for various income ranges: 165.7% for AGIs below $25k, 368.3% for AGIs $25k-50k, 577.4% for AGIs $50k-75k, 955.1% for AGIs $75k-100k, 1518.1% for AGIs $100k-200k, 14988.2% for AGIs over 200k)
Charity contributions: $17,847 (reported on 12.9% of returns)
Here:
$17,847
State:
$12,589
(% of AGI for various income ranges: 10.0% for AGIs below $25k, 37.2% for AGIs $25k-50k, 75.5% for AGIs $50k-75k, 173.2% for AGIs $75k-100k, 292.9% for AGIs $100k-200k, 6319.2% for AGIs over 200k)
Taxes paid: $6,502 (reported on 14.9% of returns)
89134:
$6,502
State:
$6,112
(% of AGI for various income ranges: 28.0% for AGIs below $25k, 52.9% for AGIs $25k-50k, 101.5% for AGIs $50k-75k, 166.9% for AGIs $75k-100k, 294.4% for AGIs $100k-200k, 1446.1% for AGIs over 200k)
Earned income credit: $1,554 (reported on 5.1% of returns)
Here:
$1,554
State:
$2,214
(% of AGI for various income ranges: 32.4% for AGIs below $25k, 27.2% for AGIs $25k-50k)
Percentage of individuals using paid preparers for their 2020 taxes: 91.2%
Here:
91%
State:
93%
(% for various income ranges: 89.7% for AGIs below $25k, 90.9% for AGIs $25k-50k, 92.0% for AGIs $50k-75k, 90.3% for AGIs $75k-100k, 92.7% for AGIs $100k-200k, 92.3% for AGIs over 200k)
Averages for the 2012 tax year for zip code 89134, filed in 2013:
Average Adjusted Gross Income (AGI) in 2012: $120,677 (Individual Income Tax Returns)
Here:
$120,677
State:
$61,164
Salary/wage: $82,454 (reported on 55.2% of returns)
Here:
$82,454
State:
$45,924
(% of AGI for various income ranges: 43.8% for AGIs below $25k, 41.6% for AGIs $25k-50k, 42.4% for AGIs $50k-75k, 42.1% for AGIs $75k-100k, 47.5% for AGIs $100k-200k, 32.6% for AGIs over 200k)
Taxable interest for individuals: $10,865 (reported on 54.8% of returns)
This zip code:
$10,865
Nevada:
$3,137
(% of AGI for various income ranges: 3.8% for AGIs below $25k, 2.5% for AGIs $25k-50k, 1.8% for AGIs $50k-75k, 2.1% for AGIs $75k-100k, 2.1% for AGIs $100k-200k, 7.0% for AGIs over 200k)
Ordinary dividends: $15,560 (reported on 40.8% of returns)
Here:
$15,560
State:
$11,762
(% of AGI for various income ranges: 8.4% for AGIs below $25k, 4.5% for AGIs $25k-50k, 3.7% for AGIs $50k-75k, 3.8% for AGIs $75k-100k, 4.1% for AGIs $100k-200k, 6.0% for AGIs over 200k)
Net capital gain/loss in AGI: +$42,261 (reported on 37.9% of returns)
Here:
+$42,261
State:
+$33,127
(% of AGI for various income ranges: 1.0% for AGIs $50k-75k, 1.1% for AGIs $75k-100k, 2.1% for AGIs $100k-200k, 22.4% for AGIs over 200k)
Profit/loss from business: +$19,960 (reported on 13.9% of returns)
Here:
+$19,960
State:
+$12,567
(% of AGI for various income ranges: 5.8% for AGIs below $25k, 3.5% for AGIs $25k-50k, 1.3% for AGIs $50k-75k, 1.8% for AGIs $75k-100k, 2.1% for AGIs $100k-200k, 2.3% for AGIs over 200k)
Taxable individual retirement arrangement distribution: $23,004 (reported on 30.0% of returns)
89134:
$23,004
Nevada:
$20,808
(% of AGI for various income ranges: 11.5% for AGIs below $25k, 9.7% for AGIs $25k-50k, 8.4% for AGIs $50k-75k, 9.4% for AGIs $75k-100k, 9.9% for AGIs $100k-200k, 2.8% for AGIs over 200k)
Self-employment retirement plans: $28,450 (reported on 0.6% of returns)
89134:
$28,450
Nevada:
$22,197
(% of AGI for various income ranges: 0.4% for AGIs below $25k, 0.1% for AGIs $100k-200k, 0.2% for AGIs over 200k)
Total itemized deductions: $39,635 (19% of AGI, reported on 43.3% of returns)
Here:
$39,635
State:
$26,148
Here:
18.6% of AGI
State:
20.0% of AGI
(% of AGI for various income ranges: 25.4% for AGIs below $25k, 16.9% for AGIs $25k-50k, 15.3% for AGIs $50k-75k, 14.8% for AGIs $75k-100k, 13.7% for AGIs $100k-200k, 13.3% for AGIs over 200k)
Charity contributions: $9,403 (reported on 37.8% of returns)
Here:
$9,403
State:
$4,329
(% of AGI for various income ranges: 1.5% for AGIs below $25k, 1.6% for AGIs $25k-50k, 1.7% for AGIs $50k-75k, 1.7% for AGIs $75k-100k, 1.8% for AGIs $100k-200k, 3.9% for AGIs over 200k)
Taxes paid: $7,257 (reported on 42.8% of returns)
89134:
$7,257
State:
$5,116
(% of AGI for various income ranges: 4.2% for AGIs below $25k, 3.0% for AGIs $25k-50k, 2.9% for AGIs $50k-75k, 2.8% for AGIs $75k-100k, 3.1% for AGIs $100k-200k, 2.2% for AGIs over 200k)
Earned income credit: $1,667 (reported on 5.4% of returns)
Here:
$1,667
State:
$2,279
(% of AGI for various income ranges: 1.9% for AGIs below $25k, 0.3% for AGIs $25k-50k)
Percentage of individuals using paid preparers for their 2012 taxes: 57.2%
Here:
57%
State:
55%
(% for various income ranges: 48.1% for AGIs below $25k, 53.2% for AGIs $25k-50k, 57.8% for AGIs $50k-75k, 61.2% for AGIs $75k-100k, 62.9% for AGIs $100k-200k, 82.8% for AGIs over 200k)
Averages for the 2004 tax year for zip code 89134, filed in 2005:
Average Adjusted Gross Income (AGI) in 2004: $143,544 (Individual Income Tax Returns)
Here:
$143,544
State:
$58,367
Salary/wage: $105,514 (reported on 55.8% of returns)
Here:
$105,514
State:
$42,695
(% of AGI for various income ranges: 37.3% for AGIs $10k-25k, 40.5% for AGIs $25k-50k, 39.2% for AGIs $50k-75k, 44.4% for AGIs $75k-100k, 40.0% for AGIs over 100k)
Taxable interest for individuals: $8,398 (reported on 70.1% of returns)
This zip code:
$8,398
Nevada:
$3,867
(% of AGI for various income ranges: 9.5% for AGIs $10k-25k, 5.5% for AGIs $25k-50k, 5.2% for AGIs $50k-75k, 4.9% for AGIs $75k-100k, 3.4% for AGIs over 100k)
Taxable dividends: $9,964 (reported on 51.5% of returns)
Here:
$9,964
State:
$5,770
(% of AGI for various income ranges: 7.2% for AGIs $10k-25k, 4.1% for AGIs $25k-50k, 4.0% for AGIs $50k-75k, 3.4% for AGIs $75k-100k, 3.3% for AGIs over 100k)
Net capital gain/loss: +$73,685 (reported on 48.1% of returns)
Here:
+$73,685
State:
+$50,644
(% of AGI for various income ranges: -0.1% for AGIs $10k-25k, 1.1% for AGIs $25k-50k, 1.9% for AGIs $50k-75k, 3.4% for AGIs $75k-100k, 30.0% for AGIs over 100k)
Profit/loss from business: +$21,985 (reported on 14.3% of returns)
Here:
+$21,985
State:
+$13,618
(% of AGI for various income ranges: 4.4% for AGIs $10k-25k, 2.8% for AGIs $25k-50k, 3.0% for AGIs $50k-75k, 2.9% for AGIs $75k-100k, 2.0% for AGIs over 100k)
IRA payment deduction: $3,800 (reported on 3.1% of returns)
89134:
$3,800
Nevada:
$3,054
(% of AGI for various income ranges: 0.3% for AGIs $10k-25k, 0.3% for AGIs $25k-50k, 0.2% for AGIs $50k-75k, 0.2% for AGIs $75k-100k, 0.0% for AGIs over 100k)
Self-employed pension: $19,917 (reported on 1.3% of returns)
Here:
$19,917
Nevada:
$16,706
(% of AGI for various income ranges: 0.3% for AGIs $10k-25k, 0.2% for AGIs $50k-75k, 0.1% for AGIs $75k-100k, 0.2% for AGIs over 100k)
Total itemized deductions: $32,348 (15% of AGI, reported on 54.6% of returns)
Here:
$32,348
State:
$22,990
Here:
14.8% of AGI
State:
21.8% of AGI
(% of AGI for various income ranges: 28.7% for AGIs $10k-25k, 22.1% for AGIs $25k-50k, 19.4% for AGIs $50k-75k, 18.7% for AGIs $75k-100k, 9.7% for AGIs over 100k)
Charity contributions deductions: $6,631 (3% of AGI, reported on 50.2% of returns)
Here:
$6,631
State:
$3,443
Here:
2.9% of AGI
State:
3.1% of AGI
(% of AGI for various income ranges: 2.2% for AGIs $10k-25k, 2.2% for AGIs $25k-50k, 2.2% for AGIs $50k-75k, 2.3% for AGIs $75k-100k, 2.3% for AGIs over 100k)
Total tax: $34,475 (reported on 83.4% of returns)
89134:
$34,475
State:
$10,585
(% of AGI for various income ranges: 3.5% for AGIs $10k-25k, 7.1% for AGIs $25k-50k, 9.8% for AGIs $50k-75k, 11.0% for AGIs $75k-100k, 22.6% for AGIs over 100k)
Earned income credit: $1,213 (reported on 3.0% of returns)
Here:
$1,213
State:
$1,676
Percentage of individuals using paid preparers for their 2004 taxes: 65.4%
Here:
65%
State:
60%
(% for various income ranges: 60.8% for AGIs below $10k, 64.4% for AGIs $10k-25k, 63.1% for AGIs $25k-50k, 64.2% for AGIs $50k-75k, 63.1% for AGIs $75k-100k, 72.9% for AGIs over 100k)
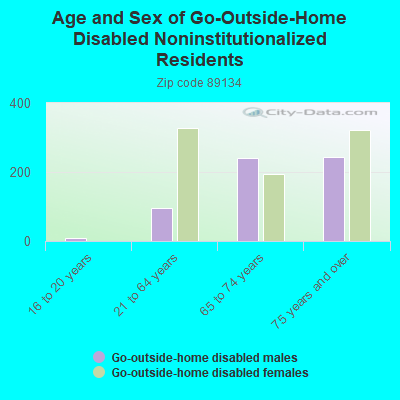
Likely homosexual households (counted as self-reported same-sex unmarried-partner households)
Lesbian couples: 0.0% of all households
Gay men: 0.1% of all households
Household received Food Stamps/SNAP in the past 12 months: 340 Household did not receive Food Stamps/SNAP in the past 12 months: 11,476
Women who had a birth in the past 12 months: 65 (74 now married, 0 unmarried) Women who did not have a birth in the past 12 months: 3,033 (1,235 now married, 1,798 unmarried)
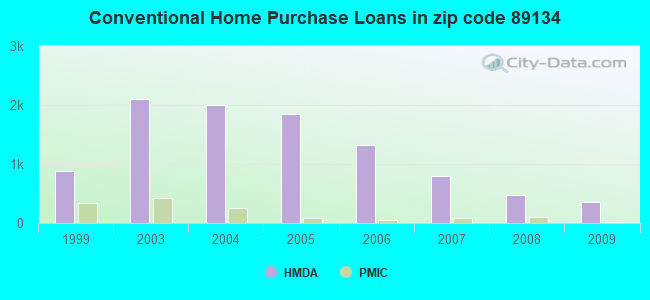
Housing units in zip code 89134 with a mortgage: 5,094 (288 second mortgage, 182 both second mortgage and home equity loan) Houses without a mortgage: 134
Median monthly owner costs for units with a mortgage: $1,741 Median monthly owner costs for units without a mortgage: $494
Residents with income below the poverty level in 2022:
This zip code:
7.9%
Whole state:
12.5%
Residents with income below 50% of the poverty level in 2022:
This zip code:
3.8%
Whole state:
5.9%
Median number of rooms in houses and condos:
Here:
5.3
State:
6.0
Median number of rooms in apartments:
Here:
5.3
State:
4.2
Notable locations in this zip code not listed on our city pages
Notable locations in zip code 89134: Tournament Players Club at Summerlin Golf Course (A), Eagle Crest Course (B), Highland Falls Golf Course (C), Palm Valley Golf Course (D), Mountain Shadows Community Center (E), Summerlin Community Center (F), Summerlin Library (G), Sun Shadows Community Center (H), Desert Vista Community Center (I). Display/hide their locations on the map
Churches in zip code 89134 include: Victory Vegas Church (A), Sun City Community Church (B), Summerlin Community Baptist Church (C), Grace in the Desert Episcopal Church (D), Saint Andrew Lutheran Church (E), Mountain View Presbyterian Church (F). Display/hide their locations on the map
1,861 married couples with children.
478 single-parent households (102 men, 376 women).
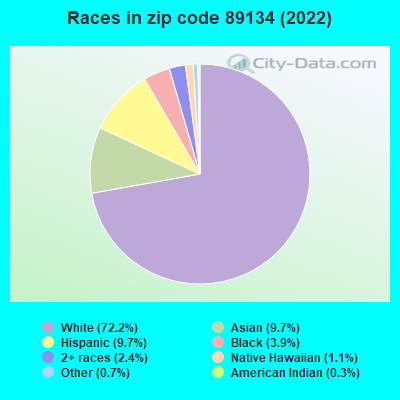
85.1% of residents of 89134 zip code speak English at home.
4.9% of residents speak Spanish at home (82% very well, 15% well, 1% not well, 3% not at all).
3.8% of residents speak other Indo-European language at home (75% very well, 20% well, 6% not well).
6.4% of residents speak Asian or Pacific Island language at home (72% very well, 15% well, 11% not well, 1% not at all).
1.0% of residents speak other language at home (92% very well, 3% well, 5% not well).
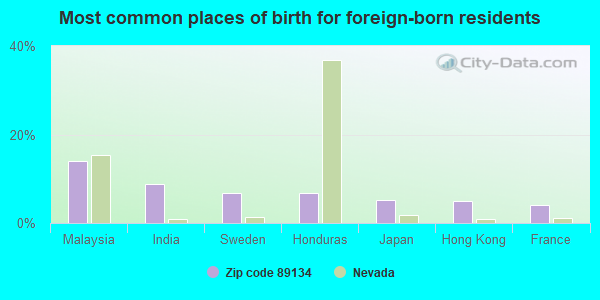
Foreign born population: 4,094 (16.9%) (75.9% of them are naturalized citizens)
Facilities with environmental interests located in this zip code:
BONNER ELEM (765 CRESTDALE LANE in LAS VEGAS, NV)
(National Center for Education Statistics) - STATE ID-02-157 Organizations: CLARK CO SCH DIST (SCHOOL DISTRICT)
BUNKER, BERKELEY ELEM (6350 PEAK DRIVE in LAS VEGAS, NV)
(National Center for Education Statistics) - STATE ID-02-163 Organizations: CLARK CO SCH DIST (SCHOOL DISTRICT)
DESERT RADIOLOGISTS (8551 W LAKE MEAD BLVD in LAS VEGAS, NV)
(Resource Conservation and Recovery Act (tracking hazardous waste)) Organizations: TAYLOR KNUDSON AND LUM PROFESSIONAL ASSN (CONTACT/OWNER)
LONGS DRUG STORES 406 (9430 DEL WEBB BLVD in LAS VEGAS, NV)
(Resource Conservation and Recovery Act (tracking hazardous waste)) Organizations: LONGS DRUG STORES CALI INC (CONTACT/OWNER)
FAZIO CLEANERS (10300 W CHARLESTON BLVD in LAS VEGAS, NV)
Small Quantity Generators, between 100 kg and 1000 kg of hazardous waste/month (Resource Conservation and Recovery Act (tracking hazardous waste)) Organizations: FAZIO CLEANERS INC (CONTACT/OWNER)
FAZIO CLEANERS (1946 VILLAGE CENTER CR STE 1 in LAS VEGAS, NV)
Small Quantity Generators, between 100 kg and 1000 kg of hazardous waste/month (Resource Conservation and Recovery Act (tracking hazardous waste)) - notification Organizations: FLAIR INC (CONTACT/OWNER)
KLOEHN COMPANY, LTD (1000 BANBURRY CROSS DRIVE in LAS VEGAS, NV)
HAZARDOUS WASTE BIENNIAL REPORTER (Resource Conservation and Recovery Act (tracking hazardous waste)) Small Quantity Generators, between 100 kg and 1000 kg of hazardous waste/month (Resource Conservation and Recovery Act (tracking hazardous waste)) Business NAICS classification: ALL OTHER MISCELLANEOUS FABRICATED METAL PRODUCT MANUFACTURING.; SURGICAL AND MEDICAL INSTRUMENT MANUFACTURING.
LONGS DRUG STORE NO 409 (1950 VILLAGE CENTER CIR in LAS VEGAS, NV)
Conditionally Exempt Small Quantity Generators, less than 100 kg/month of hazardous waste (Resource Conservation and Recovery Act (tracking hazardous waste)) - notification Organizations: LONGS DRUG STORES CAL INC (CONTACT/OWNER)
AL PHILLIPS THE CLEANER (8578 W LAKE MEADE in LAS VEGAS, NV)
Small Quantity Generators, between 100 kg and 1000 kg of hazardous waste/month (Resource Conservation and Recovery Act (tracking hazardous waste))
DEERFIELD PRODUCTION CORPORATION (2561 SOUTH 1560 WEST SUITE 200 in LAS VEGAS, NV)
CRITERIA AND HAZARDOUS AIR POLLUTANT INVENTORY (Inventory of air pollution sources) Business SIC classification: CRUDE PETROLEUM AND NATURAL GAS
EQUINOX INTERNATIONAL (1211 TOWN CENTER DR in LAS VEGAS, NV)
COMPLIANCE ACTIVITY (Tracking inspections of insecticide, fungicide, and rodenticide, and toxic substances)
Housing units lacking complete plumbing facilities: 0.6% Housing units lacking complete kitchen facilities: 0.3%
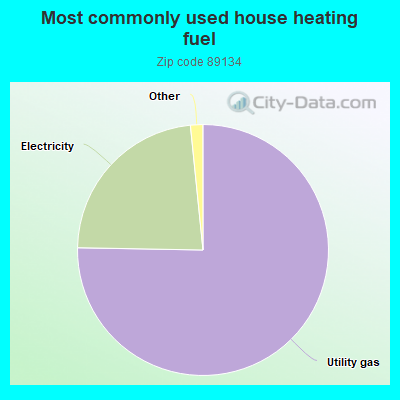
75.3%Utility gas
23.1%Electricity
0.9%Bottled, tank, or LP gas
0.5%Solar energy
Population in 1990: 3,630. Population change in the 1990s: +21,486 (+591.9%).
Place of birth for U.S.-born residents:
This state: 3,437
Northeast: 3,975
Midwest: 4,616
South: 1,917
West: 5,637
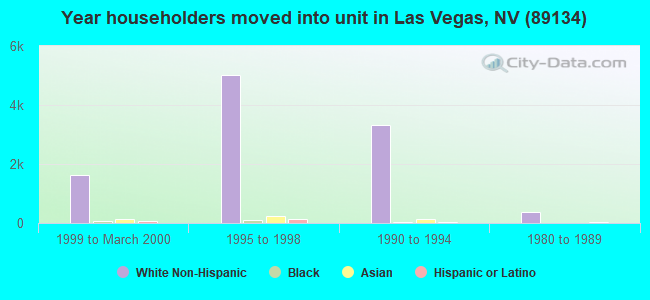
38% of the 89134 zip code residents lived in the same house 5 years ago. Out of people who lived in different houses, 37% lived in this county. Out of people who lived in different counties, 50% lived in Nevada.
88% of the 89134 zip code residents lived in the same house 1 year ago. Out of people who lived in different houses, 45% moved from this county. Out of people who lived in different houses, 4% moved from different county within same state. Out of people who lived in different houses, 49% moved from different state. Out of people who lived in different houses, 5% moved from abroad.
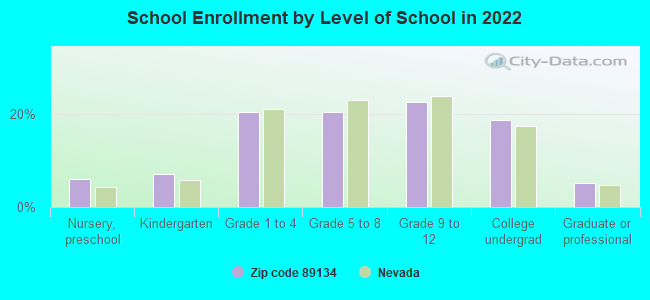
Private vs. public school enrollment:
Students in private schools in grades 1 to 8 (elementary and middle school): 314
Here:
22.5%
Nevada:
12.9%
Students in private schools in grades 9 to 12 (high school): 140
Here:
18.8%
Nevada:
6.9%
Students in private undergraduate colleges: 94
Here:
15.3%
Nevada:
16.0%
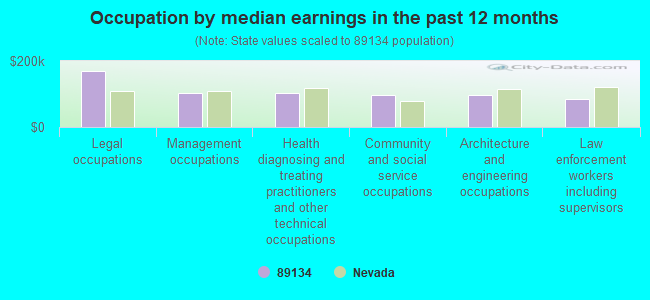
Occupation by median earnings in the past 12 months ($)
169,445Legal occupations
103,734Management occupations
103,089Health diagnosing and treating practitioners and other technical occupations
96,328Community and social service occupations
96,305Architecture and engineering occupations
83,595Law enforcement workers including supervisors
Companies with federal contracts located in this zip code (LAS VEGAS, NV):
LEW AEROSPACE (1930 VILLAGE CENTER CIRCLE; small business) : $676,925 in 5 contractsfrom 2004 to 2006
Contracts for Aircraft, Fixed Wing, Armament Training Devices, Defense Missile and Space Systems -- Basic Research (R&D) by Air Force, Army Signed by year:2000: $0; 2001: $0; 2002: $0; 2003: $0; 2004: $191,860; 2005: $0; 2006: $485,065.
Biggest contracts:
$276,652 with Air Force for Aircraft, Fixed Wing. Signed on 2006-07-10. Completion date: 2007-01-03.
$183,638, same as above.Signed on 2006-05-31. Completion date: 2007-09-30.
$97,651 with Air Force for Armament Training Devices. Signed on 2004-08-20. Completion date: 2004-09-08.
$94,209, same as above.Signed on 2004-03-08. Completion date: 2004-03-25.
FITNESSAGE SERVICES, INC (1930 VILLAGE CENTER CIRLCE; small business) : $336,000 in 5 contractsfrom 2003 to 2005
Contracts for Recreational and Gymnastic Equipment by Army Signed by year:2000: $0; 2001: $0; 2002: $0; 2003: $110,000; 2004: $116,000; 2005: $110,000; 2006: $0.
Biggest contracts:
$110,000 with Army for Recreational and Gymnastic Equipment. Taking place in MD. Signed on 2005-10-13. Completion date: 2003-09-30.
$110,000, same as above.Signed on 2004-10-25. Completion date: 2003-09-30.
$110,000, same as above.Signed on 2003-11-24. Completion date: 2003-09-30.
$6,000, same as above.Signed on 2004-03-09. Completion date: 2003-09-30.
PERFORMANCE INDUSTRIES LLC (8617 MILLSBORO DR; small business)
$34,188 with Air Force for Fuels, Solid. Signed on 2002-10-04. Completion date: 2002-10-06.
GLOBAL SCAN TECHNOLOGIES, INC (1930 VILLAGE CENTER CIRCLE; small business) : $7,666 in 2 contractsin 2003
$4,243 with Army for ADP Input/Output and Storage Devices. Signed on 2003-02-12. Completion date: 2003-02-18.
$3,423 with Army for ADP Components. Signed on 2003-04-11. Completion date: 2003-04-17.
Top industries in this zip code by the number of employees in 2005:
2002 - 2018 National Fire Incident Reporting System (NFIRS) incidents
According to the data from the years 2002 - 2018 the average number of fires per year is 18. The highest number of fires - 35 took place in 2007, and the least - 0 in 2003. The data has a growing trend.
When looking into fire subcategories, the most reports belonged to: Outside Fires (40.4%), and Structure Fires (33.3%).
Fire incident types reported to NFIRS in Zip Code 89134
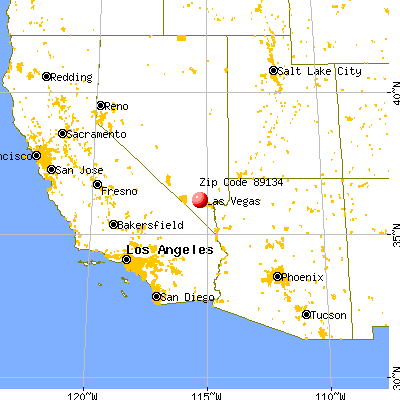


 Nearest zip codes: 89144, 89129, 89128, 89145, 89138, 89117.
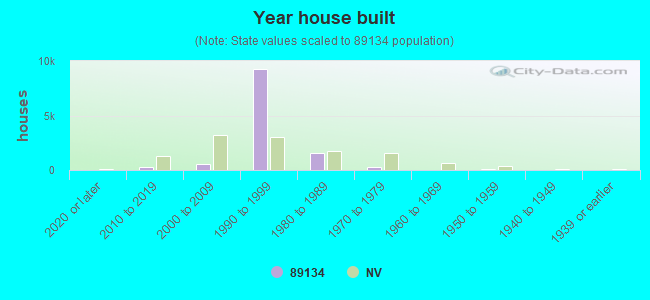


 According to the data from the years 2002 - 2018 the average number of fires per year is 18. The highest number of fires - 35 took place in 2007, and the least - 0 in 2003. The data has a growing trend.
 When looking into fire subcategories, the most reports belonged to: Outside Fires (40.4%), and Structure Fires (33.3%).