Estimated zip code population in 2022: 55,270 Zip code population in 2010: 51,252 Zip code population in 2000: 32,441
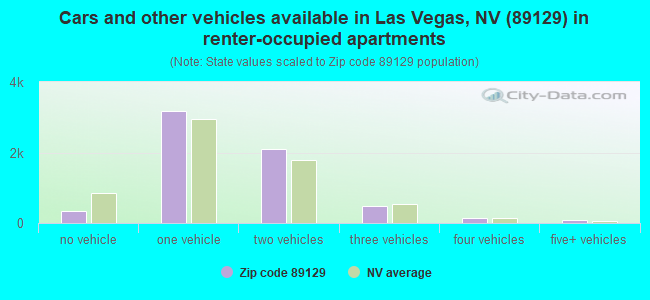
Houses and condos: 22,330 Renter-occupied apartments: 6,311
% of renters here:
29%
State:
40%
March 2022 cost of living index in zip code 89129: 99.0 (near average, U.S. average is 100)
Land area: 10.0 sq. mi. Water area: 0.0 sq. mi.
Population density: 5,524 people per square mile
(average).
OSM Map
General Map
Google Map
MSN Map
OSM Map
General Map
Google Map
MSN Map
OSM Map
General Map
Google Map
MSN Map
OSM Map
General Map
Google Map
MSN Map
Please wait while loading the map...
Real estate property taxes paid for housing units in 2022:
This zip code:
0.5% ($2,182)
Nevada:
0.4% ($1,889)
Median real estate property taxes paid for housing units with mortgages in 2022: $2,104 (0.5%) Median real estate property taxes paid for housing units with no mortgage in 2022: $2,371 (0.5%)
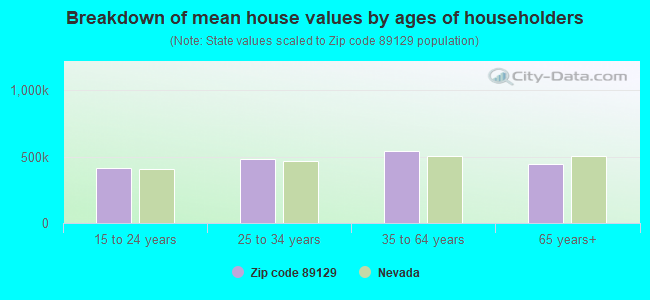
Estimated median house/condo value in 2022: $456,214
89129:
$456,214
Nevada:
$434,700
According to our research of Nevada and other state lists, there were 82 registered sex offenders living in 89129 zip code as of April 27, 2024. The ratio of all residents to sex offenders in zip code 89129 is 682 to 1. The ratio of registered sex offenders to all residents in this zip code is lower than the state average.
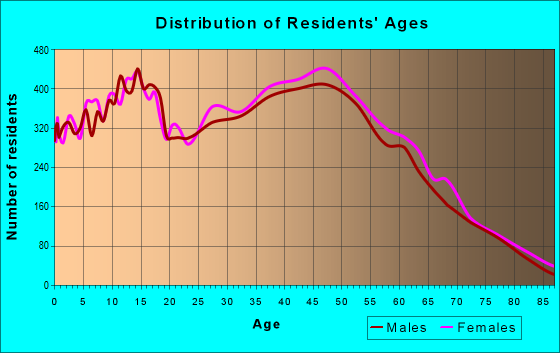
Median resident age:
This zip code:
40.4 years
Nevada median age:
39.0 years
Average household size:
This zip code:
2.6 people
Nevada:
2.6 people
Averages for the 2020 tax year for zip code 89129, filed in 2021:
Average Adjusted Gross Income (AGI) in 2020: $73,544 (Individual Income Tax Returns)
Here:
$73,544
State:
$78,964
Salary/wage: $58,483 (reported on 82.5% of returns)
Here:
$58,483
State:
$54,472
(% of AGI for various income ranges: 1129.6% for AGIs below $25k, 3377.3% for AGIs $25k-50k, 6456.9% for AGIs $50k-75k, 9586.9% for AGIs $75k-100k, 18002.0% for AGIs $100k-200k, 70011.5% for AGIs over 200k)
Taxable interest for individuals: $1,800 (reported on 25.1% of returns)
This zip code:
$1,800
Nevada:
$3,521
(% of AGI for various income ranges: 10.5% for AGIs below $25k, 12.7% for AGIs $25k-50k, 24.5% for AGIs $50k-75k, 53.1% for AGIs $75k-100k, 101.8% for AGIs $100k-200k, 1722.0% for AGIs over 200k)
Ordinary dividends: $5,441 (reported on 15.0% of returns)
Here:
$5,441
State:
$13,390
(% of AGI for various income ranges: 15.9% for AGIs below $25k, 24.6% for AGIs $25k-50k, 59.5% for AGIs $50k-75k, 91.5% for AGIs $75k-100k, 179.0% for AGIs $100k-200k, 3073.2% for AGIs over 200k)
Net capital gain/loss in AGI: +$17,220 (reported on 15.9% of returns)
Here:
+$17,220
State:
+$63,025
(% of AGI for various income ranges: 7.9% for AGIs below $25k, 21.7% for AGIs $25k-50k, 71.7% for AGIs $50k-75k, 163.0% for AGIs $75k-100k, 491.0% for AGIs $100k-200k, 14080.2% for AGIs over 200k)
Profit/loss from business: +$10,024 (reported on 17.2% of returns)
Here:
+$10,024
State:
+$11,500
(% of AGI for various income ranges: 99.5% for AGIs below $25k, 110.6% for AGIs $25k-50k, 174.2% for AGIs $50k-75k, 256.1% for AGIs $75k-100k, 509.9% for AGIs $100k-200k, 3371.2% for AGIs over 200k)
Taxable individual retirement arrangement distribution: $19,609 (reported on 6.6% of returns)
89129:
$19,609
Nevada:
$23,628
(% of AGI for various income ranges: 40.7% for AGIs below $25k, 59.3% for AGIs $25k-50k, 142.7% for AGIs $50k-75k, 206.1% for AGIs $75k-100k, 590.5% for AGIs $100k-200k, 1964.8% for AGIs over 200k)
Self-employed (Keogh) retirement plans: $19,175 (reported on 0.3% of returns)
89129:
$19,175
Nevada:
$26,634
(% of AGI for various income ranges: 25.2% for AGIs $100k-200k, 244.5% for AGIs over 200k)
Total itemized deductions: $36,523 (reported on 10.3% of returns)
Here:
$36,523
State:
$44,173
(% of AGI for various income ranges: 48.3% for AGIs below $25k, 139.6% for AGIs $25k-50k, 357.4% for AGIs $50k-75k, 581.9% for AGIs $75k-100k, 1280.2% for AGIs $100k-200k, 10272.0% for AGIs over 200k)
Charity contributions: $10,220 (reported on 8.6% of returns)
Here:
$10,220
State:
$12,589
(% of AGI for various income ranges: 4.5% for AGIs below $25k, 19.5% for AGIs $25k-50k, 48.0% for AGIs $50k-75k, 86.5% for AGIs $75k-100k, 275.4% for AGIs $100k-200k, 3305.2% for AGIs over 200k)
Taxes paid: $5,826 (reported on 10.3% of returns)
89129:
$5,826
State:
$6,112
(% of AGI for various income ranges: 7.9% for AGIs below $25k, 24.3% for AGIs $25k-50k, 65.9% for AGIs $50k-75k, 111.0% for AGIs $75k-100k, 238.9% for AGIs $100k-200k, 1250.0% for AGIs over 200k)
Earned income credit: $2,102 (reported on 14.0% of returns)
Here:
$2,102
State:
$2,214
(% of AGI for various income ranges: 82.0% for AGIs below $25k, 56.3% for AGIs $25k-50k, 0.7% for AGIs $50k-75k)
Percentage of individuals using paid preparers for their 2020 taxes: 93.3%
Here:
93%
State:
93%
(% for various income ranges: 92.3% for AGIs below $25k, 94.7% for AGIs $25k-50k, 94.0% for AGIs $50k-75k, 92.9% for AGIs $75k-100k, 92.2% for AGIs $100k-200k, 93.0% for AGIs over 200k)
Averages for the 2012 tax year for zip code 89129, filed in 2013:
Average Adjusted Gross Income (AGI) in 2012: $59,128 (Individual Income Tax Returns)
Here:
$59,128
State:
$61,164
Salary/wage: $51,917 (reported on 85.3% of returns)
Here:
$51,917
State:
$45,924
(% of AGI for various income ranges: 75.2% for AGIs below $25k, 82.4% for AGIs $25k-50k, 81.6% for AGIs $50k-75k, 78.4% for AGIs $75k-100k, 78.6% for AGIs $100k-200k, 54.1% for AGIs over 200k)
Taxable interest for individuals: $1,404 (reported on 26.3% of returns)
This zip code:
$1,404
Nevada:
$3,137
(% of AGI for various income ranges: 1.1% for AGIs below $25k, 0.5% for AGIs $25k-50k, 0.4% for AGIs $50k-75k, 0.4% for AGIs $75k-100k, 0.6% for AGIs $100k-200k, 1.0% for AGIs over 200k)
Ordinary dividends: $5,708 (reported on 14.6% of returns)
Here:
$5,708
State:
$11,762
(% of AGI for various income ranges: 2.5% for AGIs below $25k, 1.1% for AGIs $25k-50k, 0.6% for AGIs $50k-75k, 0.7% for AGIs $75k-100k, 0.9% for AGIs $100k-200k, 3.3% for AGIs over 200k)
Net capital gain/loss in AGI: +$6,752 (reported on 12.8% of returns)
Here:
+$6,752
State:
+$33,127
(% of AGI for various income ranges: 0.1% for AGIs $25k-50k, 0.1% for AGIs $50k-75k, 0.2% for AGIs $75k-100k, 0.6% for AGIs $100k-200k, 6.6% for AGIs over 200k)
Profit/loss from business: +$10,950 (reported on 14.8% of returns)
Here:
+$10,950
State:
+$12,567
(% of AGI for various income ranges: 7.7% for AGIs below $25k, 3.1% for AGIs $25k-50k, 1.7% for AGIs $50k-75k, 1.9% for AGIs $75k-100k, 1.9% for AGIs $100k-200k, 3.4% for AGIs over 200k)
Taxable individual retirement arrangement distribution: $15,697 (reported on 7.6% of returns)
89129:
$15,697
Nevada:
$20,808
(% of AGI for various income ranges: 2.2% for AGIs below $25k, 1.6% for AGIs $25k-50k, 1.9% for AGIs $50k-75k, 2.3% for AGIs $75k-100k, 2.2% for AGIs $100k-200k, 1.8% for AGIs over 200k)
Self-employment retirement plans: $18,771 (reported on 0.3% of returns)
89129:
$18,771
Nevada:
$22,197
Total itemized deductions: $23,248 (23% of AGI, reported on 34.7% of returns)
Here:
$23,248
State:
$26,148
Here:
23.2% of AGI
State:
20.0% of AGI
(% of AGI for various income ranges: 10.5% for AGIs below $25k, 11.3% for AGIs $25k-50k, 13.3% for AGIs $50k-75k, 13.6% for AGIs $75k-100k, 14.3% for AGIs $100k-200k, 16.1% for AGIs over 200k)
Charity contributions: $3,803 (reported on 29.5% of returns)
Here:
$3,803
State:
$4,329
(% of AGI for various income ranges: 0.7% for AGIs below $25k, 1.2% for AGIs $25k-50k, 1.6% for AGIs $50k-75k, 1.8% for AGIs $75k-100k, 2.3% for AGIs $100k-200k, 2.8% for AGIs over 200k)
Taxes paid: $4,157 (reported on 34.2% of returns)
89129:
$4,157
State:
$5,116
(% of AGI for various income ranges: 1.7% for AGIs below $25k, 2.0% for AGIs $25k-50k, 2.4% for AGIs $50k-75k, 2.6% for AGIs $75k-100k, 2.9% for AGIs $100k-200k, 2.2% for AGIs over 200k)
Earned income credit: $2,125 (reported on 15.1% of returns)
Here:
$2,125
State:
$2,279
(% of AGI for various income ranges: 5.4% for AGIs below $25k, 1.0% for AGIs $25k-50k)
Percentage of individuals using paid preparers for their 2012 taxes: 50.3%
Here:
50%
State:
55%
(% for various income ranges: 44.6% for AGIs below $25k, 47.2% for AGIs $25k-50k, 52.7% for AGIs $50k-75k, 53.9% for AGIs $75k-100k, 60.6% for AGIs $100k-200k, 75.0% for AGIs over 200k)
Averages for the 2004 tax year for zip code 89129, filed in 2005:
Average Adjusted Gross Income (AGI) in 2004: $63,063 (Individual Income Tax Returns)
Here:
$63,063
State:
$58,367
Salary/wage: $51,696 (reported on 87.8% of returns)
Here:
$51,696
State:
$42,695
(% of AGI for various income ranges: 253.2% for AGIs below $10k, 80.7% for AGIs $10k-25k, 85.0% for AGIs $25k-50k, 82.5% for AGIs $50k-75k, 84.8% for AGIs $75k-100k, 58.5% for AGIs over 100k)
Taxable interest for individuals: $1,938 (reported on 41.7% of returns)
This zip code:
$1,938
Nevada:
$3,867
(% of AGI for various income ranges: 9.6% for AGIs below $10k, 1.7% for AGIs $10k-25k, 1.0% for AGIs $25k-50k, 0.8% for AGIs $50k-75k, 0.8% for AGIs $75k-100k, 1.6% for AGIs over 100k)
Taxable dividends: $1,862 (reported on 20.0% of returns)
Here:
$1,862
State:
$5,770
(% of AGI for various income ranges: 5.8% for AGIs below $10k, 1.0% for AGIs $10k-25k, 0.5% for AGIs $25k-50k, 0.5% for AGIs $50k-75k, 0.4% for AGIs $75k-100k, 0.6% for AGIs over 100k)
Net capital gain/loss: +$25,150 (reported on 18.3% of returns)
Here:
+$25,150
State:
+$50,644
(% of AGI for various income ranges: 0.7% for AGIs below $10k, 0.7% for AGIs $10k-25k, 0.6% for AGIs $25k-50k, 1.0% for AGIs $50k-75k, 1.3% for AGIs $75k-100k, 14.0% for AGIs over 100k)
Profit/loss from business: +$13,778 (reported on 16.0% of returns)
Here:
+$13,778
State:
+$13,618
(% of AGI for various income ranges: 6.6% for AGIs below $10k, 5.0% for AGIs $10k-25k, 3.1% for AGIs $25k-50k, 3.1% for AGIs $50k-75k, 2.4% for AGIs $75k-100k, 3.9% for AGIs over 100k)
IRA payment deduction: $3,120 (reported on 2.6% of returns)
89129:
$3,120
Nevada:
$3,054
(% of AGI for various income ranges: 0.2% for AGIs $10k-25k, 0.2% for AGIs $25k-50k, 0.1% for AGIs $50k-75k, 0.1% for AGIs $75k-100k, 0.1% for AGIs over 100k)
Self-employed pension: $14,115 (reported on 0.6% of returns)
Here:
$14,115
Nevada:
$16,706
(% of AGI for various income ranges: 0.1% for AGIs $25k-50k, 0.1% for AGIs $50k-75k, 0.0% for AGIs $75k-100k, 0.2% for AGIs over 100k)
Total itemized deductions: $23,269 (25% of AGI, reported on 51.7% of returns)
Here:
$23,269
State:
$22,990
Here:
25.1% of AGI
State:
21.8% of AGI
(% of AGI for various income ranges: 57.7% for AGIs below $10k, 17.2% for AGIs $10k-25k, 19.5% for AGIs $25k-50k, 21.9% for AGIs $50k-75k, 22.0% for AGIs $75k-100k, 17.0% for AGIs over 100k)
Charity contributions deductions: $3,318 (3% of AGI, reported on 46.2% of returns)
Here:
$3,318
State:
$3,443
Here:
3.5% of AGI
State:
3.1% of AGI
(% of AGI for various income ranges: 2.5% for AGIs below $10k, 1.3% for AGIs $10k-25k, 1.8% for AGIs $25k-50k, 2.3% for AGIs $50k-75k, 2.6% for AGIs $75k-100k, 2.7% for AGIs over 100k)
Total tax: $9,766 (reported on 82.1% of returns)
89129:
$9,766
State:
$10,585
(% of AGI for various income ranges: 7.5% for AGIs below $10k, 4.4% for AGIs $10k-25k, 6.9% for AGIs $25k-50k, 8.8% for AGIs $50k-75k, 9.7% for AGIs $75k-100k, 17.6% for AGIs over 100k)
Earned income credit: $1,566 (reported on 9.9% of returns)
Here:
$1,566
State:
$1,676
Percentage of individuals using paid preparers for their 2004 taxes: 57.1%
Here:
57%
State:
60%
(% for various income ranges: 47.3% for AGIs below $10k, 55.1% for AGIs $10k-25k, 55.9% for AGIs $25k-50k, 59.7% for AGIs $50k-75k, 58.7% for AGIs $75k-100k, 66.6% for AGIs over 100k)
Likely homosexual households (counted as self-reported same-sex unmarried-partner households)
Lesbian couples: 0.1% of all households
Gay men: 0.1% of all households
Household received Food Stamps/SNAP in the past 12 months: 1,572 Household did not receive Food Stamps/SNAP in the past 12 months: 19,546
Women who had a birth in the past 12 months: 746 (601 now married, 167 unmarried) Women who did not have a birth in the past 12 months: 12,317 (5,025 now married, 7,289 unmarried)
Housing units in zip code 89129 with a mortgage: 11,157 (814 second mortgage, 59 home equity loan, 498 both second mortgage and home equity loan) Houses without a mortgage: 72
Median monthly owner costs for units with a mortgage: $1,779 Median monthly owner costs for units without a mortgage: $562
Residents with income below the poverty level in 2022:
This zip code:
8.2%
Whole state:
12.5%
Residents with income below 50% of the poverty level in 2022:
This zip code:
4.5%
Whole state:
5.9%
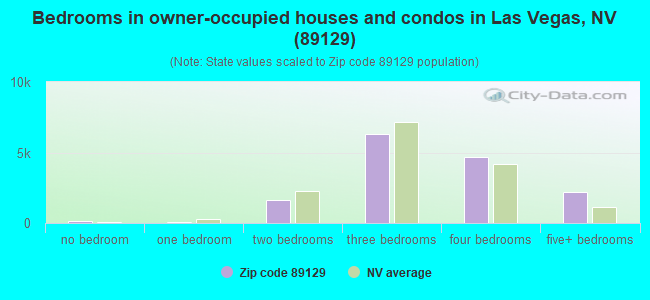
Median number of rooms in houses and condos:
Here:
6.4
State:
6.0
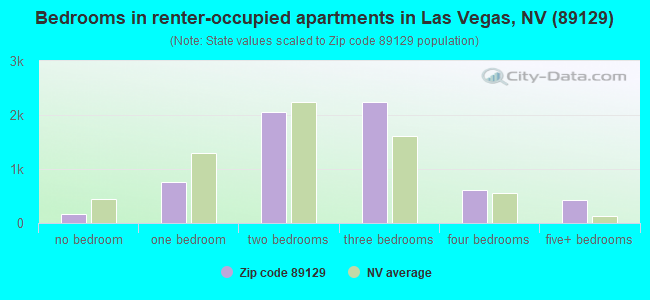
Median number of rooms in apartments:
Here:
4.9
State:
4.2
Notable locations in this zip code not listed on our city pages
Notable locations in zip code 89129: Durango Hills Water Resource Center (A), Las Vegas Fire and Rescue Station 45 (B), Las Vegas Metropolitan Police Department Northwest Substation (C), Top Kids Learning Enrichment Center (D). Display/hide their locations on the map
Churches in zip code 89129 include: Tabernacle of Praise Church (A), Kingdom Hall of Jehovahs Witnesses (B), New Day Christian Church (C), Mountain View Lutheran Church (D), Meadows Fellowship Foursquare Church (E), Word of Life Christian Center (F), West Craig Road Baptist Church (G). Display/hide their locations on the map
6,909 married couples with children.
3,026 single-parent households (1,002 men, 2,024 women).
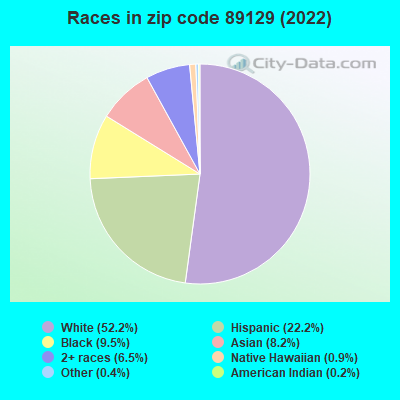
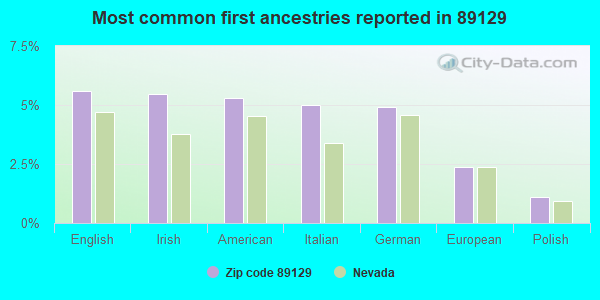
77.7% of residents of 89129 zip code speak English at home.
13.2% of residents speak Spanish at home (76% very well, 15% well, 7% not well, 2% not at all).
2.2% of residents speak other Indo-European language at home (72% very well, 19% well, 9% not well, 1% not at all).
5.8% of residents speak Asian or Pacific Island language at home (75% very well, 19% well, 6% not well, 1% not at all).
1.3% of residents speak other language at home (66% very well, 12% well, 21% not well).
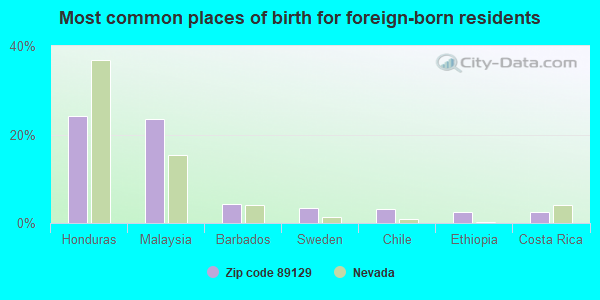
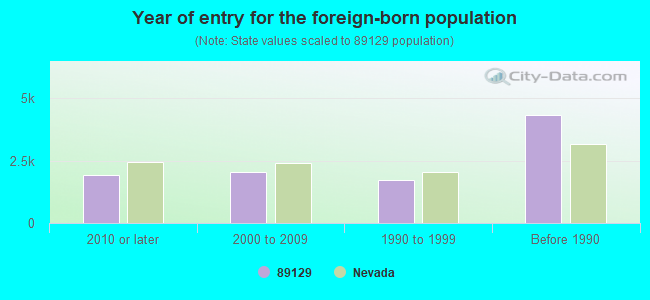
Foreign born population: 8,668 (15.7%) (65.6% of them are naturalized citizens)
Major facilities with environmental interests located in this zip code:
DOROTHY EISENBERG ELEMENTARY SCHOOL (7770 DELHI AVENUE in LAS VEGAS, NV)
(Geographic Names Information System) (National Center for Education Statistics) - STATE ID-02-118 Organizations: CLARK CO SCH DIST (SCHOOL DISTRICT)
Alternative names: EISENBERG, DOROTHY ELEM SCH
MARC KAHRE ELEMENTARY SCHOOL (7887 W. GOWAN RD in LAS VEGAS, NV)
(Geographic Names Information System) (National Center for Education Statistics) - STATE ID-02-133 Organizations: CLARK CO SCH DIST (SCHOOL DISTRICT)
Alternative names: KAHRE, MARC ELEM
RUTHE DESKIN ELEMENTARY SCHOOL (4550 N PIONEER in LAS VEGAS, NV)
(Geographic Names Information System) (National Center for Education Statistics) - STATE ID-02-106 Organizations: CLARK CO SCH DIST (SCHOOL DISTRICT)
Alternative names: DESKIN, RUTHE ELEM
CENTENNIAL HS (10200 CENTENNIAL PKWY in LAS VEGAS, NV)
(National Center for Education Statistics) - STATE ID-02-607 Organizations: CLARK CO SCH DIST (SCHOOL DISTRICT)
GAREHIME, EDITH ELEM (3850 CAMPBELL ROAD in LAS VEGAS, NV)
(National Center for Education Statistics) - STATE ID-02-167 Organizations: CLARK CO SCH DIST (SCHOOL DISTRICT)
LEAVITT, JUDGE M E MIDSCH (4701 QUADREL STREET in LAS VEGAS, NV)
(National Center for Education Statistics) - STATE ID-02-341 Organizations: CLARK CO SCH DIST (SCHOOL DISTRICT)
MOLASKY, IRWIN & SUSAN MIDSCH (7801 W. GILMORE AV. in LAS VEGAS, NV)
(National Center for Education Statistics) - STATE ID-02-333 Organizations: CLARK CO SCH DIST (SCHOOL DISTRICT)
TARR, SHEILA ELEM (9400 W. GILMORE AVENUE in LAS VEGAS, NV)
(National Center for Education Statistics) - STATE ID-02-285 Organizations: CLARK CO SCH DIST (SCHOOL DISTRICT)
D G S ENGINEERING (4927 N TENAYA WY in LAS VEGAS, NV)
(Resource Conservation and Recovery Act (tracking hazardous waste)) Organizations: D S POTTER (CONTACT/OWNER)
D C VIENT INC (5305 LA PATERA LN in LAS VEGAS, NV)
(Resource Conservation and Recovery Act (tracking hazardous waste))
PAINT WIZARD (4012 FEATHERSTONE LN in LAS VEGAS, NV)
(Resource Conservation and Recovery Act (tracking hazardous waste))
DESERT CLEANERS (7450 W CHEYENNE in LAS VEGAS, NV)
(Resource Conservation and Recovery Act (tracking hazardous waste))
Housing units lacking complete plumbing facilities: 0.4% Housing units lacking complete kitchen facilities: 0.9%
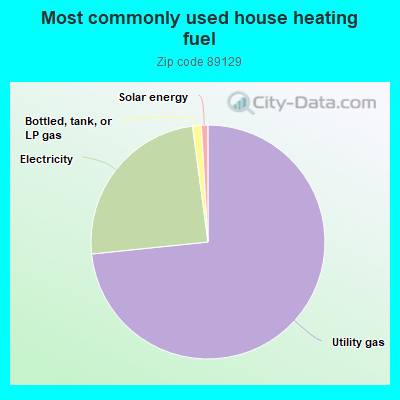
73.0%Utility gas
24.4%Electricity
1.2%Bottled, tank, or LP gas
0.9%Solar energy
Population in 1990: 5,610. Population change in the 1990s: +26,831 (+478.3%).
Place of birth for U.S.-born residents:
This state: 14,493
Northeast: 3,889
Midwest: 6,109
South: 4,844
West: 15,712
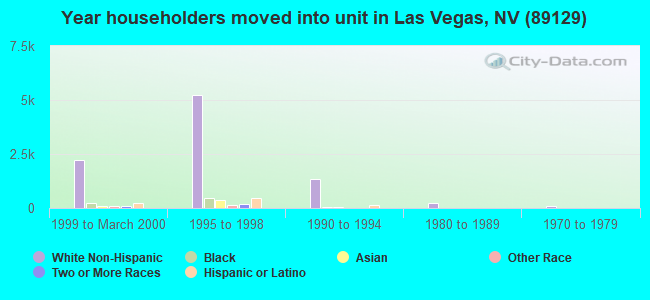
28% of the 89129 zip code residents lived in the same house 5 years ago. Out of people who lived in different houses, 58% lived in this county. Out of people who lived in different counties, 50% lived in Nevada.
89% of the 89129 zip code residents lived in the same house 1 year ago. Out of people who lived in different houses, 61% moved from this county. Out of people who lived in different houses, 5% moved from different county within same state. Out of people who lived in different houses, 37% moved from different state. Out of people who lived in different houses, 0% moved from abroad.
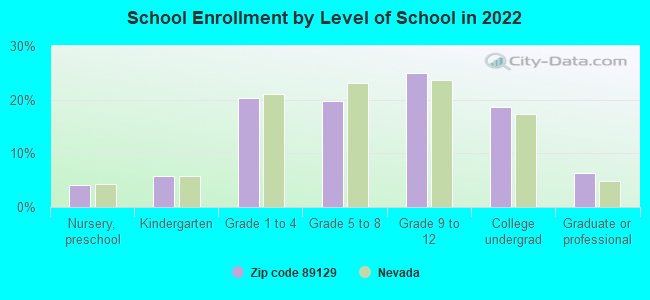
Private vs. public school enrollment:
Students in private schools in grades 1 to 8 (elementary and middle school): 985
Here:
18.7%
Nevada:
12.9%
Students in private schools in grades 9 to 12 (high school): 411
Here:
12.8%
Nevada:
6.9%
Students in private undergraduate colleges: 469
Here:
19.8%
Nevada:
16.0%
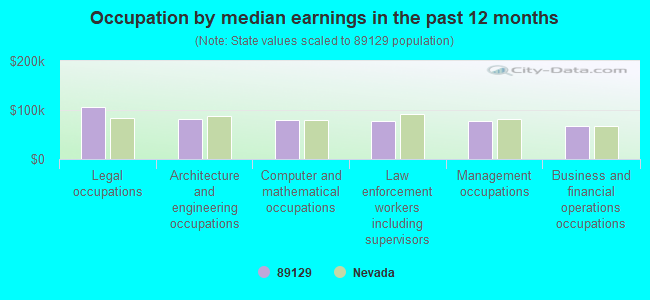
Occupation by median earnings in the past 12 months ($)
106,331Legal occupations
82,317Architecture and engineering occupations
80,385Computer and mathematical occupations
78,188Law enforcement workers including supervisors
76,716Management occupations
67,541Business and financial operations occupations
Companies with federal contracts located in this zip code (LAS VEGAS, NV):
LINMARR ASSOCIATES, INC (4460 PARK ST; small business) : $14,770,328 in 669 contractsfrom 1999 to 2006
Contracts for Vehicular Brake, Steering, Axle, Wheel, and Track Components, Engine Fuel System Components, Nonaircraft, Vehicular Power Transmission Components, Diesel Engines and Components, and moreby Defense Logistics Agency, Army, Navy Signed by year:2000: $810,118; 2001: $1,219,356; 2002: $1,164,167; 2003: $1,051,917; 2004: $3,171,507; 2005: $4,533,248; 2006: $2,386,218.
Biggest contracts:
$613,074 with Defense Logistics Agency for Vehicular Brake, Steering, Axle, Wheel, and Track Components. Signed on 2006-04-14. Completion date: 2007-02-24.
$257,957 with Defense Logistics Agency for Engine Fuel System Components, Nonaircraft. Signed on 2001-07-20. Completion date: 2002-08-29.
$251,724 with Defense Logistics Agency for Vehicular Power Transmission Components. Signed on 2005-10-29. Completion date: 2006-02-26.
$236,871 with Defense Logistics Agency for Diesel Engines and Components. Signed on 2004-10-06. Completion date: 2005-02-20.
TECHNICAL SOLUTIONS GROUP INTE (3804 TRIORA ST; small business) : $798,520 in 8 contractsfrom 2001 to 2005
Contracts for Decontaminating and Impregnating Equipment, Laboratory Equipment and Supplies, Other ADP and Telecommunications Services (includes data storage on tapes, compact disks, etc.), Miscellaneous Materials Handling Equipment by Army, Defense Threat Reduction Agency, Department of State, Navy, and others Signed by year:2000: $0; 2001: $215,000; 2002: $0; 2003: $423,400; 2004: $0; 2005: $160,120; 2006: $0.
Biggest contracts:
$365,400 with Army for Decontaminating and Impregnating Equipment. Signed on 2003-01-14. Completion date: 2003-02-13.
$215,000 with Army for Laboratory Equipment and Supplies. Signed on 2001-03-28. Completion date: 2001-04-05.
$120,000 with Defense Threat Reduction Agency for Other ADP and Telecommunications Services (includes data storage on tapes, compact disks, etc.). Signed on 2005-10-30. Completion date: 2005-11-18.
$29,000 with Department of State for Miscellaneous Materials Handling Equipment. Signed on 2003-09-15. Completion date: 2003-11-15.
NORCOM,INC (7518 ALAMO SUMMIT DRIVE; small business) : $608,554 in 37 contractsfrom 2002 to 2006
Contracts for ADP Software, ADP Input/Output and Storage Devices, ADPE System Configuration, Miscellaneous Special Industry Machinery, and moreby Defense Logistics Agency, Air Force, Army Signed by year:2000: $0; 2001: $0; 2002: $67,945; 2003: $195,741; 2004: $160,864; 2005: $168,459; 2006: $15,545.
Biggest contracts:
$105,000 with Defense Logistics Agency for ADP Software. Signed on 2005-09-26. Completion date: 2006-09-30.
$39,046 with Air Force for ADP Software. Taking place in FL. Signed on 2003-09-09. Completion date: 2003-10-09.
$25,195 with Air Force for ADP Input/Output and Storage Devices. Signed on 2002-09-24. Completion date: 2002-10-30.
$22,200 with Army for ADPE System Configuration. Taking place in OK. Signed on 2003-06-12. Completion date: 2003-07-10.
AUDIO VISUAL SOLUTIONS INC (7121 W CRAIG RD 113-193; small business) : $107,062 in 5 contractsfrom 2003 to 2005
Contracts for Installation of Equipment -- Communication, Detection, and Coherent Radiation Equipment, Communication Training Devices, Photographic Projection Equipment, Miscellaneous Communication Equipment, and moreby Air Force Signed by year:2000: $0; 2001: $0; 2002: $0; 2003: $44,723; 2004: $0; 2005: $62,339; 2006: $0.
Biggest contracts:
$44,723 with Air Force for Installation of Equipment -- Communication, Detection, and Coherent Radiation Equipment. Signed on 2003-06-16. Completion date: 2003-07-15.
$36,476 with Air Force for Communication Training Devices. Signed on 2005-09-09. Completion date: 2005-09-26.
$16,596 with Air Force for Photographic Projection Equipment. Signed on 2005-09-30. Completion date: 2005-10-29.
$5,695 with Air Force for Miscellaneous Communication Equipment. Signed on 2005-08-29. Completion date: 2005-10-14.
QUICK-BRAIN,INC (10412 ROCKY WATERS AVENUE; small business)
$75,283 with Navy for ADP Software. Signed on 2001-08-23. Completion date: 2001-10-05.
PATRIOT INDUSTRIES, LLC (3444 MARINER BEACH DR; small business)
$44,775 with Army for Warehouse Trucks and Tractors, Self-Propelled. Signed on 2002-06-13. Completion date: 2002-07-18.
THOMPSON PROFESSIONAL GROUP IN (3320 N BUFFALO DR STE 106; small business)
$7,559 with Air Force for Administrative and Service Buildings. Signed on 2000-03-16. Completion date: 2000-04-10.
PLAY ESSENTIALS, LLC (4469 MINERAL MINE DR) : $6,158 in 3 contractsfrom 2004 to 2005
$4,471 with Army for Miscellaneous Furniture and Fixtures. Signed on 2004-11-17. Completion date: 2004-12-16.
$1,944, same as above.Signed on 2004-11-17. Completion date: 2004-12-16.
-$257, same as above.Signed on 2005-08-08. Completion date: 2004-12-16.
Top industries in this zip code by the number of employees in 2005:
2002 - 2018 National Fire Incident Reporting System (NFIRS) incidents
According to the data from the years 2002 - 2018 the average number of fires per year is 59. The highest number of fires - 104 took place in 2011, and the least - 0 in 2003. The data has a growing trend.
When looking into fire subcategories, the most reports belonged to: Outside Fires (51.4%), and Structure Fires (30.2%).
Fire incident types reported to NFIRS in Zip Code 89129
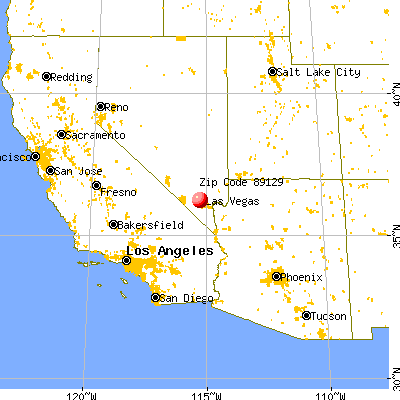


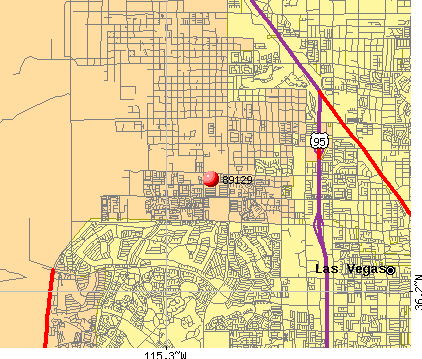 Nearest zip codes: 89134, 89149, 89128, 89144, 89130, 89145.
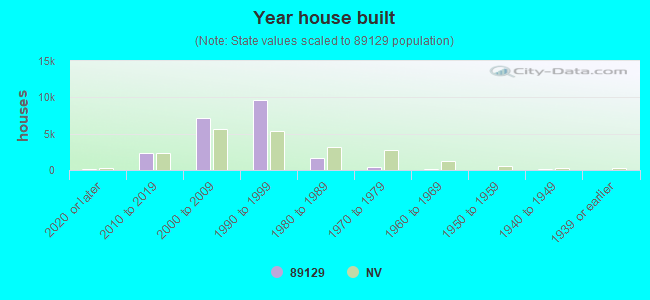


 According to the data from the years 2002 - 2018 the average number of fires per year is 59. The highest number of fires - 104 took place in 2011, and the least - 0 in 2003. The data has a growing trend.
 When looking into fire subcategories, the most reports belonged to: Outside Fires (51.4%), and Structure Fires (30.2%).