Estimated zip code population in 2022: 36,164 Zip code population in 2010: 33,015 Zip code population in 2000: 24,598
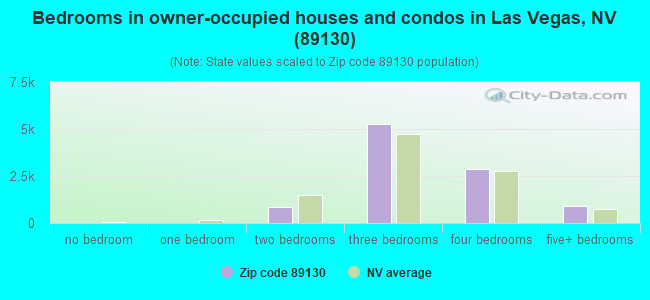
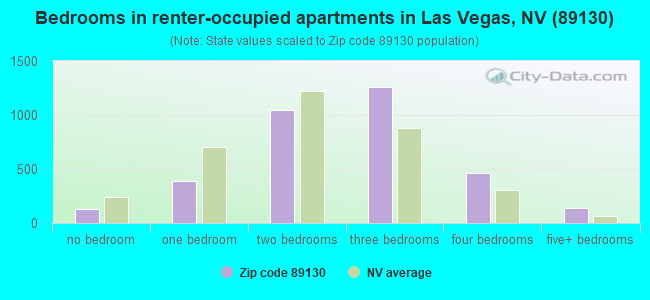
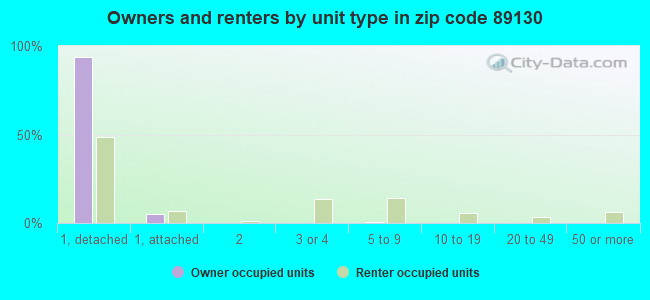
Houses and condos: 14,018 Renter-occupied apartments: 3,445
% of renters here:
26%
State:
40%
March 2022 cost of living index in zip code 89130: 98.7 (near average, U.S. average is 100)
Land area: 7.6 sq. mi. Water area: 0.0 sq. mi.
Population density: 4,730 people per square mile
(average).
OSM Map
General Map
Google Map
MSN Map
OSM Map
General Map
Google Map
MSN Map
OSM Map
General Map
Google Map
MSN Map
OSM Map
General Map
Google Map
MSN Map
Please wait while loading the map...
Real estate property taxes paid for housing units in 2022:
This zip code:
0.4% ($1,848)
Nevada:
0.4% ($1,889)
Median real estate property taxes paid for housing units with mortgages in 2022: $1,863 (0.4%) Median real estate property taxes paid for housing units with no mortgage in 2022: $1,805 (0.4%)
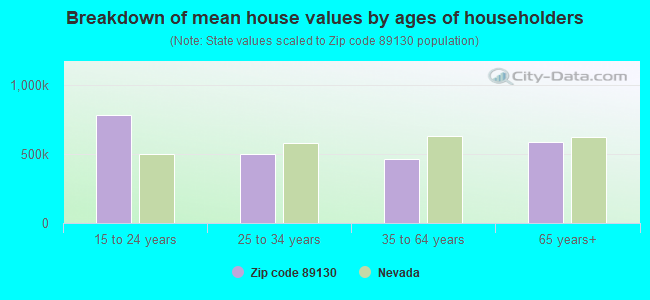
Estimated median house/condo value in 2022: $428,885
89130:
$428,885
Nevada:
$434,700
According to our research of Nevada and other state lists, there were 74 registered sex offenders living in 89130 zip code as of April 27, 2024. The ratio of all residents to sex offenders in zip code 89130 is 486 to 1. The ratio of registered sex offenders to all residents in this zip code is lower than the state average.
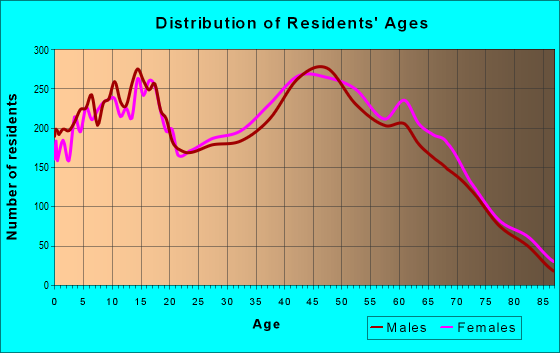
Median resident age:
This zip code:
42.0 years
Nevada median age:
39.0 years
Average household size:
This zip code:
2.7 people
Nevada:
2.6 people
Averages for the 2020 tax year for zip code 89130, filed in 2021:
Average Adjusted Gross Income (AGI) in 2020: $62,494 (Individual Income Tax Returns)
Here:
$62,494
State:
$78,964
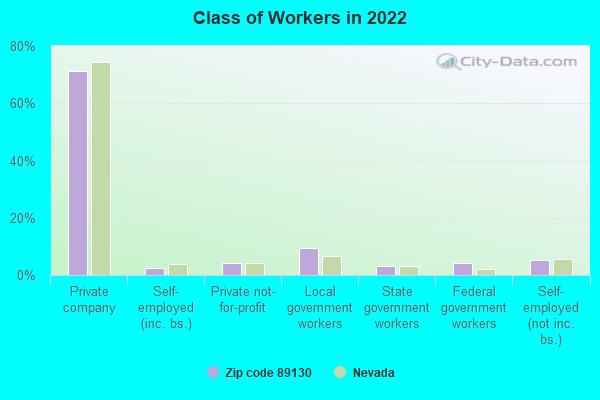
Salary/wage: $52,436 (reported on 80.3% of returns)
Here:
$52,436
State:
$54,472
(% of AGI for various income ranges: 1137.0% for AGIs below $25k, 3372.7% for AGIs $25k-50k, 6086.1% for AGIs $50k-75k, 8914.9% for AGIs $75k-100k, 16168.8% for AGIs $100k-200k, 51550.6% for AGIs over 200k)
Taxable interest for individuals: $1,049 (reported on 24.6% of returns)
This zip code:
$1,049
Nevada:
$3,521
(% of AGI for various income ranges: 10.1% for AGIs below $25k, 14.4% for AGIs $25k-50k, 26.6% for AGIs $50k-75k, 66.9% for AGIs $75k-100k, 72.3% for AGIs $100k-200k, 640.6% for AGIs over 200k)
Ordinary dividends: $3,969 (reported on 13.2% of returns)
Here:
$3,969
State:
$13,390
(% of AGI for various income ranges: 15.5% for AGIs below $25k, 26.5% for AGIs $25k-50k, 40.3% for AGIs $50k-75k, 100.5% for AGIs $75k-100k, 175.2% for AGIs $100k-200k, 1615.0% for AGIs over 200k)
Net capital gain/loss in AGI: +$11,624 (reported on 13.6% of returns)
Here:
+$11,624
State:
+$63,025
(% of AGI for various income ranges: 3.4% for AGIs below $25k, 23.1% for AGIs $25k-50k, 25.1% for AGIs $50k-75k, 171.6% for AGIs $75k-100k, 413.0% for AGIs $100k-200k, 9976.7% for AGIs over 200k)
Profit/loss from business: +$6,535 (reported on 14.7% of returns)
Here:
+$6,535
State:
+$11,500
(% of AGI for various income ranges: 84.5% for AGIs below $25k, 90.2% for AGIs $25k-50k, 119.2% for AGIs $50k-75k, 180.7% for AGIs $75k-100k, 280.5% for AGIs $100k-200k, 712.2% for AGIs over 200k)
Taxable individual retirement arrangement distribution: $17,741 (reported on 7.7% of returns)
89130:
$17,741
Nevada:
$23,628
(% of AGI for various income ranges: 48.9% for AGIs below $25k, 76.7% for AGIs $25k-50k, 163.7% for AGIs $50k-75k, 260.3% for AGIs $75k-100k, 619.6% for AGIs $100k-200k, 1777.8% for AGIs over 200k)
Total itemized deductions: $32,607 (reported on 9.3% of returns)
Here:
$32,607
State:
$44,173
(% of AGI for various income ranges: 62.0% for AGIs below $25k, 148.1% for AGIs $25k-50k, 344.7% for AGIs $50k-75k, 596.6% for AGIs $75k-100k, 1044.0% for AGIs $100k-200k, 8505.0% for AGIs over 200k)
Charity contributions: $7,362 (reported on 7.7% of returns)
Here:
$7,362
State:
$12,589
(% of AGI for various income ranges: 4.7% for AGIs below $25k, 16.9% for AGIs $25k-50k, 51.1% for AGIs $50k-75k, 104.4% for AGIs $75k-100k, 237.9% for AGIs $100k-200k, 1768.3% for AGIs over 200k)
Taxes paid: $5,436 (reported on 9.1% of returns)
89130:
$5,436
State:
$6,112
(% of AGI for various income ranges: 7.8% for AGIs below $25k, 26.3% for AGIs $25k-50k, 62.8% for AGIs $50k-75k, 117.3% for AGIs $75k-100k, 206.5% for AGIs $100k-200k, 886.7% for AGIs over 200k)
Earned income credit: $2,169 (reported on 15.1% of returns)
Here:
$2,169
State:
$2,214
(% of AGI for various income ranges: 86.8% for AGIs below $25k, 62.1% for AGIs $25k-50k, 1.0% for AGIs $50k-75k)
Percentage of individuals using paid preparers for their 2020 taxes: 92.9%
Here:
93%
State:
93%
(% for various income ranges: 92.2% for AGIs below $25k, 93.8% for AGIs $25k-50k, 92.7% for AGIs $50k-75k, 92.6% for AGIs $75k-100k, 93.2% for AGIs $100k-200k, 94.1% for AGIs over 200k)
Averages for the 2012 tax year for zip code 89130, filed in 2013:
Average Adjusted Gross Income (AGI) in 2012: $53,591 (Individual Income Tax Returns)
Here:
$53,591
State:
$61,164
Salary/wage: $47,920 (reported on 82.0% of returns)
Here:
$47,920
State:
$45,924
(% of AGI for various income ranges: 71.9% for AGIs below $25k, 78.7% for AGIs $25k-50k, 75.0% for AGIs $50k-75k, 73.5% for AGIs $75k-100k, 75.1% for AGIs $100k-200k, 57.5% for AGIs over 200k)
Taxable interest for individuals: $1,200 (reported on 26.8% of returns)
This zip code:
$1,200
Nevada:
$3,137
(% of AGI for various income ranges: 0.8% for AGIs below $25k, 0.5% for AGIs $25k-50k, 0.5% for AGIs $50k-75k, 0.3% for AGIs $75k-100k, 0.4% for AGIs $100k-200k, 1.9% for AGIs over 200k)
Ordinary dividends: $4,060 (reported on 14.4% of returns)
Here:
$4,060
State:
$11,762
(% of AGI for various income ranges: 2.7% for AGIs below $25k, 0.9% for AGIs $25k-50k, 0.8% for AGIs $50k-75k, 0.7% for AGIs $75k-100k, 0.7% for AGIs $100k-200k, 2.3% for AGIs over 200k)
Net capital gain/loss in AGI: +$4,745 (reported on 11.5% of returns)
Here:
+$4,745
State:
+$33,127
(% of AGI for various income ranges: 0.2% for AGIs $50k-75k, 0.3% for AGIs $75k-100k, 0.7% for AGIs $100k-200k, 7.1% for AGIs over 200k)
Profit/loss from business: +$8,825 (reported on 13.5% of returns)
Here:
+$8,825
State:
+$12,567
(% of AGI for various income ranges: 6.5% for AGIs below $25k, 2.3% for AGIs $25k-50k, 1.8% for AGIs $50k-75k, 1.7% for AGIs $75k-100k, 1.3% for AGIs $100k-200k, 2.9% for AGIs over 200k)
Taxable individual retirement arrangement distribution: $14,190 (reported on 8.9% of returns)
89130:
$14,190
Nevada:
$20,808
(% of AGI for various income ranges: 2.8% for AGIs below $25k, 2.1% for AGIs $25k-50k, 2.3% for AGIs $50k-75k, 2.1% for AGIs $75k-100k, 2.9% for AGIs $100k-200k, 1.4% for AGIs over 200k)
Self-employment retirement plans: $13,633 (reported on 0.2% of returns)
89130:
$13,633
Nevada:
$22,197
Total itemized deductions: $20,872 (24% of AGI, reported on 34.6% of returns)
Here:
$20,872
State:
$26,148
Here:
24.5% of AGI
State:
20.0% of AGI
(% of AGI for various income ranges: 10.1% for AGIs below $25k, 12.4% for AGIs $25k-50k, 13.7% for AGIs $50k-75k, 14.1% for AGIs $75k-100k, 14.6% for AGIs $100k-200k, 13.7% for AGIs over 200k)
Charity contributions: $3,133 (reported on 29.0% of returns)
Here:
$3,133
State:
$4,329
(% of AGI for various income ranges: 0.7% for AGIs below $25k, 1.2% for AGIs $25k-50k, 1.8% for AGIs $50k-75k, 1.7% for AGIs $75k-100k, 2.2% for AGIs $100k-200k, 1.8% for AGIs over 200k)
Taxes paid: $3,789 (reported on 34.1% of returns)
89130:
$3,789
State:
$5,116
(% of AGI for various income ranges: 1.7% for AGIs below $25k, 2.1% for AGIs $25k-50k, 2.5% for AGIs $50k-75k, 2.6% for AGIs $75k-100k, 2.6% for AGIs $100k-200k, 2.3% for AGIs over 200k)
Earned income credit: $2,195 (reported on 16.6% of returns)
Here:
$2,195
State:
$2,279
(% of AGI for various income ranges: 6.1% for AGIs below $25k, 1.0% for AGIs $25k-50k)
Percentage of individuals using paid preparers for their 2012 taxes: 52.3%
Here:
52%
State:
55%
(% for various income ranges: 47.9% for AGIs below $25k, 50.5% for AGIs $25k-50k, 54.9% for AGIs $50k-75k, 56.0% for AGIs $75k-100k, 59.5% for AGIs $100k-200k, 72.0% for AGIs over 200k)
Averages for the 2004 tax year for zip code 89130, filed in 2005:
Average Adjusted Gross Income (AGI) in 2004: $52,861 (Individual Income Tax Returns)
Here:
$52,861
State:
$58,367
Salary/wage: $46,945 (reported on 85.9% of returns)
Here:
$46,945
State:
$42,695
(% of AGI for various income ranges: 200.0% for AGIs below $10k, 78.1% for AGIs $10k-25k, 82.6% for AGIs $25k-50k, 78.1% for AGIs $50k-75k, 81.3% for AGIs $75k-100k, 66.6% for AGIs over 100k)
Taxable interest for individuals: $1,572 (reported on 41.5% of returns)
This zip code:
$1,572
Nevada:
$3,867
(% of AGI for various income ranges: 12.5% for AGIs below $10k, 1.9% for AGIs $10k-25k, 1.0% for AGIs $25k-50k, 1.1% for AGIs $50k-75k, 0.8% for AGIs $75k-100k, 1.4% for AGIs over 100k)
Taxable dividends: $2,197 (reported on 19.6% of returns)
Here:
$2,197
State:
$5,770
(% of AGI for various income ranges: 6.1% for AGIs below $10k, 1.3% for AGIs $10k-25k, 0.7% for AGIs $25k-50k, 0.5% for AGIs $50k-75k, 0.6% for AGIs $75k-100k, 1.0% for AGIs over 100k)
Net capital gain/loss: +$11,898 (reported on 17.7% of returns)
Here:
+$11,898
State:
+$50,644
(% of AGI for various income ranges: -2.6% for AGIs below $10k, -0.1% for AGIs $10k-25k, 0.5% for AGIs $25k-50k, 0.8% for AGIs $50k-75k, 1.2% for AGIs $75k-100k, 10.3% for AGIs over 100k)
Profit/loss from business: +$8,411 (reported on 13.8% of returns)
Here:
+$8,411
State:
+$13,618
(% of AGI for various income ranges: -6.1% for AGIs below $10k, 3.8% for AGIs $10k-25k, 1.7% for AGIs $25k-50k, 1.6% for AGIs $50k-75k, 2.3% for AGIs $75k-100k, 2.6% for AGIs over 100k)
Profit/loss from farming: +$2,667 (reported on 0.1% of returns)
Here:
+$2,667
State:
-$10,804
IRA payment deduction: $3,030 (reported on 2.5% of returns)
89130:
$3,030
Nevada:
$3,054
(% of AGI for various income ranges: 0.2% for AGIs $10k-25k, 0.1% for AGIs $25k-50k, 0.2% for AGIs $50k-75k, 0.1% for AGIs $75k-100k, 0.1% for AGIs over 100k)
Self-employed pension: $11,460 (reported on 0.5% of returns)
Here:
$11,460
Nevada:
$16,706
(% of AGI for various income ranges: 0.1% for AGIs $50k-75k, 0.1% for AGIs $75k-100k, 0.2% for AGIs over 100k)
Total itemized deductions: $27,868 (37% of AGI, reported on 51.2% of returns)
Here:
$27,868
State:
$22,990
Here:
37.0% of AGI
State:
21.8% of AGI
(% of AGI for various income ranges: 38.4% for AGIs below $10k, 15.6% for AGIs $10k-25k, 62.3% for AGIs $25k-50k, 21.7% for AGIs $50k-75k, 20.9% for AGIs $75k-100k, 17.4% for AGIs over 100k)
Charity contributions deductions: $2,591 (3% of AGI, reported on 46.2% of returns)
Here:
$2,591
State:
$3,443
Here:
3.3% of AGI
State:
3.1% of AGI
(% of AGI for various income ranges: 2.0% for AGIs below $10k, 1.2% for AGIs $10k-25k, 2.1% for AGIs $25k-50k, 2.4% for AGIs $50k-75k, 2.5% for AGIs $75k-100k, 2.3% for AGIs over 100k)
Total tax: $6,902 (reported on 80.2% of returns)
89130:
$6,902
State:
$10,585
(% of AGI for various income ranges: 5.0% for AGIs below $10k, 4.0% for AGIs $10k-25k, 6.4% for AGIs $25k-50k, 8.5% for AGIs $50k-75k, 10.1% for AGIs $75k-100k, 15.4% for AGIs over 100k)
Earned income credit: $1,661 (reported on 10.8% of returns)
Here:
$1,661
State:
$1,676
Percentage of individuals using paid preparers for their 2004 taxes: 58.2%
Here:
58%
State:
60%
(% for various income ranges: 51.0% for AGIs below $10k, 57.6% for AGIs $10k-25k, 57.4% for AGIs $25k-50k, 59.9% for AGIs $50k-75k, 59.3% for AGIs $75k-100k, 65.6% for AGIs over 100k)
Likely homosexual households (counted as self-reported same-sex unmarried-partner households)
Lesbian couples: 0.3% of all households
Gay men: 0.0% of all households
Household received Food Stamps/SNAP in the past 12 months: 1,008 Household did not receive Food Stamps/SNAP in the past 12 months: 12,144
Women who had a birth in the past 12 months: 463 (380 now married, 99 unmarried) Women who did not have a birth in the past 12 months: 7,359 (3,302 now married, 4,043 unmarried)
Housing units in zip code 89130 with a mortgage: 7,456 (395 second mortgage, 272 both second mortgage and home equity loan) Houses without a mortgage: 89
Median monthly owner costs for units with a mortgage: $1,586 Median monthly owner costs for units without a mortgage: $473
Residents with income below the poverty level in 2022:
This zip code:
10.0%
Whole state:
12.5%
Residents with income below 50% of the poverty level in 2022:
This zip code:
4.2%
Whole state:
5.9%
Median number of rooms in houses and condos:
Here:
6.1
State:
6.0
Median number of rooms in apartments:
Here:
4.9
State:
4.2
Notable locations in this zip code not listed on our city pages
Churches in zip code 89130 include: The Potters Place (A), Sonrise Community Church (B), Kingdom Hall of Jehovahs Witnesses (C), Gurdwara Baba Deep Singh (D), Connecting Point Christian Church (E), Canyon Ridge Christian Church (F), Calvary Chapel of Lone Mountain (G), One Body in Christ Christian Church (H), Lone Mountain Missionary Baptist Church (I). Display/hide their locations on the map
Tourist attractions (not listed on the city page) : Devco-Holden (Arcades & Amusements; 4440 North Rancho), The Las Vegas Gambler (Arcades & Amusements; 5509 Oakwood Ridge St), Grand Canyon Tours (Tours & Charters; 4343 North Rancho Drive), Hoover Dam Tour Company (Tours & Charters; 4343 North Rancho Drive), Grand Canyon Tour Company (Tours & Charters; 4343 N Rancho Rd), A Grand Canyon Tour (Tours & Charters; 4343 North Rancho Drive), Las Vegas Grand Canyon Tour & Travel (Tours & Charters; 4343 North Rancho Drive), C.C.D. Advisors- Inc. (Tours & Charters; 4936 Link Side Drive).
4,842 married couples with children.
1,613 single-parent households (323 men, 1,290 women).
78.5% of residents of 89130 zip code speak English at home.
15.6% of residents speak Spanish at home (66% very well, 19% well, 13% not well, 2% not at all).
1.6% of residents speak other Indo-European language at home (68% very well, 24% well, 8% not well).
3.7% of residents speak Asian or Pacific Island language at home (82% very well, 12% well, 6% not well).
0.7% of residents speak other language at home (71% very well, 15% well, 14% not well).
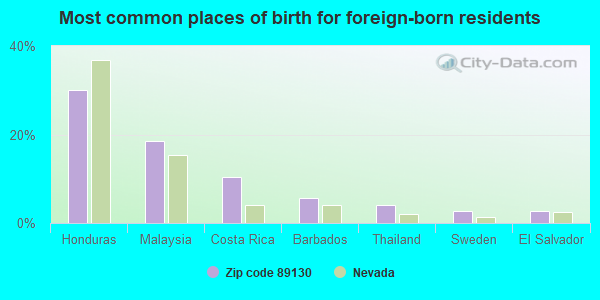
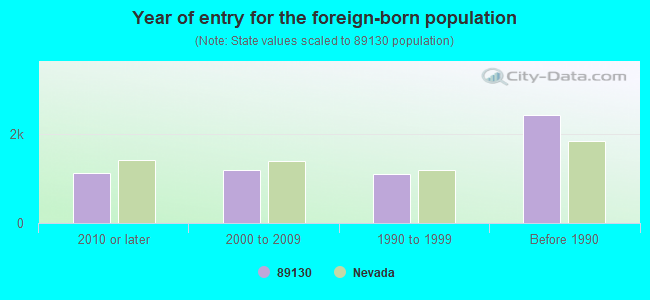
Foreign born population: 5,104 (14.1%) (66.2% of them are naturalized citizens)
Major facilities with environmental interests located in this zip code:
ERNEST MAY ELEMENTARY SCHOOL (6350 W.WASHBURN RD in LAS VEGAS, NV)
(Geographic Names Information System) (National Center for Education Statistics) - STATE ID-02-132 Organizations: CLARK CO SCH DIST (SCHOOL DISTRICT)
Alternative names: MAY, ERNEST ELEM
PARSON ELEMENTARY SCHOOL (4100 THOM BOULEVARD in LAS VEGAS, NV)
(Geographic Names Information System) (National Center for Education Statistics) - STATE ID-02-110 Organizations: CLARK CO SCH DIST (SCHOOL DISTRICT)
CARL, KAY ELEM (5625 CORBETT STREET in LAS VEGAS, NV)
(National Center for Education Statistics) - STATE ID-02-171 Organizations: CLARK CO SCH DIST (SCHOOL DISTRICT)
LIED MIDSCH (5350 W. TROPICAL PKWY in LAS VEGAS, NV)
(National Center for Education Statistics) - STATE ID-02-331 Organizations: CLARK CO SCH DIST (SCHOOL DISTRICT)
NEAL, JOSEPH ELEM (6651 W. AZURE AVENUE in LAS VEGAS, NV)
(National Center for Education Statistics) - STATE ID-02-170 Organizations: CLARK CO SCH DIST (SCHOOL DISTRICT)
GREENBACK STORE (DOLLAR TREE) (4919 WEST CRAIG ROAD in LAS VEGAS, NV)
(Integrated Compliance Information System) - ICIS-09-2004-0320, FORMAL ENFORCEMENT ACTION
CHEVRON STN 9 8644 (2810 N RANCHO DR in LAS VEGAS, NV)
(Resource Conservation and Recovery Act (tracking hazardous waste)) Organizations: CHEVRON USA PRODUCTS CO (CONTACT/OWNER)
ROBISON PREZIOSO INC (6425 W RICHMAR in LAS VEGAS, NV)
(Resource Conservation and Recovery Act (tracking hazardous waste)) Organizations: JERRY HIRSHBURGER (CONTACT/OWNER)
USDOI BLM NYE COUNTY (PUBLIC LAND IN NYE COUNTY in LAS VEGAS, NV) . Federal Facility. BUREAU OF LAND MANAGEMENT
(Resource Conservation and Recovery Act (tracking hazardous waste)) Organizations: US DOI BLM (CONTACT/OPERATOR)
, U S D O I BLM (CONTACT/OWNER)
Alternative names: U S D O I B L M, US DOI BLM
AFFORDABLE CLEANERS (4831 W CRAIG RD in LAS VEGAS, NV)
(Resource Conservation and Recovery Act (tracking hazardous waste)) Organizations: PETE AND GEORGE CONSTANTACOS (CONTACT/OWNER)
CHEVRON USA INC LAS VEGAS SUPPLY SITE (4950 N SLOAN RD in LAS VEGAS, NV)
(Resource Conservation and Recovery Act (tracking hazardous waste))
FIRST RECOVERY (5225 E COMPO GRANDE STE A in LAS VEGAS, NV)
Housing units lacking complete plumbing facilities: 0.2% Housing units lacking complete kitchen facilities: 0.3%
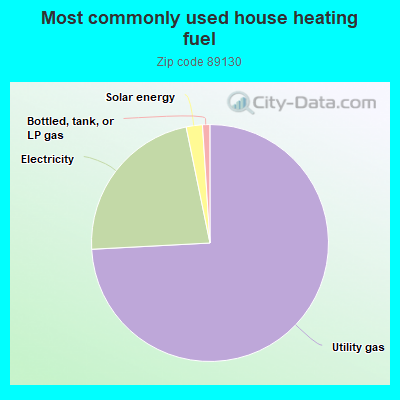
73.5%Utility gas
22.4%Electricity
2.2%Solar energy
1.0%Bottled, tank, or LP gas
Population in 1990: 4,383. Population change in the 1990s: +20,215 (+461.2%).
Place of birth for U.S.-born residents:
This state: 10,166
Northeast: 2,960
Midwest: 4,459
South: 3,286
West: 9,240
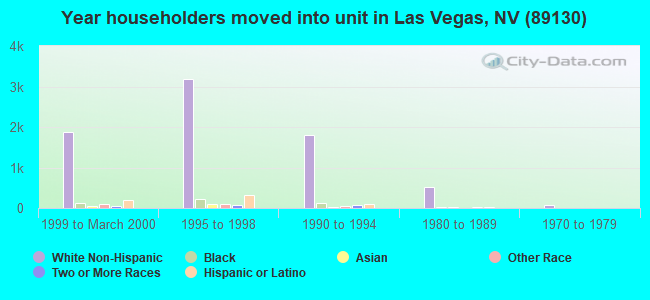
39% of the 89130 zip code residents lived in the same house 5 years ago. Out of people who lived in different houses, 55% lived in this county. Out of people who lived in different counties, 50% lived in Nevada.
90% of the 89130 zip code residents lived in the same house 1 year ago. Out of people who lived in different houses, 65% moved from this county. Out of people who lived in different houses, 2% moved from different county within same state. Out of people who lived in different houses, 34% moved from different state. Out of people who lived in different houses, 2% moved from abroad.
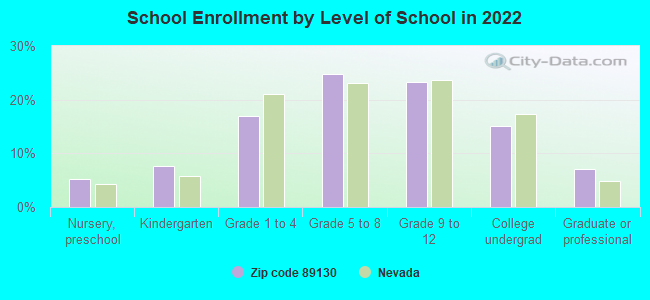
Private vs. public school enrollment:
Students in private schools in grades 1 to 8 (elementary and middle school): 225
Here:
7.1%
Nevada:
12.9%
Students in private schools in grades 9 to 12 (high school): 147
Here:
8.1%
Nevada:
6.9%
Students in private undergraduate colleges: 222
Here:
18.9%
Nevada:
16.0%
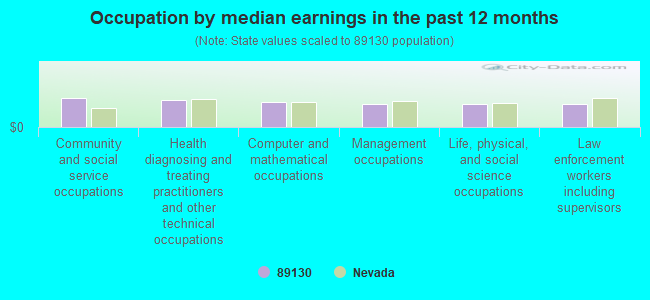
Occupation by median earnings in the past 12 months ($)
104,318Community and social service occupations
94,414Health diagnosing and treating practitioners and other technical occupations
87,818Computer and mathematical occupations
83,504Management occupations
81,979Life, physical, and social science occupations
80,604Law enforcement workers including supervisors
Companies with federal contracts located in this zip code (LAS VEGAS, NV):
MIDWEST MANAGEMENT TECHNOLOGY (7065 W ANN RD 130-415; small business) : $20,463,556 in 47 contractsfrom 1999 to 2005
Contracts for Maintenance, Repair and Rebuilding of Equipment -- Ground Effect Vehicles, Motor Vehicles, Trailers, and Cycles, Other Housekeeping Services, Facilities Operations Support Services, Fire Protection Services, and moreby Air Force, Defense Commissary Agency, Department of Defense Signed by year:2000: $5,800,288; 2001: $7,050,369; 2002: $2,392,606; 2003: $752,188; 2004: $2,638,571; 2005: -$158,056; 2006: $0.
Biggest contracts:
$2,804,685 with Air Force for Maintenance, Repair and Rebuilding of Equipment -- Ground Effect Vehicles, Motor Vehicles, Trailers, and Cycles. Taking place in MO. Signed on 2001-10-03. Completion date: 2001-11-01.
$1,874,990 with Defense Commissary Agency for Other Housekeeping Services. Taking place in NJ. Signed on 2004-08-10. Completion date: 2004-09-30.
$1,747,259 with Department of Defense for Other Housekeeping Services. Taking place in NJ. Signed on 2002-08-21. Completion date: 2003-09-30.
$1,683,287 with Air Force for Maintenance, Repair and Rebuilding of Equipment -- Ground Effect Vehicles, Motor Vehicles, Trailers, and Cycles. Taking place in AL. Signed on 2001-03-30. Completion date: 2001-03-28.
VISTA CHEVROLET LTD LLC (5501 DREXEL RD; small business) : $146,750 in 6 contractsfrom 2002 to 2006
Contracts for Motor Pool Operations by Department of Defense, Defense Threat Reduction Agency Signed by year:2000: $0; 2001: $0; 2002: $40,500; 2003: $45,000; 2004: $30,000; 2005: $25,000; 2006: $6,250.
Biggest contracts:
$40,500 with Department of Defense for Motor Pool Operations. Signed on 2002-04-26. Completion date: 2003-02-28.
$30,000 with Defense Threat Reduction Agency for Motor Pool Operations. Signed on 2004-04-30. Completion date: 2004-06-15.
$30,000 with Department of Defense for Motor Pool Operations. Signed on 2003-06-17. Completion date: 2003-02-28.
$25,000 with Defense Threat Reduction Agency for Motor Pool Operations. Signed on 2005-10-17. Completion date: 2006-10-12.
MERCHANT EXPO, LLC (7065 W ANN RD # 130-421; small business) : $86,859 in 7 contractsfrom 2003 to 2006
Contracts for Switches, ADP Support Equipment, Office Devices and Accessories, Miscellaneous Items, and moreby Navy, Army, National Oceanic and Atmospheric Administration/Under Secretary for Oceans and Atmosphere Signed by year:2000: $0; 2001: $0; 2002: $0; 2003: $6,615; 2004: $2,591; 2005: $24,013; 2006: $53,640.
Biggest contracts:
$29,550 with Navy for Switches. Signed on 2006-05-04. Completion date: 2006-05-26.
$21,505 with Army for ADP Support Equipment. Signed on 2006-04-13. Effective on 2006-04-05. Completion date: 2006-05-10.
$15,429 with National Oceanic and Atmospheric Administration/Under Secretary for Oceans and Atmosphere for Office Devices and Accessories. Signed on 2005-09-22. Completion date: 2005-11-10.
$8,584 with Army for Miscellaneous Items. Taking place in WY. Signed on 2005-08-04. Completion date: 2005-09-03.
SILOXANE TECHNOLOGIES OF NEVAD (7065 W ANN RD STE 130; small business) : $78,926 in 4 contractsfrom 2005 to 2006
$67,992 with Defense Logistics Agency for Packing and Gasket Materials. Signed on 2006-01-12. Completion date: 2006-03-31.
$6,920 with Defense Logistics Agency for Vehicular Furniture and Accessories. Signed on 2005-10-06. Completion date: 2005-11-21.
$3,594 with Defense Logistics Agency for Miscellaneous Fabricated Nonmetallic Materials. Signed on 2006-01-25. Completion date: 2006-03-07.
$420 with Navy for Miscellaneous Fabricated Nonmetallic Materials. Signed on 2005-06-03. Completion date: 2005-06-06.
ANGLE CONSTRUCTION, LLC (5664 NORTH RAINBOW BLVD; small business)
$8,255 with Air Force for Maintenance, Repair or Alteration of Real Property -- Highways, Roads, Streets, Bridges, and Railways (includes resurfacing). Signed on 2003-07-10. Completion date: 2003-07-24.
RHINO'S TURF EQUIPMENT INC (3531 N RANCHO; small business) : $7,988 in 2 contractsfrom 2004 to 2005
$4,394 with Bureau of Reclamation for Generators and Generators Sets, Electrical. Signed on 2004-08-04. Completion date: 2004-08-04.
$3,594 with Air Force for Maintenance, Repair and Rebuilding of Equipment -- Mechanical Power Transmission Equipment. Signed on 2005-06-14. Completion date: 2005-06-22.
AVCOMM INTERNATIONAL, INC (4930 WEST CHEYENNE AVE STE; small business)
$135 with Navy for Headsets, Handsets, Microphones and Speakers. Signed on 2006-05-03. Completion date: 2006-05-05.
Top industries in this zip code by the number of employees in 2005:
Accommodation and Food Services: Casino Hotels (500-999 employees: 2 establishments)
2002 - 2018 National Fire Incident Reporting System (NFIRS) incidents
According to the data from the years 2002 - 2018 the average number of fires per year is 62. The highest number of fires - 117 took place in 2017, and the least - 0 in 2003. The data has a growing trend.
When looking into fire subcategories, the most reports belonged to: Outside Fires (45.6%), and Structure Fires (31.5%).
Fire incident types reported to NFIRS in Zip Code 89130


+$2,667
-$10,804
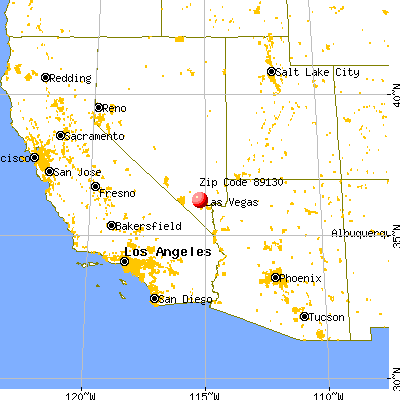
 Nearest zip codes: 89108, 89031, 89131, 89032, 89085, 89129.
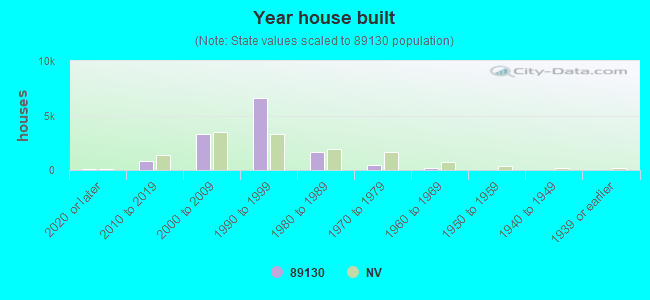


 According to the data from the years 2002 - 2018 the average number of fires per year is 62. The highest number of fires - 117 took place in 2017, and the least - 0 in 2003. The data has a growing trend.
 When looking into fire subcategories, the most reports belonged to: Outside Fires (45.6%), and Structure Fires (31.5%).