Estimated zip code population in 2022: 44,961
Zip code population in 2010: 31,143
Zip code population in 2000: 11,312
Houses and condos: 17,611
Renter-occupied apartments: 5,109
% of renters here:
31%State:
40%
March 2022 cost of living index in zip code 89149: 99.5
(near average, U.S. average is 100)
Land area: 12.0
sq. mi.
Water area: 0.0
sq. mi.
Population density: 3,744 people per square mile (average).
OSM Map
General Map
Google Map
MSN Map
OSM Map
General Map
Google Map
MSN Map
OSM Map
General Map
Google Map
MSN Map
OSM Map
General Map
Google Map
MSN Map
Please wait while loading the map...
Real estate property taxes paid for housing units in 2022:
This zip code:
0.5% ($2,855)Nevada:
0.4% ($1,889)
Median real estate property taxes paid for housing units with mortgages in 2022: $2,756 (0.5%)
Median real estate property taxes paid for housing units with no mortgage in 2022: $3,123 (0.5%)
Profiles of local businesses
Business Search - 14 Million verified businesses
Males: 21,624 Females: 23,342
For population 25 years and over in 89149:
High school or higher: 93.8%Bachelor's degree or higher: 36.8%Graduate or professional degree: 13.5%Unemployed: 4.8%Mean travel time to work (commute): 26.1 minutes
For population 15 years and over in 89149:
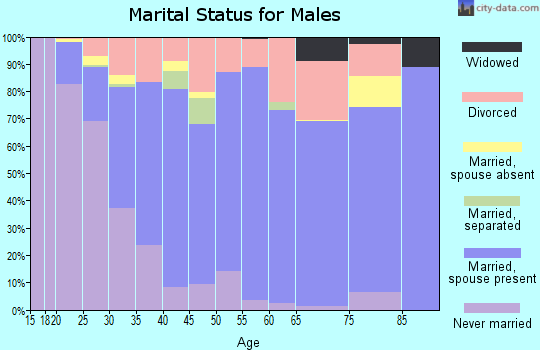
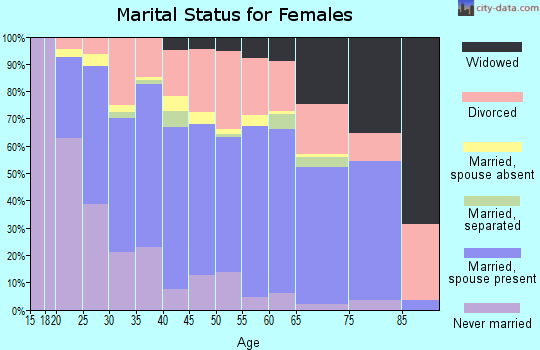
Never married: 30.1%Now married: 52.4%Separated: 1.6%Widowed: 4.4%Divorced: 11.5%
Zip code 89149 compared to state average:
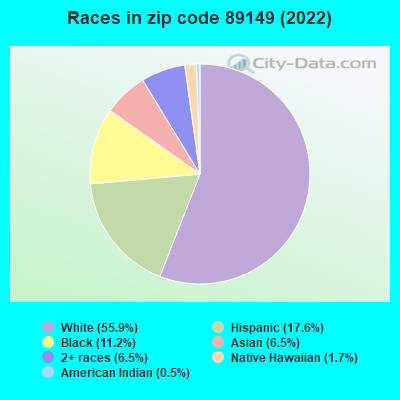
Foreign-born population percentage below state average. Length of stay since moving in above state average. House age below state average. 25,118 55.9% White 7,932 17.6% Hispanic or Latino 5,039 11.2% Black 2,908 6.5% Asian 2,907 6.5% Two or more races 785 1.7% Native Hawaiian and Other 236 0.5% American Indian 32 0.07% Some other race
Data:
Median household income ($)
Median household income (% change since 2000)
Household income diversity
Ratio of average income to average house value (%)
Ratio of average income to average rent
Median household income ($) - White
Median household income ($) - Black or African American
Median household income ($) - Asian
Median household income ($) - Hispanic or Latino
Median household income ($) - American Indian and Alaska Native
Median household income ($) - Multirace
Median household income ($) - Other Race
Median household income for houses/condos with a mortgage ($)
Median household income for apartments without a mortgage ($)
Races - White alone (%)
Races - White alone (% change since 2000)
Races - Black alone (%)
Races - Black alone (% change since 2000)
Races - American Indian alone (%)
Races - American Indian alone (% change since 2000)
Races - Asian alone (%)
Races - Asian alone (% change since 2000)
Races - Hispanic (%)
Races - Hispanic (% change since 2000)
Races - Native Hawaiian and Other Pacific Islander alone (%)
Races - Native Hawaiian and Other Pacific Islander alone (% change since 2000)
Races - Two or more races (%)
Races - Two or more races (% change since 2000)
Races - Other race alone (%)
Races - Other race alone (% change since 2000)
Racial diversity
Unemployment (%)
Unemployment (% change since 2000)
Unemployment (%) - White
Unemployment (%) - Black or African American
Unemployment (%) - Asian
Unemployment (%) - Hispanic or Latino
Unemployment (%) - American Indian and Alaska Native
Unemployment (%) - Multirace
Unemployment (%) - Other Race
Population density (people per square mile)
Population - Males (%)
Population - Females (%)
Population - Males (%) - White
Population - Males (%) - Black or African American
Population - Males (%) - Asian
Population - Males (%) - Hispanic or Latino
Population - Males (%) - American Indian and Alaska Native
Population - Males (%) - Multirace
Population - Males (%) - Other Race
Population - Females (%) - White
Population - Females (%) - Black or African American
Population - Females (%) - Asian
Population - Females (%) - Hispanic or Latino
Population - Females (%) - American Indian and Alaska Native
Population - Females (%) - Multirace
Population - Females (%) - Other Race
Coronavirus confirmed cases (Apr 27, 2024)
Deaths caused by coronavirus (Apr 27, 2024)
Coronavirus confirmed cases (per 100k population) (Apr 27, 2024)
Deaths caused by coronavirus (per 100k population) (Apr 27, 2024)
Daily increase in number of cases (Apr 27, 2024)
Weekly increase in number of cases (Apr 27, 2024)
Cases doubled (in days) (Apr 27, 2024)
Hospitalized patients (Apr 18, 2022)
Negative test results (Apr 18, 2022)
Total test results (Apr 18, 2022)
COVID Vaccine doses distributed (per 100k population) (Sep 19, 2023)
COVID Vaccine doses administered (per 100k population) (Sep 19, 2023)
COVID Vaccine doses distributed (Sep 19, 2023)
COVID Vaccine doses administered (Sep 19, 2023)
Likely homosexual households (%)
Likely homosexual households (% change since 2000)
Likely homosexual households - Lesbian couples (%)
Likely homosexual households - Lesbian couples (% change since 2000)
Likely homosexual households - Gay men (%)
Likely homosexual households - Gay men (% change since 2000)
Cost of living index
Median gross rent ($)
Median contract rent ($)
Median monthly housing costs ($)
Median house or condo value ($)
Median house or condo value ($ change since 2000)
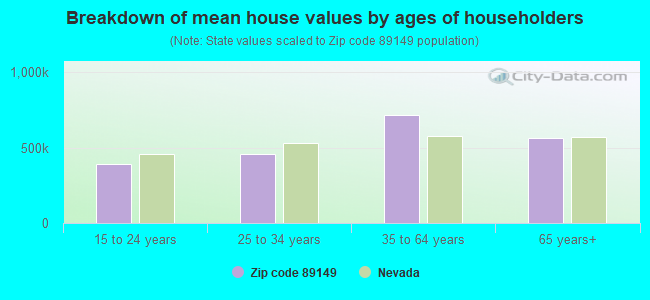
Mean house or condo value by units in structure - 1, detached ($)
Mean house or condo value by units in structure - 1, attached ($)
Mean house or condo value by units in structure - 2 ($)
Mean house or condo value by units in structure by units in structure - 3 or 4 ($)
Mean house or condo value by units in structure - 5 or more ($)
Mean house or condo value by units in structure - Boat, RV, van, etc. ($)
Mean house or condo value by units in structure - Mobile home ($)
Median house or condo value ($) - White
Median house or condo value ($) - Black or African American
Median house or condo value ($) - Asian
Median house or condo value ($) - Hispanic or Latino
Median house or condo value ($) - American Indian and Alaska Native
Median house or condo value ($) - Multirace
Median house or condo value ($) - Other Race
Median resident age
Resident age diversity
Median resident age - Males
Median resident age - Females
Median resident age - White
Median resident age - Black or African American
Median resident age - Asian
Median resident age - Hispanic or Latino
Median resident age - American Indian and Alaska Native
Median resident age - Multirace
Median resident age - Other Race
Median resident age - Males - White
Median resident age - Males - Black or African American
Median resident age - Males - Asian
Median resident age - Males - Hispanic or Latino
Median resident age - Males - American Indian and Alaska Native
Median resident age - Males - Multirace
Median resident age - Males - Other Race
Median resident age - Females - White
Median resident age - Females - Black or African American
Median resident age - Females - Asian
Median resident age - Females - Hispanic or Latino
Median resident age - Females - American Indian and Alaska Native
Median resident age - Females - Multirace
Median resident age - Females - Other Race
Commute - mean travel time to work (minutes)
Travel time to work - Less than 5 minutes (%)
Travel time to work - Less than 5 minutes (% change since 2000)
Travel time to work - 5 to 9 minutes (%)
Travel time to work - 5 to 9 minutes (% change since 2000)
Travel time to work - 10 to 19 minutes (%)
Travel time to work - 10 to 19 minutes (% change since 2000)
Travel time to work - 20 to 29 minutes (%)
Travel time to work - 20 to 29 minutes (% change since 2000)
Travel time to work - 30 to 39 minutes (%)
Travel time to work - 30 to 39 minutes (% change since 2000)
Travel time to work - 40 to 59 minutes (%)
Travel time to work - 40 to 59 minutes (% change since 2000)
Travel time to work - 60 to 89 minutes (%)
Travel time to work - 60 to 89 minutes (% change since 2000)
Travel time to work - 90 or more minutes (%)
Travel time to work - 90 or more minutes (% change since 2000)
Marital status - Never married (%)
Marital status - Now married (%)
Marital status - Separated (%)
Marital status - Widowed (%)
Marital status - Divorced (%)
Median family income ($)
Median family income (% change since 2000)
Median non-family income ($)
Median non-family income (% change since 2000)
Median per capita income ($)
Median per capita income (% change since 2000)
Median family income ($) - White
Median family income ($) - Black or African American
Median family income ($) - Asian
Median family income ($) - Hispanic or Latino
Median family income ($) - American Indian and Alaska Native
Median family income ($) - Multirace
Median family income ($) - Other Race
Median year house/condo built
Median year apartment built
Year house built - Built 2005 or later (%)
Year house built - Built 2000 to 2004 (%)
Year house built - Built 1990 to 1999 (%)
Year house built - Built 1980 to 1989 (%)
Year house built - Built 1970 to 1979 (%)
Year house built - Built 1960 to 1969 (%)
Year house built - Built 1950 to 1959 (%)
Year house built - Built 1940 to 1949 (%)
Year house built - Built 1939 or earlier (%)
Average household size
Household density (households per square mile)
Average household size - White
Average household size - Black or African American
Average household size - Asian
Average household size - Hispanic or Latino
Average household size - American Indian and Alaska Native
Average household size - Multirace
Average household size - Other Race
Occupied housing units (%)
Vacant housing units (%)
Owner occupied housing units (%)
Renter occupied housing units (%)
Vacancy status - For rent (%)
Vacancy status - For sale only (%)
Vacancy status - Rented or sold, not occupied (%)
Vacancy status - For seasonal, recreational, or occasional use (%)
Vacancy status - For migrant workers (%)
Vacancy status - Other vacant (%)
Residents with income below the poverty level (%)
Residents with income below 50% of the poverty level (%)
Children below poverty level (%)
Poor families by family type - Married-couple family (%)
Poor families by family type - Male, no wife present (%)
Poor families by family type - Female, no husband present (%)
Poverty status for native-born residents (%)
Poverty status for foreign-born residents (%)
Poverty among high school graduates not in families (%)
Poverty among people who did not graduate high school not in families (%)
Residents with income below the poverty level (%) - White
Residents with income below the poverty level (%) - Black or African American
Residents with income below the poverty level (%) - Asian
Residents with income below the poverty level (%) - Hispanic or Latino
Residents with income below the poverty level (%) - American Indian and Alaska Native
Residents with income below the poverty level (%) - Multirace
Residents with income below the poverty level (%) - Other Race
Air pollution - Air Quality Index (AQI)
Air pollution - CO
Air pollution - NO2
Air pollution - SO2
Air pollution - Ozone
Air pollution - PM10
Air pollution - PM25
Air pollution - Pb
Crime - Murders per 100,000 population
Crime - Rapes per 100,000 population
Crime - Robberies per 100,000 population
Crime - Assaults per 100,000 population
Crime - Burglaries per 100,000 population
Crime - Thefts per 100,000 population
Crime - Auto thefts per 100,000 population
Crime - Arson per 100,000 population
Crime - City-data.com crime index
Crime - Violent crime index
Crime - Property crime index
Crime - Murders per 100,000 population (5 year average)
Crime - Rapes per 100,000 population (5 year average)
Crime - Robberies per 100,000 population (5 year average)
Crime - Assaults per 100,000 population (5 year average)
Crime - Burglaries per 100,000 population (5 year average)
Crime - Thefts per 100,000 population (5 year average)
Crime - Auto thefts per 100,000 population (5 year average)
Crime - Arson per 100,000 population (5 year average)
Crime - City-data.com crime index (5 year average)
Crime - Violent crime index (5 year average)
Crime - Property crime index (5 year average)
1996 Presidential Elections Results (%) - Democratic Party (Clinton)
1996 Presidential Elections Results (%) - Republican Party (Dole)
1996 Presidential Elections Results (%) - Other
2000 Presidential Elections Results (%) - Democratic Party (Gore)
2000 Presidential Elections Results (%) - Republican Party (Bush)
2000 Presidential Elections Results (%) - Other
2004 Presidential Elections Results (%) - Democratic Party (Kerry)
2004 Presidential Elections Results (%) - Republican Party (Bush)
2004 Presidential Elections Results (%) - Other
2008 Presidential Elections Results (%) - Democratic Party (Obama)
2008 Presidential Elections Results (%) - Republican Party (McCain)
2008 Presidential Elections Results (%) - Other
2012 Presidential Elections Results (%) - Democratic Party (Obama)
2012 Presidential Elections Results (%) - Republican Party (Romney)
2012 Presidential Elections Results (%) - Other
2016 Presidential Elections Results (%) - Democratic Party (Clinton)
2016 Presidential Elections Results (%) - Republican Party (Trump)
2016 Presidential Elections Results (%) - Other
2020 Presidential Elections Results (%) - Democratic Party (Biden)
2020 Presidential Elections Results (%) - Republican Party (Trump)
2020 Presidential Elections Results (%) - Other
Ancestries Reported - Arab (%)
Ancestries Reported - Czech (%)
Ancestries Reported - Danish (%)
Ancestries Reported - Dutch (%)
Ancestries Reported - English (%)
Ancestries Reported - French (%)
Ancestries Reported - French Canadian (%)
Ancestries Reported - German (%)
Ancestries Reported - Greek (%)
Ancestries Reported - Hungarian (%)
Ancestries Reported - Irish (%)
Ancestries Reported - Italian (%)
Ancestries Reported - Lithuanian (%)
Ancestries Reported - Norwegian (%)
Ancestries Reported - Polish (%)
Ancestries Reported - Portuguese (%)
Ancestries Reported - Russian (%)
Ancestries Reported - Scotch-Irish (%)
Ancestries Reported - Scottish (%)
Ancestries Reported - Slovak (%)
Ancestries Reported - Subsaharan African (%)
Ancestries Reported - Swedish (%)
Ancestries Reported - Swiss (%)
Ancestries Reported - Ukrainian (%)
Ancestries Reported - United States (%)
Ancestries Reported - Welsh (%)
Ancestries Reported - West Indian (%)
Ancestries Reported - Other (%)
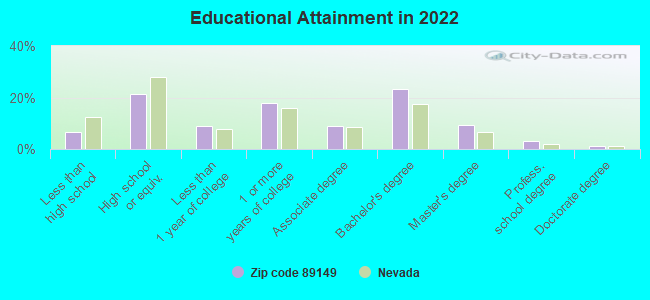
Educational Attainment - No schooling completed (%)
Educational Attainment - Less than high school (%)
Educational Attainment - High school or equivalent (%)
Educational Attainment - Less than 1 year of college (%)
Educational Attainment - 1 or more years of college (%)
Educational Attainment - Associate degree (%)
Educational Attainment - Bachelor's degree (%)
Educational Attainment - Master's degree (%)
Educational Attainment - Professional school degree (%)
Educational Attainment - Doctorate degree (%)
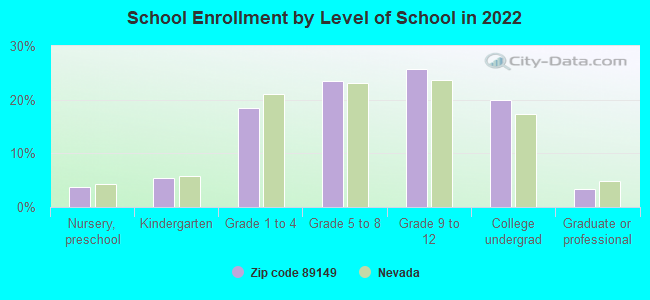
School Enrollment - Nursery, preschool (%)
School Enrollment - Kindergarten (%)
School Enrollment - Grade 1 to 4 (%)
School Enrollment - Grade 5 to 8 (%)
School Enrollment - Grade 9 to 12 (%)
School Enrollment - College undergrad (%)
School Enrollment - Graduate or professional (%)
School Enrollment - Not enrolled in school (%)
School enrollment - Public schools (%)
School enrollment - Private schools (%)
School enrollment - Not enrolled (%)
Median number of rooms in houses and condos
Median number of rooms in apartments
Housing units lacking complete plumbing facilities (%)
Housing units lacking complete kitchen facilities (%)
Density of houses
Urban houses (%)
Rural houses (%)
Households with people 60 years and over (%)
Households with people 65 years and over (%)
Households with people 75 years and over (%)
Households with one or more nonrelatives (%)
Households with no nonrelatives (%)
Population in households (%)
Family households (%)
Nonfamily households (%)
Population in families (%)
Family households with own children (%)
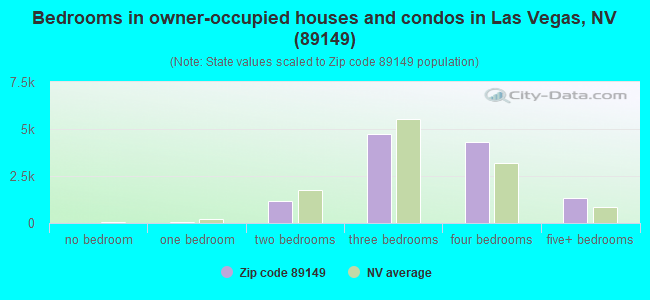
Median number of bedrooms in owner occupied houses
Mean number of bedrooms in owner occupied houses
Median number of bedrooms in renter occupied houses
Mean number of bedrooms in renter occupied houses
Median number of vehichles in owner occupied houses
Mean number of vehichles in owner occupied houses
Median number of vehichles in renter occupied houses
Mean number of vehichles in renter occupied houses
Mortgage status - with mortgage (%)
Mortgage status - with second mortgage (%)
Mortgage status - with home equity loan (%)
Mortgage status - with both second mortgage and home equity loan (%)
Mortgage status - without a mortgage (%)
Average family size
Average family size - White
Average family size - Black or African American
Average family size - Asian
Average family size - Hispanic or Latino
Average family size - American Indian and Alaska Native
Average family size - Multirace
Average family size - Other Race
Geographical mobility - Same house 1 year ago (%)
Geographical mobility - Moved within same county (%)
Geographical mobility - Moved from different county within same state (%)
Geographical mobility - Moved from different state (%)
Geographical mobility - Moved from abroad (%)
Place of birth - Born in state of residence (%)
Place of birth - Born in other state (%)
Place of birth - Native, outside of US (%)
Place of birth - Foreign born (%)
Housing units in structures - 1, detached (%)
Housing units in structures - 1, attached (%)
Housing units in structures - 2 (%)
Housing units in structures - 3 or 4 (%)
Housing units in structures - 5 to 9 (%)
Housing units in structures - 10 to 19 (%)
Housing units in structures - 20 to 49 (%)
Housing units in structures - 50 or more (%)
Housing units in structures - Mobile home (%)
Housing units in structures - Boat, RV, van, etc. (%)
House/condo owner moved in on average (years ago)
Renter moved in on average (years ago)
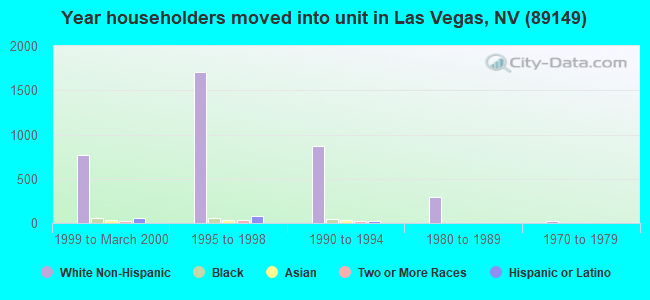
Year householder moved into unit - Moved in 1999 to March 2000 (%)
Year householder moved into unit - Moved in 1995 to 1998 (%)
Year householder moved into unit - Moved in 1990 to 1994 (%)
Year householder moved into unit - Moved in 1980 to 1989 (%)
Year householder moved into unit - Moved in 1970 to 1979 (%)
Year householder moved into unit - Moved in 1969 or earlier (%)
Means of transportation to work - Drove car alone (%)
Means of transportation to work - Carpooled (%)
Means of transportation to work - Public transportation (%)
Means of transportation to work - Bus or trolley bus (%)
Means of transportation to work - Streetcar or trolley car (%)
Means of transportation to work - Subway or elevated (%)
Means of transportation to work - Railroad (%)
Means of transportation to work - Ferryboat (%)
Means of transportation to work - Taxicab (%)
Means of transportation to work - Motorcycle (%)
Means of transportation to work - Bicycle (%)
Means of transportation to work - Walked (%)
Means of transportation to work - Other means (%)
Working at home (%)
Industry diversity
Most Common Industries - Agriculture, forestry, fishing and hunting, and mining (%)
Most Common Industries - Agriculture, forestry, fishing and hunting (%)
Most Common Industries - Mining, quarrying, and oil and gas extraction (%)
Most Common Industries - Construction (%)
Most Common Industries - Manufacturing (%)
Most Common Industries - Wholesale trade (%)
Most Common Industries - Retail trade (%)
Most Common Industries - Transportation and warehousing, and utilities (%)
Most Common Industries - Transportation and warehousing (%)
Most Common Industries - Utilities (%)
Most Common Industries - Information (%)
Most Common Industries - Finance and insurance, and real estate and rental and leasing (%)
Most Common Industries - Finance and insurance (%)
Most Common Industries - Real estate and rental and leasing (%)
Most Common Industries - Professional, scientific, and management, and administrative and waste management services (%)
Most Common Industries - Professional, scientific, and technical services (%)
Most Common Industries - Management of companies and enterprises (%)
Most Common Industries - Administrative and support and waste management services (%)
Most Common Industries - Educational services, and health care and social assistance (%)
Most Common Industries - Educational services (%)
Most Common Industries - Health care and social assistance (%)
Most Common Industries - Arts, entertainment, and recreation, and accommodation and food services (%)
Most Common Industries - Arts, entertainment, and recreation (%)
Most Common Industries - Accommodation and food services (%)
Most Common Industries - Other services, except public administration (%)
Most Common Industries - Public administration (%)
Occupation diversity
Most Common Occupations - Management, business, science, and arts occupations (%)
Most Common Occupations - Management, business, and financial occupations (%)
Most Common Occupations - Management occupations (%)
Most Common Occupations - Business and financial operations occupations (%)
Most Common Occupations - Computer, engineering, and science occupations (%)
Most Common Occupations - Computer and mathematical occupations (%)
Most Common Occupations - Architecture and engineering occupations (%)
Most Common Occupations - Life, physical, and social science occupations (%)
Most Common Occupations - Education, legal, community service, arts, and media occupations (%)
Most Common Occupations - Community and social service occupations (%)
Most Common Occupations - Legal occupations (%)
Most Common Occupations - Education, training, and library occupations (%)
Most Common Occupations - Arts, design, entertainment, sports, and media occupations (%)
Most Common Occupations - Healthcare practitioners and technical occupations (%)
Most Common Occupations - Health diagnosing and treating practitioners and other technical occupations (%)
Most Common Occupations - Health technologists and technicians (%)
Most Common Occupations - Service occupations (%)
Most Common Occupations - Healthcare support occupations (%)
Most Common Occupations - Protective service occupations (%)
Most Common Occupations - Fire fighting and prevention, and other protective service workers including supervisors (%)
Most Common Occupations - Law enforcement workers including supervisors (%)
Most Common Occupations - Food preparation and serving related occupations (%)
Most Common Occupations - Building and grounds cleaning and maintenance occupations (%)
Most Common Occupations - Personal care and service occupations (%)
Most Common Occupations - Sales and office occupations (%)
Most Common Occupations - Sales and related occupations (%)
Most Common Occupations - Office and administrative support occupations (%)
Most Common Occupations - Natural resources, construction, and maintenance occupations (%)
Most Common Occupations - Farming, fishing, and forestry occupations (%)
Most Common Occupations - Construction and extraction occupations (%)
Most Common Occupations - Installation, maintenance, and repair occupations (%)
Most Common Occupations - Production, transportation, and material moving occupations (%)
Most Common Occupations - Production occupations (%)
Most Common Occupations - Transportation occupations (%)
Most Common Occupations - Material moving occupations (%)
People in Group quarters - Institutionalized population (%)
People in Group quarters - Correctional institutions (%)
People in Group quarters - Federal prisons and detention centers (%)
People in Group quarters - Halfway houses (%)
People in Group quarters - Local jails and other confinement facilities (including police lockups) (%)
People in Group quarters - Military disciplinary barracks (%)
People in Group quarters - State prisons (%)
People in Group quarters - Other types of correctional institutions (%)
People in Group quarters - Nursing homes (%)
People in Group quarters - Hospitals/wards, hospices, and schools for the handicapped (%)
People in Group quarters - Hospitals/wards and hospices for chronically ill (%)
People in Group quarters - Hospices or homes for chronically ill (%)
People in Group quarters - Military hospitals or wards for chronically ill (%)
People in Group quarters - Other hospitals or wards for chronically ill (%)
People in Group quarters - Hospitals or wards for drug/alcohol abuse (%)
People in Group quarters - Mental (Psychiatric) hospitals or wards (%)
People in Group quarters - Schools, hospitals, or wards for the mentally retarded (%)
People in Group quarters - Schools, hospitals, or wards for the physically handicapped (%)
People in Group quarters - Institutions for the deaf (%)
People in Group quarters - Institutions for the blind (%)
People in Group quarters - Orthopedic wards and institutions for the physically handicapped (%)
People in Group quarters - Wards in general hospitals for patients who have no usual home elsewhere (%)
People in Group quarters - Wards in military hospitals for patients who have no usual home elsewhere (%)
People in Group quarters - Juvenile institutions (%)
People in Group quarters - Long-term care (%)
People in Group quarters - Homes for abused, dependent, and neglected children (%)
People in Group quarters - Residential treatment centers for emotionally disturbed children (%)
People in Group quarters - Training schools for juvenile delinquents (%)
People in Group quarters - Short-term care, detention or diagnostic centers for delinquent children (%)
People in Group quarters - Type of juvenile institution unknown (%)
People in Group quarters - Noninstitutionalized population (%)
People in Group quarters - College dormitories (includes college quarters off campus) (%)
People in Group quarters - Military quarters (%)
People in Group quarters - On base (%)
People in Group quarters - Barracks, unaccompanied personnel housing (UPH), (Enlisted/Officer), ;and similar group living quarters for military personnel (%)
People in Group quarters - Transient quarters for temporary residents (%)
People in Group quarters - Military ships (%)
People in Group quarters - Group homes (%)
People in Group quarters - Homes or halfway houses for drug/alcohol abuse (%)
People in Group quarters - Homes for the mentally ill (%)
People in Group quarters - Homes for the mentally retarded (%)
People in Group quarters - Homes for the physically handicapped (%)
People in Group quarters - Other group homes (%)
People in Group quarters - Religious group quarters (%)
People in Group quarters - Dormitories (%)
People in Group quarters - Agriculture workers' dormitories on farms (%)
People in Group quarters - Job Corps and vocational training facilities (%)
People in Group quarters - Other workers' dormitories (%)
People in Group quarters - Crews of maritime vessels (%)
People in Group quarters - Other nonhousehold living situations (%)
People in Group quarters - Other noninstitutional group quarters (%)
Residents speaking English at home (%)
Residents speaking English at home - Born in the United States (%)
Residents speaking English at home - Native, born elsewhere (%)
Residents speaking English at home - Foreign born (%)
Residents speaking Spanish at home (%)
Residents speaking Spanish at home - Born in the United States (%)
Residents speaking Spanish at home - Native, born elsewhere (%)
Residents speaking Spanish at home - Foreign born (%)
Residents speaking other language at home (%)
Residents speaking other language at home - Born in the United States (%)
Residents speaking other language at home - Native, born elsewhere (%)
Residents speaking other language at home - Foreign born (%)
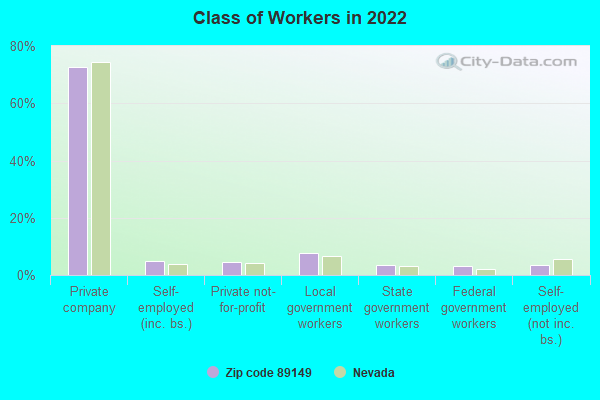
Class of Workers - Employee of private company (%)
Class of Workers - Self-employed in own incorporated business (%)
Class of Workers - Private not-for-profit wage and salary workers (%)
Class of Workers - Local government workers (%)
Class of Workers - State government workers (%)
Class of Workers - Federal government workers (%)
Class of Workers - Self-employed workers in own not incorporated business and Unpaid family workers (%)
House heating fuel used in houses and condos - Utility gas (%)
House heating fuel used in houses and condos - Bottled, tank, or LP gas (%)
House heating fuel used in houses and condos - Electricity (%)
House heating fuel used in houses and condos - Fuel oil, kerosene, etc. (%)
House heating fuel used in houses and condos - Coal or coke (%)
House heating fuel used in houses and condos - Wood (%)
House heating fuel used in houses and condos - Solar energy (%)
House heating fuel used in houses and condos - Other fuel (%)
House heating fuel used in houses and condos - No fuel used (%)
House heating fuel used in apartments - Utility gas (%)
House heating fuel used in apartments - Bottled, tank, or LP gas (%)
House heating fuel used in apartments - Electricity (%)
House heating fuel used in apartments - Fuel oil, kerosene, etc. (%)
House heating fuel used in apartments - Coal or coke (%)
House heating fuel used in apartments - Wood (%)
House heating fuel used in apartments - Solar energy (%)
House heating fuel used in apartments - Other fuel (%)
House heating fuel used in apartments - No fuel used (%)
Armed forces status - In Armed Forces (%)
Armed forces status - Civilian (%)
Armed forces status - Civilian - Veteran (%)
Armed forces status - Civilian - Nonveteran (%)
Fatal accidents locations in years 2005-2021
Fatal accidents locations in 2005
Fatal accidents locations in 2006
Fatal accidents locations in 2007
Fatal accidents locations in 2008
Fatal accidents locations in 2009
Fatal accidents locations in 2010
Fatal accidents locations in 2011
Fatal accidents locations in 2012
Fatal accidents locations in 2013
Fatal accidents locations in 2014
Fatal accidents locations in 2015
Fatal accidents locations in 2016
Fatal accidents locations in 2017
Fatal accidents locations in 2018
Fatal accidents locations in 2019
Fatal accidents locations in 2020
Fatal accidents locations in 2021
Alcohol use - People drinking some alcohol every month (%)
Alcohol use - People not drinking at all (%)
Alcohol use - Average days/month drinking alcohol
Alcohol use - Average drinks/week
Alcohol use - Average days/year people drink much
Audiometry - Average condition of hearing (%)
Audiometry - People that can hear a whisper from across a quiet room (%)
Audiometry - People that can hear normal voice from across a quiet room (%)
Audiometry - Ears ringing, roaring, buzzing (%)
Audiometry - Had a job exposure to loud noise (%)
Audiometry - Had off-work exposure to loud noise (%)
Blood Pressure & Cholesterol - Has high blood pressure (%)
Blood Pressure & Cholesterol - Checking blood pressure at home (%)
Blood Pressure & Cholesterol - Frequently checking blood cholesterol (%)
Blood Pressure & Cholesterol - Has high cholesterol level (%)
Consumer Behavior - Money monthly spent on food at supermarket/grocery store
Consumer Behavior - Money monthly spent on food at other stores
Consumer Behavior - Money monthly spent on eating out
Consumer Behavior - Money monthly spent on carryout/delivered foods
Consumer Behavior - Income spent on food at supermarket/grocery store (%)
Consumer Behavior - Income spent on food at other stores (%)
Consumer Behavior - Income spent on eating out (%)
Consumer Behavior - Income spent on carryout/delivered foods (%)
Current Health Status - General health condition (%)
Current Health Status - Blood donors (%)
Current Health Status - Has blood ever tested for HIV virus (%)
Current Health Status - Left-handed people (%)
Dermatology - People using sunscreen (%)
Diabetes - Diabetics (%)
Diabetes - Had a blood test for high blood sugar (%)
Diabetes - People taking insulin (%)
Diet Behavior & Nutrition - Diet health (%)
Diet Behavior & Nutrition - Milk product consumption (# of products/month)
Diet Behavior & Nutrition - Meals not home prepared (#/week)
Diet Behavior & Nutrition - Meals from fast food or pizza place (#/week)
Diet Behavior & Nutrition - Ready-to-eat foods (#/month)
Diet Behavior & Nutrition - Frozen meals/pizza (#/month)
Drug Use - People that ever used marijuana or hashish (%)
Drug Use - Ever used hard drugs (%)
Drug Use - Ever used any form of cocaine (%)
Drug Use - Ever used heroin (%)
Drug Use - Ever used methamphetamine (%)
Health Insurance - People covered by health insurance (%)
Kidney Conditions-Urology - Avg. # of times urinating at night
Medical Conditions - People with asthma (%)
Medical Conditions - People with anemia (%)
Medical Conditions - People with psoriasis (%)
Medical Conditions - People with overweight (%)
Medical Conditions - Elderly people having difficulties in thinking or remembering (%)
Medical Conditions - People who ever received blood transfusion (%)
Medical Conditions - People having trouble seeing even with glass/contacts (%)
Medical Conditions - People with arthritis (%)
Medical Conditions - People with gout (%)
Medical Conditions - People with congestive heart failure (%)
Medical Conditions - People with coronary heart disease (%)
Medical Conditions - People with angina pectoris (%)
Medical Conditions - People who ever had heart attack (%)
Medical Conditions - People who ever had stroke (%)
Medical Conditions - People with emphysema (%)
Medical Conditions - People with thyroid problem (%)
Medical Conditions - People with chronic bronchitis (%)
Medical Conditions - People with any liver condition (%)
Medical Conditions - People who ever had cancer or malignancy (%)
Mental Health - People who have little interest in doing things (%)
Mental Health - People feeling down, depressed, or hopeless (%)
Mental Health - People who have trouble sleeping or sleeping too much (%)
Mental Health - People feeling tired or having little energy (%)
Mental Health - People with poor appetite or overeating (%)
Mental Health - People feeling bad about themself (%)
Mental Health - People who have trouble concentrating on things (%)
Mental Health - People moving or speaking slowly or too fast (%)
Mental Health - People having thoughts they would be better off dead (%)
Oral Health - Average years since last visit a dentist
Oral Health - People embarrassed because of mouth (%)
Oral Health - People with gum disease (%)
Oral Health - General health of teeth and gums (%)
Oral Health - Average days a week using dental floss/device
Oral Health - Average days a week using mouthwash for dental problem
Oral Health - Average number of teeth
Pesticide Use - Households using pesticides to control insects (%)
Pesticide Use - Households using pesticides to kill weeds (%)
Physical Activity - People doing vigorous-intensity work activities (%)
Physical Activity - People doing moderate-intensity work activities (%)
Physical Activity - People walking or bicycling (%)
Physical Activity - People doing vigorous-intensity recreational activities (%)
Physical Activity - People doing moderate-intensity recreational activities (%)
Physical Activity - Average hours a day doing sedentary activities
Physical Activity - Average hours a day watching TV or videos
Physical Activity - Average hours a day using computer
Physical Functioning - People having limitations keeping them from working (%)
Physical Functioning - People limited in amount of work they can do (%)
Physical Functioning - People that need special equipment to walk (%)
Physical Functioning - People experiencing confusion/memory problems (%)
Physical Functioning - People requiring special healthcare equipment (%)
Prescription Medications - Average number of prescription medicines taking
Preventive Aspirin Use - Adults 40+ taking low-dose aspirin (%)
Reproductive Health - Vaginal deliveries (%)
Reproductive Health - Cesarean deliveries (%)
Reproductive Health - Deliveries resulted in a live birth (%)
Reproductive Health - Pregnancies resulted in a delivery (%)
Reproductive Health - Women breastfeeding newborns (%)
Reproductive Health - Women that had a hysterectomy (%)
Reproductive Health - Women that had both ovaries removed (%)
Reproductive Health - Women that have ever taken birth control pills (%)
Reproductive Health - Women taking birth control pills (%)
Reproductive Health - Women that have ever used Depo-Provera or injectables (%)
Reproductive Health - Women that have ever used female hormones (%)
Sexual Behavior - People 18+ that ever had sex (vaginal, anal, or oral) (%)
Sexual Behavior - Males 18+ that ever had vaginal sex with a woman (%)
Sexual Behavior - Males 18+ that ever performed oral sex on a woman (%)
Sexual Behavior - Males 18+ that ever had anal sex with a woman (%)
Sexual Behavior - Males 18+ that ever had any sex with a man (%)
Sexual Behavior - Females 18+ that ever had vaginal sex with a man (%)
Sexual Behavior - Females 18+ that ever performed oral sex on a man (%)
Sexual Behavior - Females 18+ that ever had anal sex with a man (%)
Sexual Behavior - Females 18+ that ever had any kind of sex with a woman (%)
Sexual Behavior - Average age people first had sex
Sexual Behavior - Average number of female sex partners in lifetime (males 18+)
Sexual Behavior - Average number of female vaginal sex partners in lifetime (males 18+)
Sexual Behavior - Average age people first performed oral sex on a woman (18+)
Sexual Behavior - Average number of woman performed oral sex on in lifetime (18+)
Sexual Behavior - Average number of male sex partners in lifetime (males 18+)
Sexual Behavior - Average number of male anal sex partners in lifetime (males 18+)
Sexual Behavior - Average age people first performed oral sex on a man (18+)
Sexual Behavior - Average number of male oral sex partners in lifetime (18+)
Sexual Behavior - People using protection when performing oral sex (%)
Sexual Behavior - Average number of times people have vaginal or anal sex a year
Sexual Behavior - People having sex without condom (%)
Sexual Behavior - Average number of male sex partners in lifetime (females 18+)
Sexual Behavior - Average number of male vaginal sex partners in lifetime (females 18+)
Sexual Behavior - Average number of female sex partners in lifetime (females 18+)
Sexual Behavior - Circumcised males 18+ (%)
Sleep Disorders - Average hours sleeping at night
Sleep Disorders - People that has trouble sleeping (%)
Smoking-Cigarette Use - People smoking cigarettes (%)
Taste & Smell - People 40+ having problems with smell (%)
Taste & Smell - People 40+ having problems with taste (%)
Taste & Smell - People 40+ that ever had wisdom teeth removed (%)
Taste & Smell - People 40+ that ever had tonsils teeth removed (%)
Taste & Smell - People 40+ that ever had a loss of consciousness because of a head injury (%)
Taste & Smell - People 40+ that ever had a broken nose or other serious injury to face or skull (%)
Taste & Smell - People 40+ that ever had two or more sinus infections (%)
Weight - Average height (inches)
Weight - Average weight (pounds)
Weight - Average BMI
Weight - People that are obese (%)
Weight - People that ever were obese (%)
Weight - People trying to lose weight (%)
Urban population: 43,649
Rural population: 1,311
Estimated median house/condo value in 2022: $535,990
89149:
$535,990Nevada:
$434,700
According to our research of Nevada and other state lists, there were 51 registered sex offenders living in 89149 zip code as of April 27, 2024 . The ratio of all residents to sex offenders in zip code 89149 is 698 to 1.The ratio of registered sex offenders to all residents in this zip code is lower than the state average.
Median resident age: This zip code:
38.2 yearsNevada median age:
39.0 years
Average household size: This zip code:
2.7 peopleNevada:
2.6 people
Averages for the 2020 tax year for zip code 89149, filed in 2021:
Average Adjusted Gross Income (AGI) in 2020: $90,797 (Individual Income Tax Returns) Here:
$90,797State:
$78,964
Salary/wage: $68,202 (reported on 82.2% of returns )Here:
$68,202State:
$54,472
(% of AGI for various income ranges: 1131.3% for AGIs below $25k , 3523.0% for AGIs $25k-50k , 6443.3% for AGIs $50k-75k , 9080.7% for AGIs $75k-100k , 16909.9% for AGIs $100k-200k , 61915.5% for AGIs over 200k ) Taxable interest for individuals: $2,145 (reported on 29.3% of returns )This zip code:
$2,145Nevada:
$3,521
(% of AGI for various income ranges: 16.1% for AGIs below $25k , 17.0% for AGIs $25k-50k , 33.6% for AGIs $50k-75k , 53.5% for AGIs $75k-100k , 118.4% for AGIs $100k-200k , 1426.8% for AGIs over 200k ) Ordinary dividends: $6,145 (reported on 18.3% of returns )(% of AGI for various income ranges: 21.6% for AGIs below $25k , 28.1% for AGIs $25k-50k , 76.4% for AGIs $50k-75k , 111.0% for AGIs $75k-100k , 275.8% for AGIs $100k-200k , 2237.7% for AGIs over 200k ) Net capital gain/loss in AGI: +$30,568 (reported on 19.8% of returns )Here:
+$30,568State:
+$63,025
(% of AGI for various income ranges: 12.6% for AGIs below $25k , 19.5% for AGIs $25k-50k , 83.8% for AGIs $50k-75k , 176.3% for AGIs $75k-100k , 589.5% for AGIs $100k-200k , 20080.2% for AGIs over 200k ) Profit/loss from business: +$12,761 (reported on 16.7% of returns )Here:
+$12,761State:
+$11,500
(% of AGI for various income ranges: 80.2% for AGIs below $25k , 90.3% for AGIs $25k-50k , 143.6% for AGIs $50k-75k , 245.6% for AGIs $75k-100k , 444.4% for AGIs $100k-200k , 3919.2% for AGIs over 200k ) Taxable individual retirement arrangement distribution: $23,121 (reported on 7.5% of returns )89149:
$23,121Nevada:
$23,628
(% of AGI for various income ranges: 36.0% for AGIs below $25k , 69.5% for AGIs $25k-50k , 137.5% for AGIs $50k-75k , 253.2% for AGIs $75k-100k , 612.1% for AGIs $100k-200k , 2141.5% for AGIs over 200k ) Self-employed (Keogh) retirement plans: $25,643 (reported on 0.3% of returns )89149:
$25,643Nevada:
$26,634
(% of AGI for various income ranges: 25.9% for AGIs $100k-200k , 231.5% for AGIs over 200k ) Total itemized deductions: $42,866 (reported on 14.3% of returns )Here:
$42,866State:
$44,173
(% of AGI for various income ranges: 71.0% for AGIs below $25k , 177.3% for AGIs $25k-50k , 415.8% for AGIs $50k-75k , 713.9% for AGIs $75k-100k , 1520.6% for AGIs $100k-200k , 11956.2% for AGIs over 200k ) Charity contributions: $8,973 (reported on 11.8% of returns )(% of AGI for various income ranges: 5.5% for AGIs below $25k , 23.2% for AGIs $25k-50k , 69.1% for AGIs $50k-75k , 121.3% for AGIs $75k-100k , 306.3% for AGIs $100k-200k , 2011.9% for AGIs over 200k ) Taxes paid: $6,646 (reported on 14.1% of returns )(% of AGI for various income ranges: 11.9% for AGIs below $25k , 32.7% for AGIs $25k-50k , 83.0% for AGIs $50k-75k , 140.9% for AGIs $75k-100k , 322.8% for AGIs $100k-200k , 1250.0% for AGIs over 200k ) Earned income credit: $2,081 (reported on 11.9% of returns )(% of AGI for various income ranges: 76.0% for AGIs below $25k , 55.8% for AGIs $25k-50k , 0.8% for AGIs $50k-75k ) Percentage of individuals using paid preparers for their 2020 taxes: 93.6%(% for various income ranges: 93.1% for AGIs below $25k , 94.6% for AGIs $25k-50k , 93.4% for AGIs $50k-75k , 92.8% for AGIs $75k-100k , 92.7% for AGIs $100k-200k , 95.5% for AGIs over 200k )
Averages for the 2012 tax year for zip code 89149, filed in 2013:
Average Adjusted Gross Income (AGI) in 2012: $70,916 (Individual Income Tax Returns) Here:
$70,916State:
$61,164
Salary/wage: $57,349 (reported on 85.5% of returns )Here:
$57,349State:
$45,924
(% of AGI for various income ranges: 78.0% for AGIs below $25k , 84.7% for AGIs $25k-50k , 81.4% for AGIs $50k-75k , 78.1% for AGIs $75k-100k , 76.0% for AGIs $100k-200k , 40.1% for AGIs over 200k ) Taxable interest for individuals: $1,930 (reported on 29.3% of returns )This zip code:
$1,930Nevada:
$3,137
(% of AGI for various income ranges: 1.1% for AGIs below $25k , 0.4% for AGIs $25k-50k , 0.4% for AGIs $50k-75k , 0.4% for AGIs $75k-100k , 0.6% for AGIs $100k-200k , 1.6% for AGIs over 200k ) Ordinary dividends: $5,178 (reported on 16.7% of returns )(% of AGI for various income ranges: 2.9% for AGIs below $25k , 0.8% for AGIs $25k-50k , 0.7% for AGIs $50k-75k , 0.9% for AGIs $75k-100k , 1.2% for AGIs $100k-200k , 1.6% for AGIs over 200k ) Net capital gain/loss in AGI: +$24,163 (reported on 15.2% of returns )Here:
+$24,163State:
+$33,127
(% of AGI for various income ranges: 0.2% for AGIs $50k-75k , 0.9% for AGIs $75k-100k , 0.9% for AGIs $100k-200k , 18.9% for AGIs over 200k ) Profit/loss from business: +$10,619 (reported on 14.4% of returns )Here:
+$10,619State:
+$12,567
(% of AGI for various income ranges: 6.3% for AGIs below $25k , 2.0% for AGIs $25k-50k , 1.8% for AGIs $50k-75k , 1.5% for AGIs $75k-100k , 2.3% for AGIs $100k-200k , 1.7% for AGIs over 200k ) Taxable individual retirement arrangement distribution: $19,425 (reported on 7.9% of returns )89149:
$19,425Nevada:
$20,808
(% of AGI for various income ranges: 2.1% for AGIs below $25k , 1.6% for AGIs $25k-50k , 1.9% for AGIs $50k-75k , 2.9% for AGIs $75k-100k , 3.0% for AGIs $100k-200k , 1.4% for AGIs over 200k ) Self-employment retirement plans: $17,320 (reported on 0.3% of returns )89149:
$17,320Nevada:
$22,197
Total itemized deductions: $24,612 (21% of AGI, reported on 38.4% of returns )Here:
$24,612State:
$26,148
Here:
20.8% of AGIState:
20.0% of AGI
(% of AGI for various income ranges: 10.7% for AGIs below $25k , 12.0% for AGIs $25k-50k , 13.5% for AGIs $50k-75k , 15.5% for AGIs $75k-100k , 14.6% for AGIs $100k-200k , 12.0% for AGIs over 200k ) Charity contributions: $3,848 (reported on 32.1% of returns )(% of AGI for various income ranges: 0.8% for AGIs below $25k , 1.2% for AGIs $25k-50k , 1.6% for AGIs $50k-75k , 2.0% for AGIs $75k-100k , 2.2% for AGIs $100k-200k , 1.7% for AGIs over 200k ) Taxes paid: $4,809 (reported on 37.9% of returns )(% of AGI for various income ranges: 2.1% for AGIs below $25k , 2.3% for AGIs $25k-50k , 2.6% for AGIs $50k-75k , 2.9% for AGIs $75k-100k , 3.1% for AGIs $100k-200k , 2.1% for AGIs over 200k ) Earned income credit: $2,108 (reported on 13.0% of returns )(% of AGI for various income ranges: 5.1% for AGIs below $25k , 0.9% for AGIs $25k-50k ) Percentage of individuals using paid preparers for their 2012 taxes: 51.3%(% for various income ranges: 46.3% for AGIs below $25k , 45.6% for AGIs $25k-50k , 50.8% for AGIs $50k-75k , 57.4% for AGIs $75k-100k , 60.4% for AGIs $100k-200k , 78.2% for AGIs over 200k )
Averages for the 2004 tax year for zip code 89149, filed in 2005:
Average Adjusted Gross Income (AGI) in 2004: $79,635 (Individual Income Tax Returns) Here:
$79,635State:
$58,367
Salary/wage: $60,280 (reported on 84.9% of returns )Here:
$60,280State:
$42,695
(% of AGI for various income ranges: 78.7% for AGIs $10k-25k , 81.0% for AGIs $25k-50k , 77.1% for AGIs $50k-75k , 79.1% for AGIs $75k-100k , 53.4% for AGIs over 100k ) Taxable interest for individuals: $3,678 (reported on 50.6% of returns )This zip code:
$3,678Nevada:
$3,867
(% of AGI for various income ranges: 2.9% for AGIs $10k-25k , 1.1% for AGIs $25k-50k , 1.6% for AGIs $50k-75k , 1.1% for AGIs $75k-100k , 2.7% for AGIs over 100k ) Taxable dividends: $3,042 (reported on 25.1% of returns )(% of AGI for various income ranges: 1.6% for AGIs $10k-25k , 0.8% for AGIs $25k-50k , 1.2% for AGIs $50k-75k , 0.8% for AGIs $75k-100k , 0.9% for AGIs over 100k ) Net capital gain/loss: +$33,948 (reported on 25.4% of returns )Here:
+$33,948State:
+$50,644
(% of AGI for various income ranges: -0.5% for AGIs $10k-25k , 0.7% for AGIs $25k-50k , 1.8% for AGIs $50k-75k , 2.2% for AGIs $75k-100k , 16.6% for AGIs over 100k ) Profit/loss from business: +$17,072 (reported on 18.6% of returns )Here:
+$17,072State:
+$13,618
(% of AGI for various income ranges: 5.2% for AGIs $10k-25k , 4.0% for AGIs $25k-50k , 3.5% for AGIs $50k-75k , 3.3% for AGIs $75k-100k , 4.1% for AGIs over 100k ) IRA payment deduction: $3,347 (reported on 3.0% of returns )89149:
$3,347Nevada:
$3,054
(% of AGI for various income ranges: 0.1% for AGIs $10k-25k , 0.2% for AGIs $25k-50k , 0.2% for AGIs $50k-75k , 0.2% for AGIs $75k-100k , 0.1% for AGIs over 100k ) Self-employed pension: $15,281 (reported on 1.1% of returns )Here:
$15,281Nevada:
$16,706
(% of AGI for various income ranges: 0.1% for AGIs $25k-50k , 0.2% for AGIs $50k-75k , 0.1% for AGIs $75k-100k , 0.3% for AGIs over 100k ) Total itemized deductions: $27,492 (24% of AGI, reported on 54.9% of returns )Here:
$27,492State:
$22,990
Here:
23.8% of AGIState:
21.8% of AGI
(% of AGI for various income ranges: 18.7% for AGIs $10k-25k , 21.1% for AGIs $25k-50k , 24.0% for AGIs $50k-75k , 22.9% for AGIs $75k-100k , 16.4% for AGIs over 100k ) Charity contributions deductions: $4,020 (3% of AGI, reported on 49.6% of returns )Here:
3.4% of AGIState:
3.1% of AGI
(% of AGI for various income ranges: 1.5% for AGIs $10k-25k , 2.0% for AGIs $25k-50k , 2.6% for AGIs $50k-75k , 2.7% for AGIs $75k-100k , 2.5% for AGIs over 100k ) Total tax: $14,085 (reported on 83.6% of returns )89149:
$14,085State:
$10,585
(% of AGI for various income ranges: 4.6% for AGIs $10k-25k , 7.1% for AGIs $25k-50k , 8.9% for AGIs $50k-75k , 10.0% for AGIs $75k-100k , 18.6% for AGIs over 100k ) Earned income credit: $1,545 (reported on 7.1% of returns )Percentage of individuals using paid preparers for their 2004 taxes: 60.8%(% for various income ranges: 49.3% for AGIs below $10k , 55.6% for AGIs $10k-25k , 56.3% for AGIs $25k-50k , 63.7% for AGIs $50k-75k , 65.2% for AGIs $75k-100k , 71.7% for AGIs over 100k )
Estimated median household income in 2022: This zip code:
$97,379Nevada:
$72,333
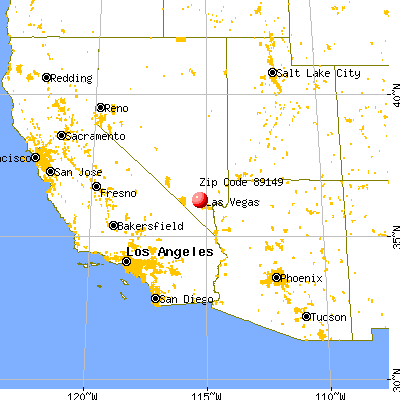
Nearest zip codes: 89129 ,
89143 ,
89131 ,
89130 ,
89134 ,
89128 .
Las Vegas Zip Code Map
Percentage of family households: This zip code:
51.7%Nevada:
45.2%
Percentage of households with unmarried partners: This zip code:
6.8%Nevada:
44.2%
Likely homosexual households (counted as self-reported same-sex unmarried-partner households)
Lesbian couples: 0.5% of all households Gay men: 0.1% of all households
Household received Food Stamps/SNAP in the past 12 months: 990Household did not receive Food Stamps/SNAP in the past 12 months: 15,469
Women who had a birth in the past 12 months: 656 (507 now married , 162 unmarried) Women who did not have a birth in the past 12 months: 9,983 (4,466 now married , 5,499 unmarried)
Housing units in zip code 89149 with a mortgage: 8,338 (691
second mortgage , 25
home equity loan , 548
both second mortgage and home equity loan )
Houses without a mortgage: 54
Median monthly owner costs for units with a mortgage: $2,024
Median monthly owner costs for units without a mortgage: $618
Residents with income below the poverty level in 2022:
This zip code:
5.7%Whole state:
12.5%
Residents with income below 50% of the poverty level in 2022:
This zip code:
1.8%Whole state:
5.9%
Median number of rooms in houses and condos: Median number of rooms in apartments:
Year house built (houses)
53 2020 or later4,655 2010 to 20198,023 2000 to 20093,567 1990 to 19991,237 1980 to 1989296 1970 to 197937 1960 to 1969132 1950 to 195911 1940 to 194946 1939 or earlier
Zip code 89149 household income distribution in 2022 700 Less than $10,000107 $10,000 to $14,999224 $15,000 to $19,999425 $20,000 to $24,999179 $25,000 to $29,999476 $30,000 to $34,999536 $35,000 to $39,999515 $40,000 to $44,999684 $45,000 to $49,9991,183 $50,000 to $59,9991,427 $60,000 to $74,9992,197 $75,000 to $99,9992,061 $100,000 to $124,9991,612 $125,000 to $149,9992,019 $150,000 to $199,9992,296 $200,000 or moreEstimate of home value of owner-occupied houses/condos in 2022 in zip code 89149 73 Less than $10,0003 $35,000 to $39,9997 $70,000 to $79,99924 $80,000 to $89,9993 $90,000 to $99,99943 $100,000 to $124,99916 $125,000 to $149,99965 $150,000 to $174,99943 $175,000 to $199,999309 $200,000 to $249,999698 $250,000 to $299,9992,136 $300,000 to $399,9992,416 $400,000 to $499,9994,343 $500,000 to $749,9991,615 $750,000 to $999,999950 $1,000,000 to $1,499,99936 $1,500,000 to $1,999,999106 $2,000,000 or moreRent paid by renters in 2022 in zip code 89149 28 $100 to $1499 $600 to $64927 $650 to $69917 $800 to $89988 $900 to $999796 $1,000 to $1,2491,418 $1,250 to $1,4992,256 $1,500 to $1,999671 $2,000 to $2,499177 $2,500 to $2,99910 $3,500 or more148 No cash rent
Median gross rent in 2022: $1,807.
Median price asked for vacant for-sale houses and condos in 2022: $354,375.
Estimated median house (or condo) value in 2022 for: White Non-Hispanic householders: $555,351Black or African American householders: $573,183Asian householders: $413,966Some other race householders: $780,294Two or more races householders: $425,174Hispanic or Latino householders: $555,860Estimated median house or condo value in 2022: $535,990
89149:
$535,990Nevada:
$434,700
Lower value quartile - upper value quartile: $393,658 - $817,802
Mean price in 2022: Detached houses: $671,629Here:
$671,629State:
$549,327
Townhouses or other attached units: $290,301Here:
$290,301State:
$328,893
In 3-to-4-unit structures: $470,361Here:
$470,361State:
$295,216
In 5-or-more-unit structures: $348,313Here:
$348,313State:
$297,847
Housing units in structures:
One, detached: 13,460One, attached: 961Two: 423 or 4: 8605 to 9: 53710 to 19: 43820 to 49: 26250 or more: 1,132Mobile homes: 2Unemployment : 4.8%
Means of transportation to work in zip code 89149 74.1% 17,182 Drove a car alone8.9% 2,066 Carpooled0.4% 96 Bus or trolley bus0.6% 128 Taxi0.5% 124 Motorcycle0.2% 44 Bicycle0.7% 156 Walked0.8% 191 Other means14.1% 3,274 Worked at homeTravel time to work (commute) in zip code 89149 91 Less than 5 minutes1,186 5 to 9 minutes1,603 10 to 14 minutes2,250 15 to 19 minutes3,865 20 to 24 minutes2,412 25 to 29 minutes4,004 30 to 34 minutes1,111 35 to 39 minutes1,235 40 to 44 minutes1,769 45 to 59 minutes340 60 to 89 minutes161 90 or more minutes
Neighborhoods in zip code 89149: Percentage of zip code residents living and working in this county: 98.2%
Household type by relationship:
Households: 44,961
Male householders: 8,477 (1,992 living alone ), Female householders: 8,134 (1,932 living alone )8,851 spouses (8,640 opposite-sex spouses ), 1,122 unmarried partners , (1,068 opposite-sex unmarried partners ), 12,822 children (11,995 natural , 257 adopted , 562 stepchildren ), 1,384 grandchildren , 613 brothers or sisters , 1,203 parents , 0 foster children , 1,226 other relatives , 1,086 non-relatives In group quarters: 127 (-1 institutionalized population )
Size of family households: 5,065 2-persons , 2,706 3-persons , 2,249 4-persons , 1,013 5-persons , 455 6-persons , 242 7-or-more-persons
Size of nonfamily households: 3,924 1-person , 893 2-persons , 97 3-persons , 10 4-persons
6,141 married couples with children. single-parent households (837 men , 1,582 women ).
85.5% of residents of 89149 zip code speak English at home. of residents speak Spanish at home (74% very well, 17% well, 8% not well, 1% not at all ).of residents speak other Indo-European language at home (82% very well, 12% well, 6% not well ).of residents speak Asian or Pacific Island language at home (65% very well, 30% well, 1% not well, 3% not at all ).of residents speak other language at home (59% very well, 31% well, 10% not well ).
Foreign born population: 4,767 (10.6%)
(68.6%
of them are naturalized citizens )
This zip code:
10.6%Whole state:
18.9%
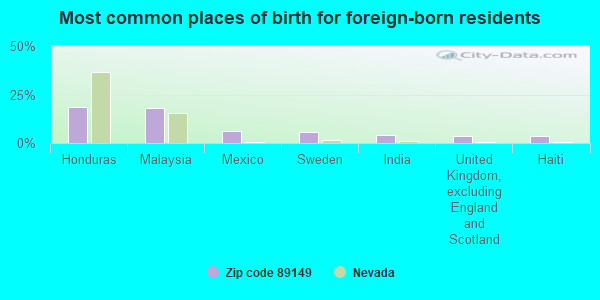
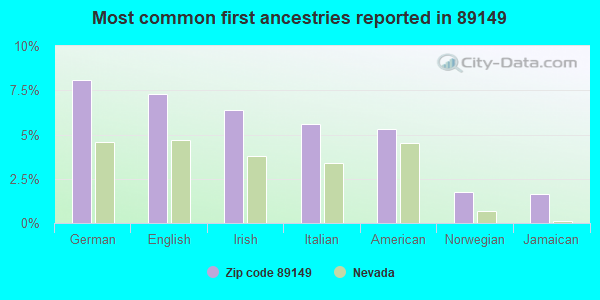
19% Honduras 18% Malaysia 6% Mexico 6% Sweden 4% India 4% United Kingdom, excluding England and Scotland 3% Haiti 8% German 7% English 6% Irish 6% Italian 5% American 2% Norwegian 2% Jamaican
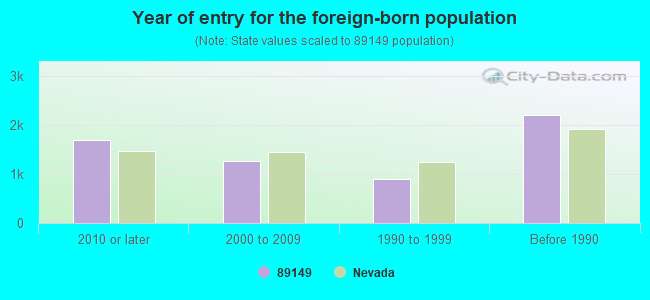
Year of entry for the foreign-born population
1,702 2010 or later 1,261 2000 to 2009 894 1990 to 1999 2,206 Before 1990
There are
104 Medical Specialists in Zip Code 89149 .
Facilities with environmental interests located in this zip code:
DARNELL, MARSHALL ELEM (9480 WEST TROPICAL PKWY in LAS VEGAS, NV)
(National Center for Education Statistics) - STATE ID-02-172 Organizations: CLARK CO SCH DIST (SCHOOL DISTRICT)
PETERSON CREDIT RETRIEVAL HS - HORIZON (10250 WEST CENTENNIAL PKWY in LAS VEGAS, NV)
(National Center for Education Statistics) - STATE ID-02-931 Organizations: CLARK CO SCH DIST (SCHOOL DISTRICT)
CENTENNIAL AUTO DBA PEOPLES G M C (6401 CENTENNIAL CENTER BLVD in LAS VEGAS, NV)
Small Quantity Generators, between 100 kg and 1000 kg of hazardous waste/month (Resource Conservation and Recovery Act (tracking hazardous waste)) - notification Organizations: JOE SEALA (CONTACT/OPERATOR)
, COURTESY INC (CONTACT/OWNER)
Alternative names: COURTESY G M C
HOME DEPOT USA INC HD3305 (7881 W TROPICAL PKWY in LAS VEGAS, NV)
Small Quantity Generators, between 100 kg and 1000 kg of hazardous waste/month (Resource Conservation and Recovery Act (tracking hazardous waste)) Organizations: HOME DEPOT 3305 (CONTACT/OPERATOR)
Alternative names: THE HOME DEPOT 3305
SMITHS PHOTO NO 396 (9350 WEST FLAMINGO RD in LAS VEGAS, NV)
(Resource Conservation and Recovery Act (tracking hazardous waste)) Organizations: SMITHS FOOD AND DRUG CENTERS (CONTACT/OWNER)
SERVICE ROCK PRODUCTS INC LONE MOUNTAIN NV FACILITY (10815 W WASHBURN in LAS VEGAS, NV)
TRI REPORTER (Tracking of toxic chemicals releasing facilities) Business SIC classification: READY-MIXED CONCRETE
Housing units lacking complete plumbing facilities: 0.0%
Housing units lacking complete kitchen facilities: 0.1%
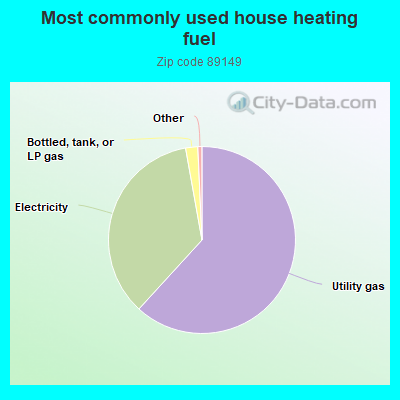
61.8% Utility gas 35.4% Electricity 2.1% Bottled, tank, or LP gas
Place of birth for U.S.-born residents:
This state: 13,164Northeast: 3,397Midwest: 5,102South: 4,048West: 13,130
39% of the 89149 zip code residents lived in the same house 5 years ago.
Out of people who lived in different houses, 64% lived in this county.
Out of people who lived in different counties, 50% lived in Nevada.
86% of the 89149 zip code residents lived in the same house 1 year ago.
Out of people who lived in different houses, 61% moved from this county.
Out of people who lived in different houses, 1% moved from different county within same state.
Out of people who lived in different houses, 36% moved from different state.
Out of people who lived in different houses, 2% moved from abroad.
Private vs. public school enrollment:
Students in private schools in grades 1 to 8 (elementary and middle school): 1,032
Students in private schools in grades 9 to 12 (high school): 252
Students in private undergraduate colleges: 677
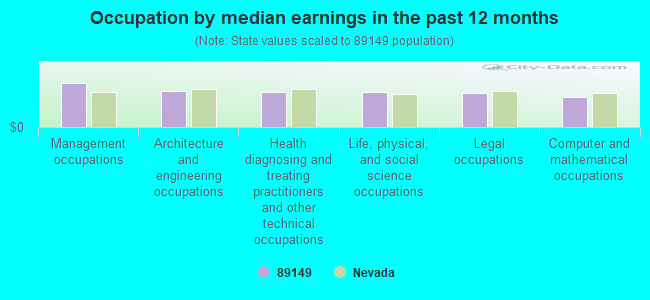
Occupation by median earnings in the past 12 months ($)
104,469 Management occupations 86,536 Architecture and engineering occupations 83,647 Health diagnosing and treating practitioners and other technical occupations 82,439 Life, physical, and social science occupations 80,357 Legal occupations 71,912 Computer and mathematical occupations
Companies with federal contracts located in this zip code:
HDG ENTERPRISES (8997 OLD RIVER AVE in LAS VEGAS, NV; small business) in 3 contracts from 2004 to 2005
$65,551 with Navy for ADP Support Equipment. Signed on 2004-07-29. Completion date: 2004-08-05.
, same as above. Signed on 2004-07-30. Completion date: 2004-08-05.
with Navy for ADP Components. Signed on 2005-05-20. Completion date: 2006-01-19.
PETRA D SALYER (7783 GREENLAKE WAY in LAS VEGAS, VA; small business)
$27,040 with Army for Other Medical Services. Taking place in VA. Signed on 2000-01-01. Completion date: 2000-09-30.
COOLING & POWER RENTALS, INC (8675 W ANN RD in LAS VEGAS, NV; small business) in 2 contracts from 2004 to 2005
$15,000 with Army for Generators and Generators Sets, Electrical. Signed on 2004-08-10. Completion date: 2004-08-12.
with Army for Air Conditioning Equipment. Signed on 2005-07-21. Completion date: 2005-07-22.
Top industries in this zip code by the number of employees in 2005:
Accommodation and Food Services: Full-Service Restaurants (100-249 employees: 1 establishment, 50-99 employees: 2 establishments, 20-49 employees: 2 establishments, 10-19 employees: 1 establishment, 1-4 employees: 6 establishments)Accommodation and Food Services: Limited-Service Restaurants (20-49: 4, 10-19: 3, 5-9: 1, 1-4: 4)Construction: Masonry Contractors (50-99: 1, 20-49: 1, 10-19: 1)Accommodation and Food Services: Drinking Places (Alcoholic Beverages) (50-99: 1, 5-9: 1, 1-4: 1)
People in group quarters in 2010:
9 people in group homes intended for adults
People in group quarters in 2000:
10 people in nursing homes
Fatal accident statistics in 2014:
Fatal accident count: 4Vehicles involved in fatal accidents: 10Fatal accidents caused by drunken drivers: 1Fatalities: 4Persons involved in fatal accidents: 16Pedestrians involved in fatal accidents: 0
Fatal accident statistics in 2013:
Fatal accident count: 3Vehicles involved in fatal accidents: 4Fatal accidents caused by drunken drivers: 0Fatalities: 3Persons involved in fatal accidents: 4Pedestrians involved in fatal accidents: 0
Home Mortgage Disclosure Act Aggregated Statistics For Year 2009(Based on 2 full and 2 partial tracts) A) FHA, FSA/RHS & VA B) Conventional C) Refinancings D) Home Improvement Loans F) Non-occupant Loans on G) Loans On Manufactured Number Average Value Number Average Value Number Average Value Number Average Value Number Average Value Number Average Value
LOANS ORIGINATED 1,719 $180,779 724 $157,612 1,040 $232,406 28 $114,324 340 $133,515 4 $97,405 APPLICATIONS APPROVED, NOT ACCEPTED 92 $179,747 72 $146,110 121 $230,675 9 $12,653 46 $136,879 0 $0 APPLICATIONS DENIED 282 $182,962 175 $179,003 533 $255,297 42 $66,788 129 $154,862 0 $0 APPLICATIONS WITHDRAWN 125 $193,046 120 $176,119 288 $244,701 2 $91,460 55 $151,398 0 $0 FILES CLOSED FOR INCOMPLETENESS 22 $201,350 17 $193,922 69 $273,379 0 $0 9 $311,777 0 $0
Aggregated Statistics For Year 2008(Based on 2 full and 2 partial tracts) A) FHA, FSA/RHS & VA B) Conventional C) Refinancings D) Home Improvement Loans E) Loans on Dwellings For 5+ Families F) Non-occupant Loans on G) Loans On Manufactured Number Average Value Number Average Value Number Average Value Number Average Value Number Average Value Number Average Value Number Average Value
LOANS ORIGINATED 1,716 $230,377 1,098 $233,380 507 $260,041 50 $68,868 0 $0 427 $195,952 0 $0 APPLICATIONS APPROVED, NOT ACCEPTED 137 $232,199 193 $254,084 98 $277,639 26 $43,465 2 $4,575 77 $206,289 0 $0 APPLICATIONS DENIED 306 $229,309 316 $271,434 564 $274,622 151 $65,484 0 $0 194 $205,883 4 $55,332 APPLICATIONS WITHDRAWN 154 $258,327 204 $274,592 187 $252,597 22 $207,726 0 $0 72 $196,453 0 $0 FILES CLOSED FOR INCOMPLETENESS 24 $247,095 28 $350,466 41 $256,079 4 $96,032 0 $0 11 $313,292 0 $0
Aggregated Statistics For Year 2007(Based on 2 full and 2 partial tracts) A) FHA, FSA/RHS & VA B) Conventional C) Refinancings D) Home Improvement Loans F) Non-occupant Loans on G) Loans On Manufactured Number Average Value Number Average Value Number Average Value Number Average Value Number Average Value Number Average Value
LOANS ORIGINATED 332 $242,618 2,556 $244,957 1,409 $278,659 121 $114,854 684 $215,386 0 $0 APPLICATIONS APPROVED, NOT ACCEPTED 18 $268,689 597 $249,099 443 $292,567 59 $85,293 160 $244,741 0 $0 APPLICATIONS DENIED 57 $248,803 818 $317,203 1,374 $293,978 203 $126,120 416 $254,800 4 $37,955 APPLICATIONS WITHDRAWN 38 $237,363 553 $243,882 584 $302,183 35 $161,519 184 $274,522 0 $0 FILES CLOSED FOR INCOMPLETENESS 0 $0 70 $289,261 212 $284,121 5 $114,142 37 $208,505 0 $0
Aggregated Statistics For Year 2006(Based on 2 full and 2 partial tracts) A) FHA, FSA/RHS & VA B) Conventional C) Refinancings D) Home Improvement Loans E) Loans on Dwellings For 5+ Families F) Non-occupant Loans on G) Loans On Manufactured Number Average Value Number Average Value Number Average Value Number Average Value Number Average Value Number Average Value Number Average Value
LOANS ORIGINATED 86 $268,674 5,381 $209,746 2,182 $262,370 264 $111,119 2 $191,150 1,657 $188,539 2 $4,575 APPLICATIONS APPROVED, NOT ACCEPTED 5 $313,160 955 $220,695 484 $272,426 83 $117,015 0 $0 326 $194,075 2 $84,145 APPLICATIONS DENIED 18 $269,096 1,160 $243,614 1,295 $281,998 178 $135,582 0 $0 440 $218,767 5 $128,044 APPLICATIONS WITHDRAWN 15 $260,993 1,043 $214,667 802 $295,826 37 $104,650 0 $0 310 $208,435 0 $0 FILES CLOSED FOR INCOMPLETENESS 2 $685,035 131 $262,703 230 $277,783 9 $88,947 0 $0 53 $226,155 0 $0
Aggregated Statistics For Year 2005(Based on 2 full and 2 partial tracts) A) FHA, FSA/RHS & VA B) Conventional C) Refinancings D) Home Improvement Loans F) Non-occupant Loans on G) Loans On Manufactured Number Average Value Number Average Value Number Average Value Number Average Value Number Average Value Number Average Value
LOANS ORIGINATED 88 $235,890 7,734 $198,675 2,372 $279,563 263 $154,717 3,070 $173,398 4 $51,675 APPLICATIONS APPROVED, NOT ACCEPTED 5 $229,382 1,080 $201,847 369 $259,695 52 $101,902 416 $167,531 2 $37,500 APPLICATIONS DENIED 4 $235,968 1,854 $199,449 956 $274,279 199 $110,440 905 $177,243 5 $44,632 APPLICATIONS WITHDRAWN 7 $301,296 1,782 $206,868 851 $275,915 131 $185,124 607 $172,252 2 $129,690 FILES CLOSED FOR INCOMPLETENESS 2 $207,615 309 $219,190 145 $279,137 7 $121,511 119 $164,776 0 $0
Aggregated Statistics For Year 2004(Based on 2 full and 2 partial tracts) A) FHA, FSA/RHS & VA B) Conventional C) Refinancings D) Home Improvement Loans E) Loans on Dwellings For 5+ Families F) Non-occupant Loans on G) Loans On Manufactured Number Average Value Number Average Value Number Average Value Number Average Value Number Average Value Number Average Value Number Average Value
LOANS ORIGINATED 138 $170,726 4,109 $206,904 2,055 $240,831 213 $110,980 2 $167,715 1,249 $188,860 13 $107,517 APPLICATIONS APPROVED, NOT ACCEPTED 13 $189,955 705 $197,435 283 $263,161 41 $94,922 0 $0 171 $192,579 2 $248,650 APPLICATIONS DENIED 42 $124,501 948 $202,212 590 $247,390 154 $92,091 0 $0 308 $192,812 0 $0 APPLICATIONS WITHDRAWN 24 $179,414 687 $205,211 432 $234,760 71 $76,636 0 $0 167 $183,609 0 $0 FILES CLOSED FOR INCOMPLETENESS 16 $147,022 164 $174,701 122 $266,215 20 $103,468 2 $117,985 59 $164,967 0 $0
Aggregated Statistics For Year 2003(Based on 2 full and 2 partial tracts) A) FHA, FSA/RHS & VA B) Conventional C) Refinancings D) Home Improvement Loans F) Non-occupant Loans on Number Average Value Number Average Value Number Average Value Number Average Value Number Average Value
LOANS ORIGINATED 77 $160,523 1,716 $188,231 2,620 $187,250 124 $45,559 431 $147,884 APPLICATIONS APPROVED, NOT ACCEPTED 7 $178,259 250 $176,025 376 $192,029 24 $58,610 100 $157,792 APPLICATIONS DENIED 20 $151,659 388 $172,855 634 $199,428 75 $44,955 71 $153,547 APPLICATIONS WITHDRAWN 17 $164,168 175 $195,685 446 $204,213 15 $34,553 56 $148,951 FILES CLOSED FOR INCOMPLETENESS 5 $198,286 28 $163,036 122 $324,309 11 $47,015 10 $137,353
Aggregated Statistics For Year 1999(Based on 1 partial tract) A) FHA, FSA/RHS & VA B) Conventional C) Refinancings D) Home Improvement Loans E) Loans on Dwellings For 5+ Families F) Non-occupant Loans on Number Average Value Number Average Value Number Average Value Number Average Value Number Average Value Number Average Value
LOANS ORIGINATED 116 $124,879 424 $158,591 379 $151,313 94 $38,194 1 $122,170 61 $130,792 APPLICATIONS APPROVED, NOT ACCEPTED 3 $112,747 51 $181,983 71 $155,875 39 $30,203 0 $0 5 $129,644 APPLICATIONS DENIED 25 $116,078 93 $175,556 150 $154,661 60 $25,740 1 $45,590 15 $130,312 APPLICATIONS WITHDRAWN 11 $129,213 58 $175,251 88 $157,320 9 $21,577 0 $0 8 $159,091 FILES CLOSED FOR INCOMPLETENESS 2 $103,480 17 $183,681 19 $126,055 2 $36,470 0 $0 0 $0
Detailed HMDA statistics for the following Tracts:
0032.03
,
0032.04
Private Mortgage Insurance Companies Aggregated Statistics For Year 2009(Based on 2 full and 2 partial tracts) A) Conventional B) Refinancings C) Non-occupant Loans on Number Average Value Number Average Value Number Average Value
LOANS ORIGINATED 85 $221,753 15 $260,925 6 $173,187 APPLICATIONS APPROVED, NOT ACCEPTED 51 $241,067 6 $266,760 2 $50,305 APPLICATIONS DENIED 22 $242,370 11 $320,474 0 $0 APPLICATIONS WITHDRAWN 9 $199,789 2 $341,285 2 $138,105 FILES CLOSED FOR INCOMPLETENESS 7 $260,304 0 $0 2 $174,690
Aggregated Statistics For Year 2008(Based on 2 full and 2 partial tracts) A) Conventional B) Refinancings C) Non-occupant Loans on Number Average Value Number Average Value Number Average Value
LOANS ORIGINATED 312 $262,509 39 $280,340 83 $246,217 APPLICATIONS APPROVED, NOT ACCEPTED 142 $267,886 59 $288,756 40 $272,185 APPLICATIONS DENIED 37 $271,632 5 $220,602 20 $242,686 APPLICATIONS WITHDRAWN 16 $311,192 2 $167,370 5 $171,944 FILES CLOSED FOR INCOMPLETENESS 15 $259,625 4 $171,488 7 $289,014
Aggregated Statistics For Year 2007(Based on 2 full and 2 partial tracts) A) Conventional B) Refinancings C) Non-occupant Loans on Number Average Value Number Average Value Number Average Value
LOANS ORIGINATED 445 $253,891 136 $320,939 83 $259,388 APPLICATIONS APPROVED, NOT ACCEPTED 68 $266,579 55 $284,278 13 $225,414 APPLICATIONS DENIED 15 $330,841 15 $352,304 9 $316,654 APPLICATIONS WITHDRAWN 42 $280,449 7 $317,084 13 $223,022 FILES CLOSED FOR INCOMPLETENESS 2 $235,965 2 $576,200 0 $0
Aggregated Statistics For Year 2006(Based on 2 full and 2 partial tracts) A) Conventional B) Refinancings C) Non-occupant Loans on Number Average Value Number Average Value Number Average Value
LOANS ORIGINATED 321 $276,673 94 $321,086 106 $245,560 APPLICATIONS APPROVED, NOT ACCEPTED 92 $269,202 28 $340,845 42 $214,365 APPLICATIONS DENIED 9 $233,731 4 $310,380 7 $253,664 APPLICATIONS WITHDRAWN 35 $255,095 9 $316,606 16 $235,281 FILES CLOSED FOR INCOMPLETENESS 2 $190,235 5 $138,288 5 $138,288
Aggregated Statistics For Year 2005(Based on 2 full and 2 partial tracts) A) Conventional B) Refinancings C) Non-occupant Loans on Number Average Value Number Average Value Number Average Value
LOANS ORIGINATED 754 $233,361 82 $296,119 325 $193,921 APPLICATIONS APPROVED, NOT ACCEPTED 212 $252,893 13 $339,809 70 $203,407 APPLICATIONS DENIED 29 $238,868 2 $246,940 7 $186,317 APPLICATIONS WITHDRAWN 93 $279,087 9 $300,396 29 $225,201 FILES CLOSED FOR INCOMPLETENESS 4 $323,310 2 $222,250 0 $0
Aggregated Statistics For Year 2004(Based on 2 full and 2 partial tracts) A) Conventional B) Refinancings C) Non-occupant Loans on D) Loans On Manufactured Number Average Value Number Average Value Number Average Value Number Average Value
LOANS ORIGINATED 805 $218,272 55 $249,012 312 $194,751 0 $0 APPLICATIONS APPROVED, NOT ACCEPTED 164 $237,225 19 $266,326 52 $199,081 2 $238,710 APPLICATIONS DENIED 16 $257,803 4 $238,710 4 $194,352 0 $0 APPLICATIONS WITHDRAWN 61 $229,465 2 $230,125 28 $191,639 0 $0 FILES CLOSED FOR INCOMPLETENESS 9 $152,027 0 $0 4 $154,568 0 $0
Aggregated Statistics For Year 2003(Based on 2 full and 2 partial tracts) A) Conventional B) Refinancings C) Non-occupant Loans on Number Average Value Number Average Value Number Average Value
LOANS ORIGINATED 354 $204,005 214 $216,488 66 $170,453 APPLICATIONS APPROVED, NOT ACCEPTED 52 $201,092 62 $220,630 13 $153,305 APPLICATIONS DENIED 11 $219,603 5 $353,768 2 $259,375 APPLICATIONS WITHDRAWN 9 $219,859 19 $220,562 4 $175,030 FILES CLOSED FOR INCOMPLETENESS 0 $0 4 $267,178 0 $0
Aggregated Statistics For Year 1999(Based on 1 partial tract) A) Conventional B) Refinancings C) Non-occupant Loans on Number Average Value Number Average Value Number Average Value
LOANS ORIGINATED 172 $188,303 48 $183,651 19 $172,215 APPLICATIONS APPROVED, NOT ACCEPTED 18 $192,217 8 $232,598 2 $125,815 APPLICATIONS DENIED 17 $209,208 6 $173,830 1 $164,110 APPLICATIONS WITHDRAWN 8 $196,015 5 $119,068 1 $153,170 FILES CLOSED FOR INCOMPLETENESS 5 $145,142 1 $117,610 1 $117,610
Detailed PMIC statistics for the following Tracts:
0032.03
,
0032.04
2002 - 2018 National Fire Incident Reporting System (NFIRS) incidents See full 2006 National Fire Incident Reporting System statistics for zip code 89149, Nevada
Most common first names in zip code 89149 among deceased individuals Name Count Lived (average)
Robert 19 74.4 years Mary 17 79.5 years William 16 74.2 years James 14 69.1 years John 14 75.7 years Donald 13 73.9 years Charles 10 75.7 years Michael 8 62.4 years Helen 8 87.1 years Margaret 8 77.9 years
Most common last names in zip code 89149 among deceased individuals Last name Count Lived (average)
Johnson 6 73.4 years Smith 5 69.6 years Williams 5 80.0 years Hansen 4 80.2 years Lewis 4 71.2 years Anderson 3 74.7 years Christensen 2 84.5 years Fultz 2 77.4 years Cross 2 78.0 years Bombara 2 71.4 years
Businesses in zip code 89149
Name Count Name Count
24 Hour Fitness 1 Lane Bryant 1 7-Eleven 1 Lane Furniture 1 AT&T 1 Long John Silver's 1 Arby's 1 MasterBrand Cabinets 1 Baja Fresh Mexican Grill 1 Mazda 1 Bath & Body Works 1 McDonald's 2 Big O Tires 1 New Balance 1 Buffalo Wild Wings 1 Nike 2 Chipotle 1 Nissan 1 Cold Stone Creamery 1 Office Depot 1 Cricket Wireless 1 OfficeMax 1 Curves 1 On The Border 1 Domino's Pizza 1 Panda Express 1 DressBarn 1 Payless 1 Dressbarn 1 PetSmart 1 Dunkin Donuts 1 Pier 1 Imports 1 El Pollo Loco 1 Quiznos 1 Famous Footwear 1 RadioShack 1 FedEx 3 Red Robin 1 GameStop 1 Sam's Club 1 H&R Block 2 Starbucks 2 Home Depot 1 Subway 3 IHOP 1 T-Mobile 3 Justice 1 T.J.Maxx 1 KFC 1 Toyota 1 Kincaid 1 U-Haul 1 Kohl's 1 UPS 2 Kroger 1 Walgreens 2 La-Z-Boy 1 Walmart 1


 Nearest zip codes: 89129, 89143, 89131, 89130, 89134, 89128.
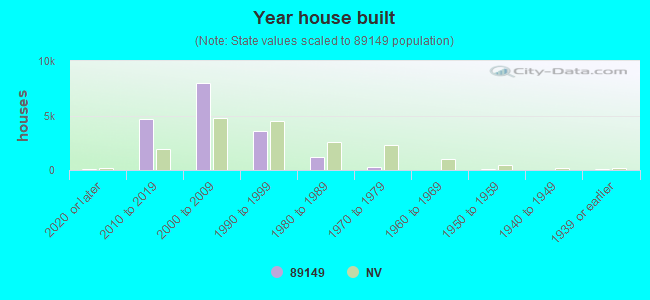


 Based on the data from the years 2002 - 2018 the average number of fire incidents per year is 48. The highest number of fires - 89 took place in 2008, and the least - 0 in 2003. The data has a growing trend.
 When looking into fire subcategories, the most incidents belonged to: Outside Fires (52.3%), and Structure Fires (27.3%).