Estimated zip code population in 2022: 27,058 Zip code population in 2010: 23,186 Zip code population in 2000: 19,337
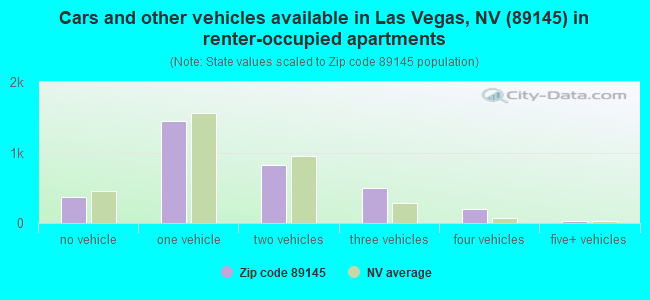
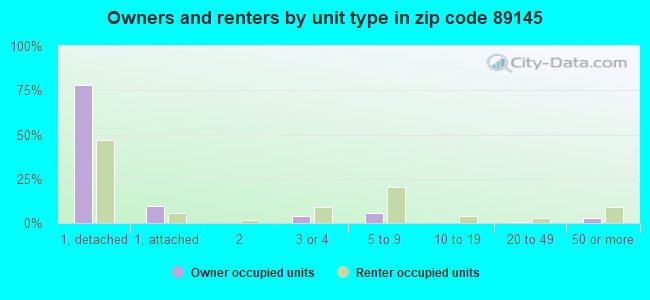
Houses and condos: 11,088 Renter-occupied apartments: 3,334
% of renters here:
33%
State:
40%
March 2022 cost of living index in zip code 89145: 98.6 (near average, U.S. average is 100)
Land area: 4.6 sq. mi. Water area: 0.0 sq. mi.
Population density: 5,875 people per square mile
(average).
OSM Map
General Map
Google Map
MSN Map
OSM Map
General Map
Google Map
MSN Map
OSM Map
General Map
Google Map
MSN Map
OSM Map
General Map
Google Map
MSN Map
Please wait while loading the map...
Real estate property taxes paid for housing units in 2022:
This zip code:
0.4% ($1,462)
Nevada:
0.4% ($1,889)
Median real estate property taxes paid for housing units with mortgages in 2022: $1,523 (0.4%) Median real estate property taxes paid for housing units with no mortgage in 2022: $1,368 (0.4%)
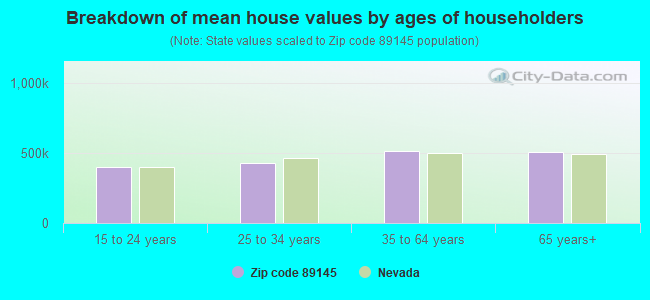
Estimated median house/condo value in 2022: $367,251
89145:
$367,251
Nevada:
$434,700
According to our research of Nevada and other state lists, there were 53 registered sex offenders living in 89145 zip code as of April 27, 2024. The ratio of all residents to sex offenders in zip code 89145 is 482 to 1. The ratio of registered sex offenders to all residents in this zip code is lower than the state average.
Median resident age:
This zip code:
41.3 years
Nevada median age:
39.0 years
Average household size:
This zip code:
2.7 people
Nevada:
2.6 people
Averages for the 2020 tax year for zip code 89145, filed in 2021:
Average Adjusted Gross Income (AGI) in 2020: $139,725 (Individual Income Tax Returns)
Here:
$139,725
State:
$78,964
Salary/wage: $55,066 (reported on 78.7% of returns)
Here:
$55,066
State:
$54,472
(% of AGI for various income ranges: 1089.6% for AGIs below $25k, 3430.8% for AGIs $25k-50k, 6286.1% for AGIs $50k-75k, 9042.2% for AGIs $75k-100k, 15820.2% for AGIs $100k-200k, 123022.0% for AGIs over 200k)
Taxable interest for individuals: $30,240 (reported on 22.8% of returns)
This zip code:
$30,240
Nevada:
$3,521
(% of AGI for various income ranges: 9.7% for AGIs below $25k, 12.3% for AGIs $25k-50k, 43.0% for AGIs $50k-75k, 70.0% for AGIs $75k-100k, 169.2% for AGIs $100k-200k, 58596.0% for AGIs over 200k)
Ordinary dividends: $47,920 (reported on 14.6% of returns)
Here:
$47,920
State:
$13,390
(% of AGI for various income ranges: 19.0% for AGIs below $25k, 30.8% for AGIs $25k-50k, 67.6% for AGIs $50k-75k, 192.4% for AGIs $75k-100k, 460.2% for AGIs $100k-200k, 56855.3% for AGIs over 200k)
Net capital gain/loss in AGI: +$182,558 (reported on 15.7% of returns)
Here:
+$182,558
State:
+$63,025
(% of AGI for various income ranges: 10.8% for AGIs below $25k, 32.2% for AGIs $25k-50k, 79.3% for AGIs $50k-75k, 210.4% for AGIs $75k-100k, 775.6% for AGIs $100k-200k, 246082.0% for AGIs over 200k)
Profit/loss from business: +$7,969 (reported on 18.3% of returns)
Here:
+$7,969
State:
+$11,500
(% of AGI for various income ranges: 93.4% for AGIs below $25k, 89.1% for AGIs $25k-50k, 219.0% for AGIs $50k-75k, 215.6% for AGIs $75k-100k, 680.3% for AGIs $100k-200k, 3177.3% for AGIs over 200k)
Taxable individual retirement arrangement distribution: $22,898 (reported on 6.6% of returns)
89145:
$22,898
Nevada:
$23,628
(% of AGI for various income ranges: 41.1% for AGIs below $25k, 65.9% for AGIs $25k-50k, 127.9% for AGIs $50k-75k, 318.2% for AGIs $75k-100k, 855.4% for AGIs $100k-200k, 4825.3% for AGIs over 200k)
Self-employed (Keogh) retirement plans: $48,767 (reported on 0.2% of returns)
89145:
$48,767
Nevada:
$26,634
(% of AGI for various income ranges: 975.3% for AGIs over 200k)
Total itemized deductions: $82,656 (reported on 8.3% of returns)
Here:
$82,656
State:
$44,173
(% of AGI for various income ranges: 48.8% for AGIs below $25k, 120.6% for AGIs $25k-50k, 337.7% for AGIs $50k-75k, 517.5% for AGIs $75k-100k, 1264.8% for AGIs $100k-200k, 45795.3% for AGIs over 200k)
Charity contributions: $32,175 (reported on 6.7% of returns)
Here:
$32,175
State:
$12,589
(% of AGI for various income ranges: 4.3% for AGIs below $25k, 18.2% for AGIs $25k-50k, 52.3% for AGIs $50k-75k, 80.6% for AGIs $75k-100k, 217.8% for AGIs $100k-200k, 16651.3% for AGIs over 200k)
Taxes paid: $6,181 (reported on 8.2% of returns)
89145:
$6,181
State:
$6,112
(% of AGI for various income ranges: 7.0% for AGIs below $25k, 20.6% for AGIs $25k-50k, 60.4% for AGIs $50k-75k, 88.5% for AGIs $75k-100k, 225.4% for AGIs $100k-200k, 1977.3% for AGIs over 200k)
Earned income credit: $2,010 (reported on 17.2% of returns)
Here:
$2,010
State:
$2,214
(% of AGI for various income ranges: 86.2% for AGIs below $25k, 60.0% for AGIs $25k-50k, 0.9% for AGIs $50k-75k)
Percentage of individuals using paid preparers for their 2020 taxes: 93.0%
Here:
93%
State:
93%
(% for various income ranges: 92.5% for AGIs below $25k, 93.6% for AGIs $25k-50k, 93.3% for AGIs $50k-75k, 93.5% for AGIs $75k-100k, 92.4% for AGIs $100k-200k, 92.5% for AGIs over 200k)
Averages for the 2012 tax year for zip code 89145, filed in 2013:
Average Adjusted Gross Income (AGI) in 2012: $84,385 (Individual Income Tax Returns)
Here:
$84,385
State:
$61,164
Salary/wage: $52,992 (reported on 81.2% of returns)
Here:
$52,992
State:
$45,924
(% of AGI for various income ranges: 71.1% for AGIs below $25k, 81.9% for AGIs $25k-50k, 76.8% for AGIs $50k-75k, 72.8% for AGIs $75k-100k, 67.0% for AGIs $100k-200k, 29.5% for AGIs over 200k)
Taxable interest for individuals: $6,659 (reported on 25.7% of returns)
This zip code:
$6,659
Nevada:
$3,137
(% of AGI for various income ranges: 0.9% for AGIs below $25k, 0.4% for AGIs $25k-50k, 0.5% for AGIs $50k-75k, 0.6% for AGIs $75k-100k, 1.5% for AGIs $100k-200k, 3.1% for AGIs over 200k)
Ordinary dividends: $25,128 (reported on 15.3% of returns)
Here:
$25,128
State:
$11,762
(% of AGI for various income ranges: 2.9% for AGIs below $25k, 1.1% for AGIs $25k-50k, 0.7% for AGIs $50k-75k, 1.3% for AGIs $75k-100k, 1.9% for AGIs $100k-200k, 7.4% for AGIs over 200k)
Net capital gain/loss in AGI: +$76,804 (reported on 13.9% of returns)
Here:
+$76,804
State:
+$33,127
(% of AGI for various income ranges: 0.1% for AGIs $25k-50k, 0.3% for AGIs $50k-75k, 0.6% for AGIs $75k-100k, 1.7% for AGIs $100k-200k, 23.8% for AGIs over 200k)
Profit/loss from business: +$15,416 (reported on 14.5% of returns)
Here:
+$15,416
State:
+$12,567
(% of AGI for various income ranges: 7.4% for AGIs below $25k, 2.5% for AGIs $25k-50k, 1.9% for AGIs $50k-75k, 1.3% for AGIs $75k-100k, 3.5% for AGIs $100k-200k, 2.3% for AGIs over 200k)
Taxable individual retirement arrangement distribution: $25,401 (reported on 8.9% of returns)
89145:
$25,401
Nevada:
$20,808
(% of AGI for various income ranges: 2.8% for AGIs below $25k, 1.8% for AGIs $25k-50k, 2.4% for AGIs $50k-75k, 2.5% for AGIs $75k-100k, 4.7% for AGIs $100k-200k, 2.5% for AGIs over 200k)
Self-employment retirement plans: $19,150 (reported on 0.5% of returns)
89145:
$19,150
Nevada:
$22,197
Total itemized deductions: $42,038 (22% of AGI, reported on 30.5% of returns)
Here:
$42,038
State:
$26,148
Here:
21.7% of AGI
State:
20.0% of AGI
(% of AGI for various income ranges: 11.2% for AGIs below $25k, 11.4% for AGIs $25k-50k, 11.6% for AGIs $50k-75k, 12.1% for AGIs $75k-100k, 14.8% for AGIs $100k-200k, 17.7% for AGIs over 200k)
Charity contributions: $7,372 (reported on 25.5% of returns)
Here:
$7,372
State:
$4,329
(% of AGI for various income ranges: 0.8% for AGIs below $25k, 1.2% for AGIs $25k-50k, 1.5% for AGIs $50k-75k, 1.5% for AGIs $75k-100k, 1.8% for AGIs $100k-200k, 3.0% for AGIs over 200k)
Taxes paid: $7,171 (reported on 29.9% of returns)
89145:
$7,171
State:
$5,116
(% of AGI for various income ranges: 1.6% for AGIs below $25k, 1.8% for AGIs $25k-50k, 2.1% for AGIs $50k-75k, 2.2% for AGIs $75k-100k, 3.0% for AGIs $100k-200k, 2.9% for AGIs over 200k)
Earned income credit: $2,155 (reported on 18.0% of returns)
Here:
$2,155
State:
$2,279
(% of AGI for various income ranges: 5.6% for AGIs below $25k, 1.0% for AGIs $25k-50k)
Percentage of individuals using paid preparers for their 2012 taxes: 54.5%
Here:
54%
State:
55%
(% for various income ranges: 49.3% for AGIs below $25k, 53.2% for AGIs $25k-50k, 54.5% for AGIs $50k-75k, 56.8% for AGIs $75k-100k, 65.9% for AGIs $100k-200k, 84.0% for AGIs over 200k)
Averages for the 2004 tax year for zip code 89145, filed in 2005:
Average Adjusted Gross Income (AGI) in 2004: $79,215 (Individual Income Tax Returns)
Here:
$79,215
State:
$58,367
Salary/wage: $47,897 (reported on 85.6% of returns)
Here:
$47,897
State:
$42,695
(% of AGI for various income ranges: 105.2% for AGIs below $10k, 80.0% for AGIs $10k-25k, 85.0% for AGIs $25k-50k, 79.0% for AGIs $50k-75k, 77.9% for AGIs $75k-100k, 32.3% for AGIs over 100k)
Taxable interest for individuals: $8,030 (reported on 36.1% of returns)
This zip code:
$8,030
Nevada:
$3,867
(% of AGI for various income ranges: 5.4% for AGIs below $10k, 1.5% for AGIs $10k-25k, 1.1% for AGIs $25k-50k, 1.1% for AGIs $50k-75k, 1.5% for AGIs $75k-100k, 5.2% for AGIs over 100k)
Taxable dividends: $5,780 (reported on 18.5% of returns)
Here:
$5,780
State:
$5,770
(% of AGI for various income ranges: 3.8% for AGIs below $10k, 1.1% for AGIs $10k-25k, 0.6% for AGIs $25k-50k, 0.6% for AGIs $50k-75k, 1.0% for AGIs $75k-100k, 1.7% for AGIs over 100k)
Net capital gain/loss: +$64,760 (reported on 17.6% of returns)
Here:
+$64,760
State:
+$50,644
(% of AGI for various income ranges: -0.5% for AGIs below $10k, 0.2% for AGIs $10k-25k, 0.7% for AGIs $25k-50k, 1.2% for AGIs $50k-75k, 1.4% for AGIs $75k-100k, 23.2% for AGIs over 100k)
Profit/loss from business: +$14,900 (reported on 14.1% of returns)
Here:
+$14,900
State:
+$13,618
(% of AGI for various income ranges: 5.9% for AGIs below $10k, 4.9% for AGIs $10k-25k, 2.0% for AGIs $25k-50k, 2.9% for AGIs $50k-75k, 3.5% for AGIs $75k-100k, 2.4% for AGIs over 100k)
IRA payment deduction: $3,135 (reported on 2.8% of returns)
89145:
$3,135
Nevada:
$3,054
(% of AGI for various income ranges: 0.3% for AGIs $10k-25k, 0.2% for AGIs $25k-50k, 0.2% for AGIs $50k-75k, 0.2% for AGIs $75k-100k, 0.0% for AGIs over 100k)
Self-employed pension: $16,152 (reported on 0.7% of returns)
Here:
$16,152
Nevada:
$16,706
(% of AGI for various income ranges: 0.6% for AGIs below $10k, 0.0% for AGIs $25k-50k, 0.2% for AGIs $50k-75k, 0.2% for AGIs over 100k)
Total itemized deductions: $28,338 (20% of AGI, reported on 44.3% of returns)
Here:
$28,338
State:
$22,990
Here:
20.4% of AGI
State:
21.8% of AGI
(% of AGI for various income ranges: 27.4% for AGIs below $10k, 14.9% for AGIs $10k-25k, 17.8% for AGIs $25k-50k, 19.6% for AGIs $50k-75k, 18.9% for AGIs $75k-100k, 14.1% for AGIs over 100k)
Charity contributions deductions: $3,738 (3% of AGI, reported on 38.8% of returns)
Here:
$3,738
State:
$3,443
Here:
2.5% of AGI
State:
3.1% of AGI
(% of AGI for various income ranges: 1.3% for AGIs below $10k, 1.2% for AGIs $10k-25k, 1.7% for AGIs $25k-50k, 2.1% for AGIs $50k-75k, 2.4% for AGIs $75k-100k, 1.8% for AGIs over 100k)
Total tax: $16,822 (reported on 79.1% of returns)
89145:
$16,822
State:
$10,585
(% of AGI for various income ranges: 3.0% for AGIs below $10k, 4.4% for AGIs $10k-25k, 6.8% for AGIs $25k-50k, 9.3% for AGIs $50k-75k, 11.0% for AGIs $75k-100k, 22.5% for AGIs over 100k)
Earned income credit: $1,594 (reported on 12.7% of returns)
Here:
$1,594
State:
$1,676
Percentage of individuals using paid preparers for their 2004 taxes: 58.2%
Here:
58%
State:
60%
(% for various income ranges: 50.5% for AGIs below $10k, 54.6% for AGIs $10k-25k, 56.4% for AGIs $25k-50k, 60.6% for AGIs $50k-75k, 62.2% for AGIs $75k-100k, 76.3% for AGIs over 100k)
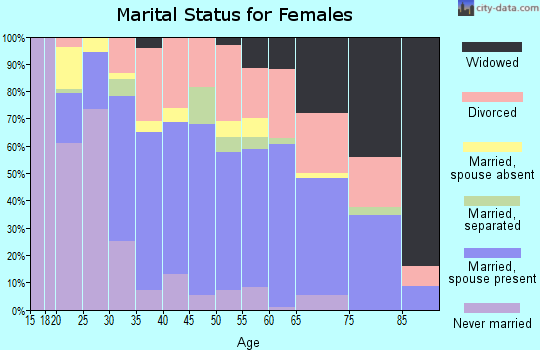
Likely homosexual households (counted as self-reported same-sex unmarried-partner households)
Lesbian couples: 0.1% of all households
Gay men: 0.0% of all households
Household received Food Stamps/SNAP in the past 12 months: 1,436 Household did not receive Food Stamps/SNAP in the past 12 months: 8,735
Women who had a birth in the past 12 months: 454 (324 now married, 131 unmarried) Women who did not have a birth in the past 12 months: 5,770 (2,343 now married, 3,426 unmarried)
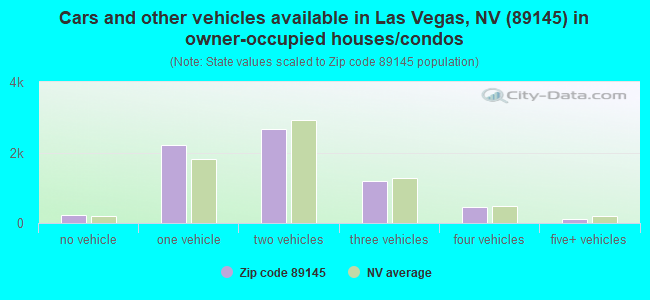
Housing units in zip code 89145 with a mortgage: 4,455 (269 second mortgage, 8 home equity loan, 226 both second mortgage and home equity loan) Houses without a mortgage: 152
Median monthly owner costs for units with a mortgage: $1,475 Median monthly owner costs for units without a mortgage: $514
Residents with income below the poverty level in 2022:
This zip code:
15.2%
Whole state:
12.5%
Residents with income below 50% of the poverty level in 2022:
This zip code:
8.1%
Whole state:
5.9%
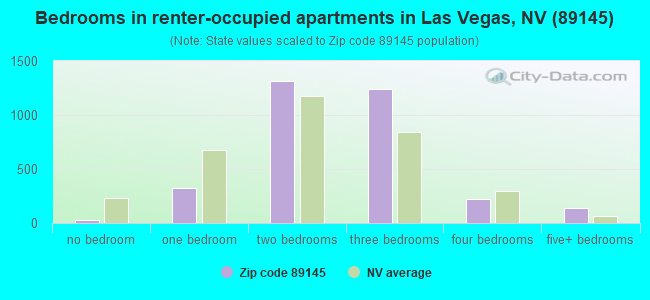
Median number of rooms in houses and condos:
Here:
5.8
State:
6.0
Median number of rooms in apartments:
Here:
4.6
State:
4.2
Notable locations in this zip code not listed on our city pages
Notable locations in zip code 89145: Badlands Golf Course (A), Johnson Track Break Center (B), Suncoast Hotel and Casino (C). Display/hide their locations on the map
Churches in zip code 89145 include: International Church of Las Vegas (A), Newsong Christian Church (B), New Life Seventh Day Adventist Church (C). Display/hide their locations on the map
Parks in zip code 89145 include: Angel Park (1), Ansan Park (2), Johnson Community School Park (3), Smith Playground (4). Display/hide their locations on the map
Tourist attractions (not listed on the city page) : Time-Out at Suncoast (Amusement & Theme Parks; 9090 Alta Drive), A Vegas Expression Event Planning (Tours & Charters; 8145 Autumn Star Ave.).
2,757 married couples with children.
1,758 single-parent households (741 men, 1,017 women).
65.6% of residents of 89145 zip code speak English at home.
24.8% of residents speak Spanish at home (75% very well, 11% well, 10% not well, 4% not at all).
3.5% of residents speak other Indo-European language at home (82% very well, 12% well, 6% not well).
5.7% of residents speak Asian or Pacific Island language at home (52% very well, 38% well, 9% not well).
0.5% of residents speak other language at home (96% very well, 2% well, 2% not well).
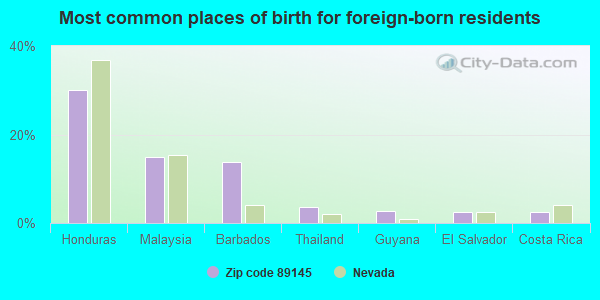
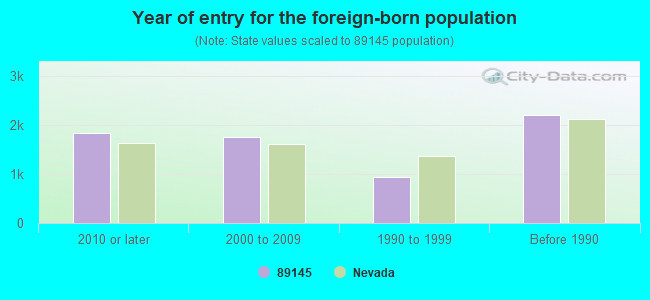
Foreign born population: 6,099 (22.5%) (60.4% of them are naturalized citizens)
Facilities with environmental interests located in this zip code:
HELEN M SMITH ELEMENTARY SCHOOL (7101 PINEDALE AVE. in LAS VEGAS, NV)
(Geographic Names Information System) (National Center for Education Statistics) - STATE ID-02-264 Organizations: CLARK CO SCH DIST (SCHOOL DISTRICT)
Alternative names: SMITH, HELEN ELEM
HOME DEPOT USA INC HD3301 (861 S RAINBOW BLVD in LAS VEGAS, NV)
Small Quantity Generators, between 100 kg and 1000 kg of hazardous waste/month (Resource Conservation and Recovery Act (tracking hazardous waste)) Organizations: THE HOME DEPOT (CONTACT/OWNER)
Alternative names: HOME DEPOT NO 3301 THE
SOUTHERN NEVADA PAVING (DBA BARDON MATERIALS) (WESTERN BELTWAY & CHARLESTON in LAS VEGAS, NV)
CRITERIA AND HAZARDOUS AIR POLLUTANT INVENTORY (Inventory of air pollution sources) TRI REPORTER (Tracking of toxic chemicals releasing facilities) Business SIC classification: ASPHALT PAVING MIXTURES AND BLOCKS Alternative names: SOUTHERN NEVADA PAVING CHARLESTON
CLASSIC CLEANERS OF LAS VEGAS (200 S RAINBOW in LAS VEGAS, NV)
Conditionally Exempt Small Quantity Generators, less than 100 kg/month of hazardous waste (Resource Conservation and Recovery Act (tracking hazardous waste))
GREEN VALLEY GROCERY (7540 WEST CLIFF in LAS VEGAS, NV)
ENFORCEMENT/COMPLIANCE ACTIVITY (Integrated Compliance Information System)
Housing units lacking complete plumbing facilities: 0.2% Housing units lacking complete kitchen facilities: 0.4%
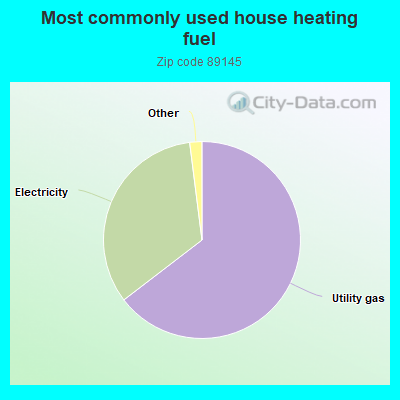
64.6%Utility gas
33.4%Electricity
0.9%Bottled, tank, or LP gas
0.6%Solar energy
Place of birth for U.S.-born residents:
This state: 6,453
Northeast: 2,147
Midwest: 3,004
South: 2,216
West: 6,487
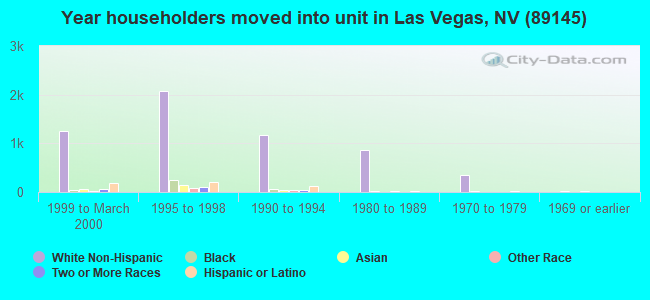
41% of the 89145 zip code residents lived in the same house 5 years ago. Out of people who lived in different houses, 60% lived in this county. Out of people who lived in different counties, 50% lived in Nevada.
89% of the 89145 zip code residents lived in the same house 1 year ago. Out of people who lived in different houses, 61% moved from this county. Out of people who lived in different houses, 3% moved from different county within same state. Out of people who lived in different houses, 33% moved from different state. Out of people who lived in different houses, 6% moved from abroad.
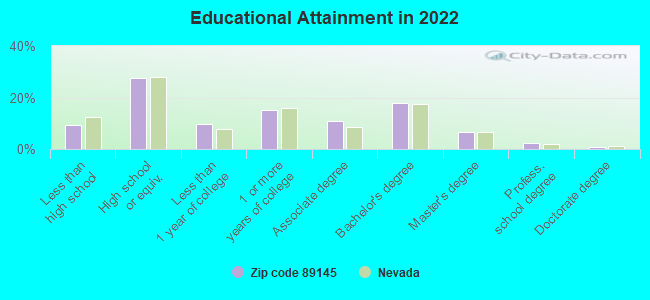
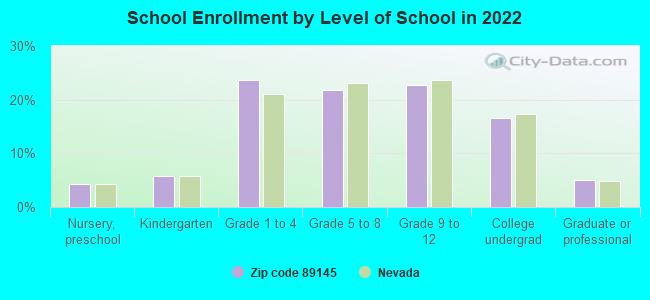
Private vs. public school enrollment:
Students in private schools in grades 1 to 8 (elementary and middle school): 441
Here:
17.2%
Nevada:
12.9%
Students in private schools in grades 9 to 12 (high school): 90
Here:
7.2%
Nevada:
6.9%
Students in private undergraduate colleges: 93
Here:
10.3%
Nevada:
16.0%
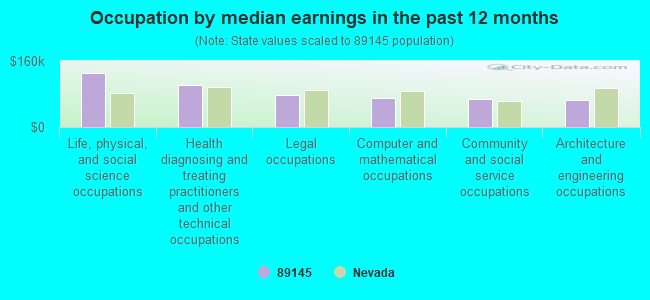
Occupation by median earnings in the past 12 months ($)
130,102Life, physical, and social science occupations
102,579Health diagnosing and treating practitioners and other technical occupations
77,946Legal occupations
70,686Computer and mathematical occupations
67,547Community and social service occupations
66,627Architecture and engineering occupations
Companies with federal contracts located in this zip code (LAS VEGAS, NV):
NUVISIONS INC (628 AMPERE LN; small business)
$100,000 with Navy for Training/Curriculum Development. Signed on 2005-09-14. Completion date: 2005-11-30.
HOT SPUR RESORTS NEVADA INC (221 N RAMPART BLVD) : $58,293 in 3 contractsin 2003
$39,873 with Army for Lodging - Hotel/Motel. Signed on 2003-03-21. Completion date: 2003-03-28.
$15,716, same as above.Signed on 2003-11-21. Completion date: 2003-12-06.
$2,704, same as above.Signed on 2003-05-30. Completion date: 2003-03-28.
KERIF NIGHT VISION (829 ANTELOPE WAY; small business) : $31,502 in 5 contractsin 2005
Contracts for Night Vision Equipment, Emitted and Reflected Radiation, Batteries, Rechargeable by Navy Signed by year:2000: $0; 2001: $0; 2002: $0; 2003: $0; 2004: $0; 2005: $31,502; 2006: $0.
Biggest contracts:
$9,350 with Navy for Night Vision Equipment, Emitted and Reflected Radiation. Signed on 2005-08-19. Completion date: 2005-08-26.
$9,184 with Navy for Batteries, Rechargeable. Signed on 2005-08-10. Completion date: 2005-08-28.
$6,507 with Navy for Night Vision Equipment, Emitted and Reflected Radiation. Signed on 2005-02-22. Completion date: 2005-06-20.
$5,730, same as above.Signed on 2005-08-16. Completion date: 2005-08-30.
AMRAD,INC (931 PAISLEY STREET; small business)
$26,267 with Defense Logistics Agency for Radio and Television Communication Equipment, Except Airborne. Signed on 2006-04-17. Completion date: 2006-05-17.
BRAWNER AEROSPACE INC (725 S HUALAPAI WAY UNIT 10; small business) : $15,155 in 3 contractsin 2004
$7,562 with Army for Vocational/Technical. Signed on 2004-05-20. Completion date: 2004-06-01.
$6,242 with Army for Other Education and Training Services. Signed on 2004-07-27. Completion date: 2004-08-23.
$1,351, same as above.Signed on 2004-07-28. Completion date: 2004-08-23.
Top industries in this zip code by the number of employees in 2005:
2002 - 2018 National Fire Incident Reporting System (NFIRS) incidents
Based on the data from the years 2002 - 2018 the average number of fire incidents per year is 41. The highest number of fires - 63 took place in 2006, and the least - 0 in 2003. The data has a growing trend.
When looking into fire subcategories, the most incidents belonged to: Outside Fires (45.0%), and Structure Fires (33.9%).
Fire incident types reported to NFIRS in Zip Code 89145

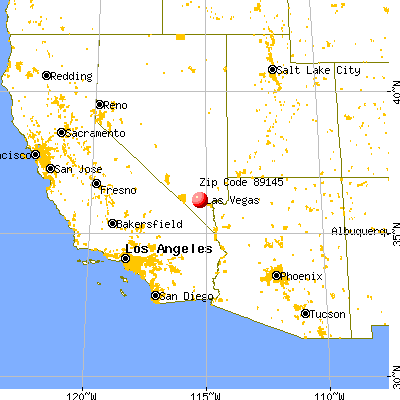


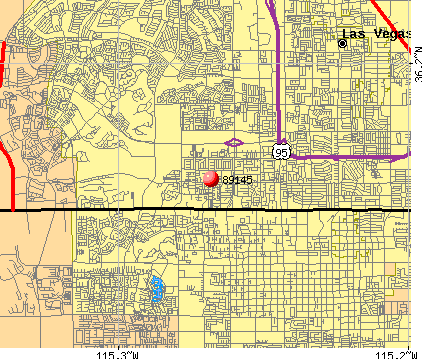 Nearest zip codes: 89117, 89128, 89144, 89134, 89147, 89146.


 Based on the data from the years 2002 - 2018 the average number of fire incidents per year is 41. The highest number of fires - 63 took place in 2006, and the least - 0 in 2003. The data has a growing trend.
 When looking into fire subcategories, the most incidents belonged to: Outside Fires (45.0%), and Structure Fires (33.9%).